Bibliography – Sudden cardiac death, Heart Attack, Chest Pain, Cardiac Arrest and more …
Sudden cardiac death (SCD)
Sudden cardiac death (SCD) is a sudden, unexpected death caused by a change in heart rhythm sudden cardiac arrest. Unexpected rapid natural death due to cardiovascular collapse within one hour of initial symptoms. It is usually caused by the worsening of existing heart diseases. The sudden onset of symptoms, such as CHEST PAIN and CARDIAC ARRHYTHMIA, particularly VENTRICULAR TACHYCARDIA, can lead to the loss of consciousness and cardiac arrest followed by biological death.1
Sudden Cardiac Arrest
Sudden cardiac arrest occurs when the electrical system to the heart malfunctions and suddenly becomes very irregular. The heart beats dangerously fast. The ventricles may flutter or quiver (ventricular fibrillation), and blood is not delivered to the body. In the first few minutes, the greatest concern is that blood flow to the brain will be reduced so drastically that a person will lose consciousness. Death follows unless emergency treatment is begun immediately.1
Heart Attack
Let’s say that you’re stuck in traffic and cars are backed up as far as you can see. It turns out there’s an accident blocking traffic lanes. This is similar to what happens during a heart attack, also known as myocardial infarction (MI). Blood flow to the heart muscle is occluded (i.e. obstructed), leading to a loss of blood supply (ischemia) and death for heart tissue.2
A heart attack occurs when an artery supplying your heart with blood and oxygen becomes blocked. Fatty deposits build up over time, forming plaques in your heart’s arteries. If a plaque ruptures, a blood clot can form and block your arteries, causing a heart attack.3
Chest Pain for reference
Chest pain is one of the most high risk chief complaints you will see in any setting. However, accurately diagnosing the etiology of acute chest pain in the emergency department is very difficult because neither the quality nor intensity of the pain is specific to any particular organ. Furthermore, presentations vary significantly even among the most common life-threatening diseases. The potential for a life threatening processes always exists even if there are normal initial vital signs or atypical features. In almost every case of undifferentiated chest pain the experienced clinicians will at least initially consider the top three common causes of morbidity and mortality: ACS, pulmonary embolism, and aortic dissection. In many cases, the experienced clinician will also consider and prepare for potential several other less common life-threatening conditions: tension pneumothorax, esophageal rupture, and pericarditis with potential cardiac tamponade.4
Introduction
Recently several marker based on ECG Signal were developed that pose high prediction value for SCD. Among these markers are T-wave alternans (TWA), heart rate variability (HRV), heart rate turbulence (HRT) and deceleration capacity (DC).1
T-Wave Alternans (TWA)
T-Wave Alternans (TWA)
Previous clinical study shows comparable prediction value of TWA and electrophysiology study (EPS) in prognosis of cardiac events caused by ventricular arrhythmia. Positive TWA assessment successfully identifies a high-risk patient with high probability of dangerous ventricular arrhythmia and SCD occurrence. TWA assessment has also a high negative prognostic value comparable with EPS. The advantage of TWA over EPS is its noninvasiveness.1
Heart Rate Variability (HRV)
Heart rate variability (HRV) defines short-term time differences in duration of consecutive RR distances in sinusoidal rhythm registered in ECG signal. The most acknowledged parameter is standard deviation of all normal RR intervals (SDNN), which value below 50 ms is considered abnormal. It was verified in numerous publications that lowered HRV is an independent risk factor in patients with myocardial infarction.1
Heart Rate Turbulence (HRT)
Heart rate turbulence (HRT) is a physiological, two phase response of sinoatrial node to premature ventricular contraction (PVC). This response consists of short heart rate acceleration phase, after which the heart rate slows to a normal pace.1
Deceleration capacity (DC)
During Deceleration capacity (DC) and corresponding acceleration capacity (AC) provide a quantitative assessment of heart rhythm capacity to decelerate and accelerate respectively. Parameter values are calculated using phase-rectified signal averaging (PRSA) method, after synchronization of all periodic oscillations of RR intervals excluding all non-periodic distortions (artifacts, noise, etc.)1
ST Analysis
Routine electrocardiographic ECG monitoring is standard practice in coronary and intensive care units, emergency rooms, ambulatory monitoring settings, and operating rooms. rate and the detection of arrhythmia and continuous ST segment monitoring to detect ST changes which may be ischemic episodes. Ischemia detection has always been an important component in identifying and managing patients with coronary artery disease.
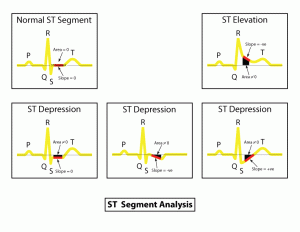
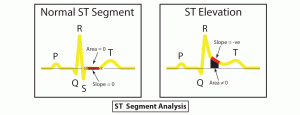
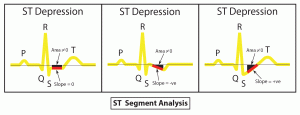
The current standard of determining the ST segment measurement is by measuring the voltage difference between the value at a point 60 or 80 milliseconds after the J-point and the isoelectric baseline. The isoelectric baseline is either between the P- and Q-waves (the P-R interval) or in front of the P-wave (the T-P interval).
Although there is no standard for ECG diagnosis of myocardial ischemia, ST segment changes of greater than one millimeter are generally considered significant. When the ST segment is measured at or near the J-point, it is important to differentiate between changes that are significant and those that may be affected by the heart rate. It is therefore necessary to give a description of the ST segment slope. The slope of the ST segment is often described as “horizontal,” or “downsloping,” both of which are significant, or “upsloping” which is not significant and is possibly influenced by heart rate.5
QT Analysis
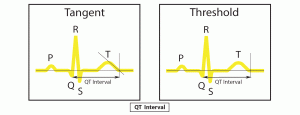
The QT interval is the time from the start of the Q wave to the end of the T wave. It represents the time taken for ventricular depolarisation and repolarisation, effectively the period of ventricular systole from ventricular isovolumetric contraction to isovolumetric relaxation.
The QT interval is most commonly measured in lead II for evaluation of serial ECGs, with leads I and V5 being comparable alternatives to lead II. Leads III, aVL and V1 are generally avoided for measurement of QT interval.[1] The accurate measurement of the QT interval is subjective[2] because the end of the T wave is not always clearly defined and usually merges gradually with the baseline. QT interval in an ECG complex can be measured manually by different methods, such as the threshold method, in which the end of the T wave is determined by the point at which the component of the T wave merges with the isoelectric baseline, or the tangent method, in which the end of the T wave is determined by the intersection of a tangent line extrapolated from the T wave at the point of maximum downslope to the isoelectric baseline.6
The QT interval is inversely proportional to heart rate:
- The QT interval shortens at faster heart rates
- The QT interval lengthens at slower heart rates
- An abnormally prolonged QT is associated with an increased risk of ventricular arrhythmias, especially Torsades de Pointes.
- Congenital short QT syndrome has been found to be associated with an increased risk of paroxysmal atrial and ventricular fibrillation and sudden cardiac death.7
Normal QTc values
- QTc is prolonged if > 440ms in men or > 460ms in women
- QTc > 500 is associated with increased risk of torsades de pointes
- QTc is abnormally short if < 350ms
- A useful rule of thumb is that a normal QT is less than half the preceding RR interval
First & Second Derivative Based Technique (FDBT) & (SDBT)
This method is also called Hamilton-Tompkins method. The QRS detection is achieved by performing first derivatives of the ECG samples. This is because the QRS complex generally has the steepest slope and has the maximal magnitude as well. RR interval can be measured by several first derivatives based QRS detection techniques described in the literature (Mahoudeaux, 1981; Menrad et al., 1981; Hosinger et al, 1971).8
Previous research reveals several second derivative based QRS detection algorithms. A modified version equation was the absolute values of first (y0) and second (y1) derivative.8
Further Reading
Title: Heart Attack3
Title: Chest Pain
Title: A Mobile Device Based ECG Analysis System8
Title: A Mobile Device System for Early Warning of ECG Anomalies9
Title: What’s a NSTEMI? Non ST Segment Myocardial Infarction11
Title: Heart Rate Turbulence: Standards of Measurement, Physiological Interpretation, and Clinical Use12
Title: Measuring the T Wave of the Electrocardiogram; The How and Why14
Title: Delphi Worlds15
Title: PQRST Wave Complex16
Title: Heart Rate Variability17
List of Bibliography


