ECG Interpretation – How to interpret ECG heart sinus rhythm?
ECG Interpretation – How to interpret ECG/EKG heart sinus rhythm? More than 30 types of sinus can be detected by ECGMonitor.
Zero-Crossing Frequency Technology
‘Zero-Crossing Frequency’ Technology is a kind of computing algorithm to capture and to measure the maxima, the minima and the turning points of PQRST-Complex. It also calculates and finds out all of the timing intervals such as P-Interval, PR-Segment, PR-Interval, RR-Interval, QRS-Interval, QT-Interval, ST-Segment, ST-Interval & etc.
This technology is used to calculate the PQRST-Complex voltage and to analyze +P, Inverted-P, Bi-Phasic-P, Grant-P, +Q, Prolong Q, +S, -S, +T, Inverted-T, Grant-T & etc.
With the help of ‘Heart Rate Variability’. it is easily to find out the heart disease such as Atrial Fibrillation, Sinus Arrhythmia, Second Degree AV Block.
The function of ‘Heart Rate Turbulence’ is used to find out the abnormality heart disease such as Sinus Bradycardia, Sinus Tachycardia, Premature Ventricular Contraction, Wolff Parkinson White, Ventricular Fibrillation, Osborn Wave & etc.
ST-Analysis is used to analyze ST-Segment. It finds out the ‘Area Above the ST-Segment’, ‘Area Under the ST-Segment’ or ‘Horizontal ST-Segment’. It also find out the slope of ST-Segment. Finally, the ST-Analysis is used to determine the importance of STEMI, NSTEMI and Myocardial Ischemia.
ECG Interpretation by ECGMonitor
PQRST-Complex Basic Timing Diagram
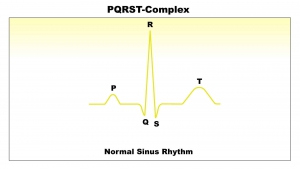
Normal Sinus Rhythm Single Pulse PQRST-Complex (Single Pulse)
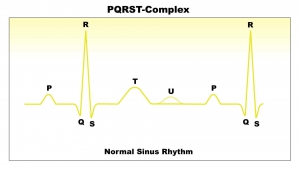
Normal Sinus Rhythm Full Single Pulse
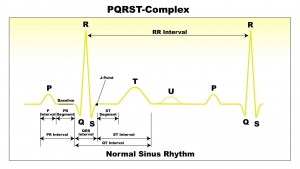
PQRST-Complex Basic Timing Diagram
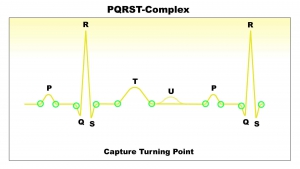
Capture All Turning Points Located on PQRST-Complex
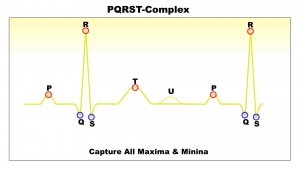
Capture All Maxima & Minima Located on PQRST-Complex
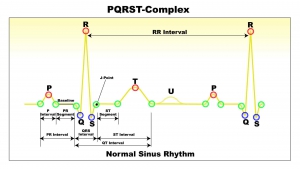
PQRST-Complex Basic-Timing-Diagram All Maxima, Minima & All Turning-Points
ST-Analysis
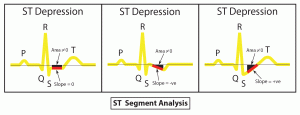
ST-Segment is Below the Baseline. Area Under the Curve is Negative.
-Horizontal Depression (Left Diagram)
-Downsloping Depression (Mid Diagram)
-Upsloping Depression (Right Diagram)
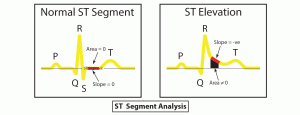
ST-Normal (Left Diagram)
ST-Segment is on the Baseline. Area Under the Curve is approximately Zero.
ST-Elevation (Right Diagram)
ST-Segment is Above the Baseline. Area Under the Curve is Positive.
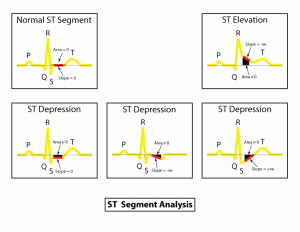
ST-Analysis
-Normal ST-Segment (Left Up Diagram)
-Depression ST-Segment (Bottom Diagram)
-Elevation ST-Segment (Right Up Diagram)
ECG Interpretation – How to interpret ECG/EKG sinus rhythm?
More than 30 kinds of ECG/EKG sinus rhythm, ecgMonitor can detect and analyze these ecg/ekg patterns.
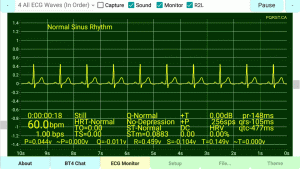
Normal-Sinus-Rhythm
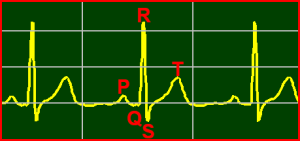
1 Normal Sinus Rhythm
正常竇性心律
| 0:00:00:00 | Still | Q-Normal | +T | 0.00dB | pr-148ms |
| 60bpm | HRT-Normal | No-Depression | +P | 256sps | qrs-105ms |
| 1bps | TO=0 | ST-Normal | DC | HRV | qtc-477ms |
| TS=0 | STm=0.0883 | 0 | 0.00% |
| P=0.044v | ~P=0v | Q=-0.011v | R=0.459v | S=-0.104v | T=0.149v | ~T=0v |
ECG Interpretation
Normal Sinus Rhythm
1 Normal Sinus Rhythm
- Rate = 60bpm (60-100 bpm)
- P-Wave Present (Atrial Depolarization)
- PR-Interval = 148ms. (Normal 0.12s-0.20s + Allowance)
- QRS Interval = 105ms. (Normal 0.06s-0.12s + Allowance)
- QTc Interval = 477ms. (QTc is abnormally short if < 350ms. QTc is prolonged if > 440ms in men or > 460ms in women + Allowance)
- Heart Rate Variability = 0.00% smaller than 5.00%
- Deceleration Capacity: 0
- PQRST-Status: +P Wave, Q-Normal Wave, +T Wave
- ST-Analysis: ST-Normal
- No-Depression: ST-Segment Area Under the Curve is approximately zero.
- ST-Slope: STm=0.0883
- Heart Rate Turbulence: TO=0, TS=0
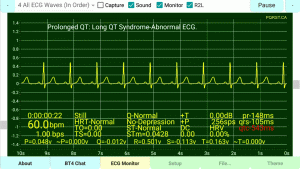
ecg/ekg-Sample
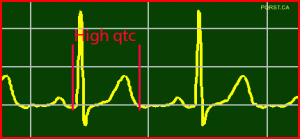
2 ECG Sample
心電圖樣本
| 0:00:00:00 | Still | Q-Normal | +T | 0.00dB | pr-148ms |
| 60bpm | HRT-Normal | No-Depression | +P | 256sps | qrs-105ms |
| 1bps | TO=0 | ST-Normal | DC | HRV | qtc-543ms |
| TS=0 | STm=0.0428 | 0 | 0.00% |
| P=0.048v | ~P=0v | Q=-0.012v | R=0.501v | S=-0.113v | T=0.163v | ~T=0v |
ECG Interpretation
Prolonged QT: Long QT Syndrome-Abnormal ECG.
2 ECG Sample
- Rate = 60bpm (60-100 bpm)
- P-Wave Present (Atrial Depolarization)
- PR-Interval = 148ms. (Normal 0.12s-0.20s + Allowance)
- QRS Interval = 105ms. (Normal 0.06s-0.12s + Allowance)
- QTc Interval = 543ms. (QTc is abnormally short if < 350ms. QTc is prolonged if > 440ms in men or > 460ms in women + Allowance)
- Heart Rate Variability = 0.00% smaller than 5.00%
- Deceleration Capacity: 0
- PQRST-Status: +P Wave, Q-Normal Wave, +T Wave
- ST-Analysis: ST-Normal
- No-Depression: ST-Segment Area Under the Curve is approximately zero.
- ST-Slope: STm=0.0428
- Heart Rate Turbulence: TO=0, TS=0
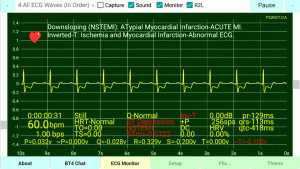
Downsloping-Myocardial-Ischemia-(NSTEMI)-Inverted-T
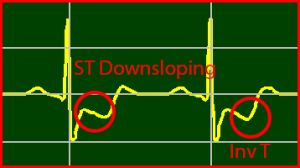
3 Downsloping - Myocardial Ischemia (NSTEMI)
下坡-心肌缺血
| 0:00:00:00 | Still | Q-Normal | Inv-T | 0.00dB | pr-129ms |
| 60bpm | HRT-Normal | ST Depression | +P | 256sps | qrs-113ms |
| 1bps | TO=0 | NSTEMI | DC | HRV | qtc-418ms |
| TS=0 | STm=-0.0722 | 0 | 0.00% |
| P=0.032v | ~P=0v | Q=-0.028v | R=0.329v | S=-0.2v | T=0v | ~T=-0.102v |
ECG Interpretation
Downsloping (NSTEMI): ATypial Myocardial Infarction-ACUTE MI.
Inverted-T: Ischemia and Myocardial Infarction-Abnormal ECG.
3 Downsloping - Myocardial Ischemia (NSTEMI)
- Rate = 60bpm (60-100 bpm)
- P-Wave Present (Atrial Depolarization)
- PR-Interval = 129ms. (Normal 0.12s-0.20s + Allowance)
- QRS Interval = 113ms. (Normal 0.06s-0.12s + Allowance)
- QTc Interval = 418ms. (QTc is abnormally short if < 350ms. QTc is prolonged if > 440ms in men or > 460ms in women + Allowance)
- Heart Rate Variability = 0.00% smaller than 5.00%
- Deceleration Capacity: 0
- PQRST-Status: +P Wave, Q-Normal Wave, Inv-T Wave
- ST-Analysis: NSTEMI
- ST Depression: ST-Segment Area Under the Curve is negative.
- ST-Slope: STm=-0.0722
- Heart Rate Turbulence: TO=0, TS=0
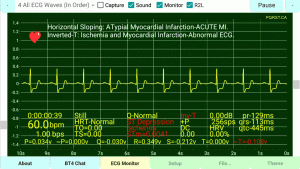
Horizontal-Sloping-Myocardial-Ischemia
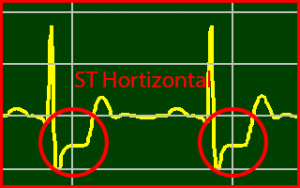
4 Horizontal Sloping - Myocardial Ischemia
水平傾斜-心肌缺血
| 0:00:00:00 | Still | Q-Normal | +T | 0.00dB | pr-129ms |
| 60bpm | HRT-Normal | ST Depression | +P | 256sps | qrs-113ms |
| 1bps | TO=0 | Ischemia | DC | HRV | qtc-445ms |
| TS=0 | STm=0.0041 | 0 | 0.00% |
| P=0.034v | ~P=0v | Q=-0.03v | R=0.349v | S=-0.212v | T=0.081v | ~T=0v |
ECG Interpretation
Horizontal Sloping: ATypial Myocardial Infarction-ACUTE MI.
4 Horizontal Sloping - Myocardial Ischemia
- Rate = 60bpm (60-100 bpm)
- P-Wave Present (Atrial Depolarization)
- PR-Interval = 129ms. (Normal 0.12s-0.20s + Allowance)
- QRS Interval = 113ms. (Normal 0.06s-0.12s + Allowance)
- QTc Interval = 445ms. (QTc is abnormally short if < 350ms. QTc is prolonged if > 440ms in men or > 460ms in women + Allowance)
- Heart Rate Variability = 0.00% smaller than 5.00%
- Deceleration Capacity: 0
- PQRST-Status: +P Wave, Q-Normal Wave, +T Wave
- ST-Analysis: Ischemia
- ST Depression: ST-Segment Area Under the Curve is negative.
- ST-Slope: STm=0.0041
- Heart Rate Turbulence: TO=0, TS=0
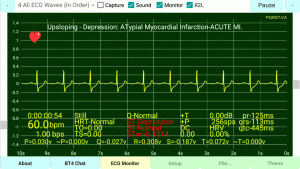
Upsloping-Depression
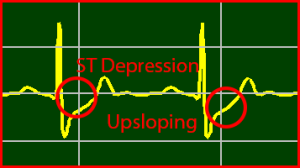
5 Upsloping - Depression
上坡-抑鬱
| 0:00:00:00 | Still | Q-Normal | +T | 0.00dB | pr-125ms |
| 60bpm | HRT-Normal | ST Depression | +P | 256sps | qrs-113ms |
| 1bps | TO=0 | ST-Normal | DC | HRV | qtc-445ms |
| TS=0 | STm=0.1314 | 0 | 0.00% |
| P=0.03v | ~P=0v | Q=-0.027v | R=0.308v | S=-0.187v | T=0.072v | ~T=0v |
ECG Interpretation
Upsloping – Depression: ATypial Myocardial Infarction-ACUTE MI.
5 Upsloping - Depression
- Rate = 60bpm (60-100 bpm)
- P-Wave Present (Atrial Depolarization)
- PR-Interval = 125ms. (Normal 0.12s-0.20s + Allowance)
- QRS Interval = 113ms. (Normal 0.06s-0.12s + Allowance)
- QTc Interval = 445ms. (QTc is abnormally short if < 350ms. QTc is prolonged if > 440ms in men or > 460ms in women + Allowance)
- Heart Rate Variability = 0.00% smaller than 5.00%
- Deceleration Capacity: 0
- PQRST-Status: +P Wave, Q-Normal Wave, +T Wave
- ST-Analysis: ST-Normal
- ST Depression: ST-Segment Area Under the Curve is negative.
- ST-Slope: STm=0.1314
- Heart Rate Turbulence: TO=0, TS=0
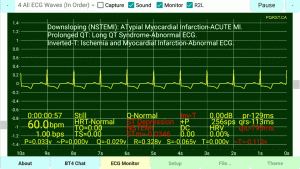
Downsloping-Inverted-T-Myocardial-Ischemia-(NSTEMI)
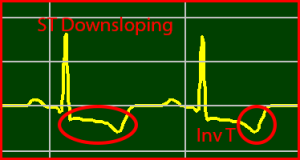
6 Downsloping Inverted T
下坡-倒T
| 0:00:00:00 | Still | Q-Normal | Inv-T | 0.00dB | pr-129ms |
| 60bpm | HRT-Normal | ST Depression | +P | 256sps | qrs-137ms |
| 1bps | TO=0 | NSTEMI | DC | HRV | qtc-793ms |
| TS=0 | STm=-0.0346 | 0 | 0.00% |
| P=0.033v | ~P=0v | Q=-0.029v | R=0.328v | S=-0.065v | T=0v | ~T=-0.113v |
ECG Interpretation
Downsloping (NSTEMI): ATypial Myocardial Infarction-ACUTE MI.
Prolonged QT: Long QT Syndrome-Abnormal ECG.
6 Downsloping Inverted T
- Rate = 60bpm (60-100 bpm)
- P-Wave Present (Atrial Depolarization)
- PR-Interval = 129ms. (Normal 0.12s-0.20s + Allowance)
- QRS Interval = 137ms. (Normal 0.06s-0.12s + Allowance)
- QTc Interval = 793ms. (QTc is abnormally short if < 350ms. QTc is prolonged if > 440ms in men or > 460ms in women + Allowance)
- Heart Rate Variability = 0.00% smaller than 5.00%
- Deceleration Capacity: 0
- PQRST-Status: +P Wave, Q-Normal Wave, Inv-T Wave
- ST-Analysis: NSTEMI
- ST Depression: ST-Segment Area Under the Curve is negative.
- ST-Slope: STm=-0.0346
- Heart Rate Turbulence: TO=0, TS=0
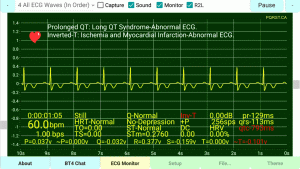
Inverted-T-Wave
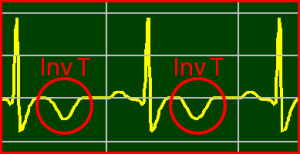
7 Inverted T
倒T
| 0:00:00:00 | Still | Q-Normal | Inv-T | 0.00dB | pr-129ms |
| 60bpm | HRT-Normal | No-Depression | +P | 256sps | qrs-113ms |
| 1bps | TO=0 | ST-Normal | DC | HRV | qtc-793ms |
| TS=0 | STm=0.2760 | 0 | 0.00% |
| P=0.037v | ~P=0v | Q=-0.032v | R=0.377v | S=-0.159v | T=0v | ~T=-0.101v |
ECG Interpretation
Prolonged QT: Long QT Syndrome-Abnormal ECG.
Inverted-T: Ischemia and Myocardial Infarction-Abnormal ECG.
7 Inverted T
- Rate = 60bpm (60-100 bpm)
- P-Wave Present (Atrial Depolarization)
- PR-Interval = 129ms. (Normal 0.12s-0.20s + Allowance)
- QRS Interval = 113ms. (Normal 0.06s-0.12s + Allowance)
- QTc Interval = 793ms. (QTc is abnormally short if < 350ms. QTc is prolonged if > 440ms in men or > 460ms in women + Allowance)
- Heart Rate Variability = 0.00% smaller than 5.00%
- Deceleration Capacity: 0
- PQRST-Status: +P Wave, Q-Normal Wave, Inv-T Wave
- ST-Analysis: ST-Normal
- No-Depression: ST-Segment Area Under the Curve is approximately zero.
- ST-Slope: STm=0.2760
- Heart Rate Turbulence: TO=0, TS=0
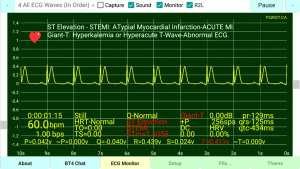
Positive-S-Prolong-T-Wave
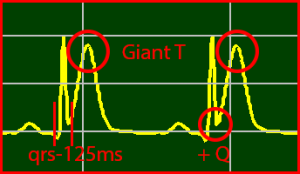
8 Positive S & Prolong T
正S和延長T
| 0:00:00:00 | Still | Q-Normal | Giant-T | 0.00dB | pr-129ms |
| 60bpm | HRT-Normal | ST Elevation | +P | 256sps | qrs-125ms |
| 1bps | TO=0 | STEMI | DC | HRV | qtc-434ms |
| TS=0 | STm=1.1059 | 0 | 0.00% |
| P=0.042v | ~P=0v | Q=-0.04v | R=0.439v | S=0.024v | T=0.411v | ~T=0v |
ECG Interpretation
ST Elevation – STEMI: ATypial Myocardial Infarction-ACUTE MI.
Giant-T: Hyperkalemia or Hyperacute T-Wave-Abnormal ECG.
8 Positive S & Prolong T
- Rate = 60bpm (60-100 bpm)
- P-Wave Present (Atrial Depolarization)
- PR-Interval = 129ms. (Normal 0.12s-0.20s + Allowance)
- QRS Interval = 125ms. (Normal 0.06s-0.12s + Allowance)
- QTc Interval = 434ms. (QTc is abnormally short if < 350ms. QTc is prolonged if > 440ms in men or > 460ms in women + Allowance)
- Heart Rate Variability = 0.00% smaller than 5.00%
- Deceleration Capacity: 0
- PQRST-Status: +P Wave, Q-Normal Wave, Giant-T Wave
- ST-Analysis: STEMI
- ST Elevation: ST-Segment Area Under the Curve is positive.
- ST-Slope: STm=1.1059
- Heart Rate Turbulence: TO=0, TS=0
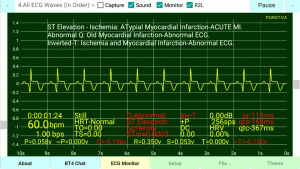
Positive-Horizontal-ST-Inverted-T-Wave
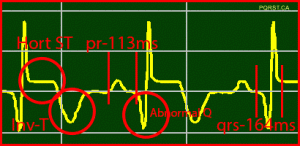
9 Positive Horizontal ST & Inverted T
正向水平ST和倒T
| 0:00:00:00 | Still | Q-Abnormal | Inv-T | 0.00dB | pr-113ms |
| 60bpm | HRT-Normal | ST Elevation | +P | 256sps | qrs-164ms |
| 1bps | TO=0 | Ischemia | DC | HRV | qtc-781ms |
| TS=0 | STm=0.0003 | 0 | 0.00% |
| P=0.058v | ~P=0v | Q=-0.196v | R=0.35v | S=0.053v | T=0v | ~T=-0.152v |
ECG Interpretation
ST Elevation – Ischemia: ATypial Myocardial Infarction-ACUTE MI.
Prolonged QT: Long QT Syndrome-Abnormal ECG.
Abnormal Q: Old Myocardial Infarction-Abnormal ECG.
9 Positive Horizontal ST & Inverted T
- Rate = 60bpm (60-100 bpm)
- P-Wave Present (Atrial Depolarization)
- PR-Interval = 113ms. (Normal 0.12s-0.20s + Allowance)
- QRS Interval = 164ms. (Normal 0.06s-0.12s + Allowance)
- QTc Interval = 781ms. (QTc is abnormally short if < 350ms. QTc is prolonged if > 440ms in men or > 460ms in women + Allowance)
- Heart Rate Variability = 0.00% smaller than 5.00%
- Deceleration Capacity: 0
- PQRST-Status: +P Wave, Q-Abnormal Wave, Inv-T Wave
- ST-Analysis: Ischemia
- ST Elevation: ST-Segment Area Under the Curve is positive.
- ST-Slope: STm=0.0003
- Heart Rate Turbulence: TO=0, TS=0
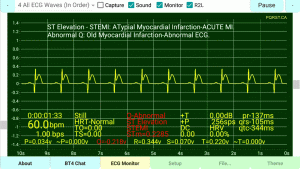
STEMI-Extended-Q-Normalize-ST
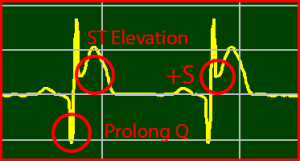
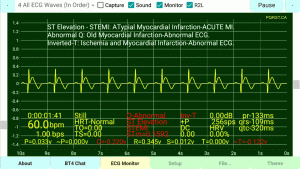
10 STEMI Ext Q Normalize ST
STEMI擴展Q歸化ST
| 0:00:00:00 | Still | Q-Abnormal | +T | 0.00dB | pr-137ms |
| 60bpm | HRT-Normal | ST Elevation | +P | 256sps | qrs-105ms |
| 1bps | TO=0 | STEMI | DC | HRV | qtc-344ms |
| TS=0 | STm=0.2285 | 0 | 0.00% |
| P=0.034v | ~P=0v | Q=-0.218v | R=0.344v | S=0.07v | T=0.22v | ~T=0v |
ECG Interpretation
ST Elevation – STEMI: ATypial Myocardial Infarction-ACUTE MI.
Abnormal Q: Old Myocardial Infarction-Abnormal ECG.
10 STEMI Ext Q Normalize ST
- Rate = 60bpm (60-100 bpm)
- P-Wave Present (Atrial Depolarization)
- PR-Interval = 137ms. (Normal 0.12s-0.20s + Allowance)
- QRS Interval = 105ms. (Normal 0.06s-0.12s + Allowance)
- QTc Interval = 344ms. (QTc is abnormally short if < 350ms. QTc is prolonged if > 440ms in men or > 460ms in women + Allowance)
- Heart Rate Variability = 0.00% smaller than 5.00%
- Deceleration Capacity: 0
- PQRST-Status: +P Wave, Q-Abnormal Wave, +T Wave
- ST-Analysis: STEMI
- ST Elevation: ST-Segment Area Under the Curve is positive.
- ST-Slope: STm=0.2285
- Heart Rate Turbulence: TO=0, TS=0
STEMI-Extended-Q-Normalize-ST-Inverted-T-Wave
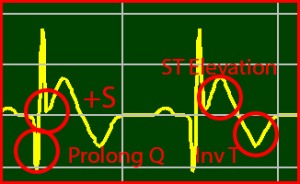
11 STEMI Ext Q Normalize ST Inverted T
STEMI擴展Q歸化ST和倒T
| 0:00:00:00 | Still | Q-Abnormal | Inv-T | 0.00dB | pr-133ms |
| 60bpm | HRT-Normal | ST Elevation | +P | 256sps | qrs-109ms |
| 1bps | TO=0 | STEMI | DC | HRV | qtc-320ms |
| TS=0 | STm=0.1592 | 0 | 0.00% |
| P=0.033v | ~P=0v | Q=-0.22v | R=0.345v | S=0.012v | T=0v | ~T=-0.122v |
ECG Interpretation
ST Elevation – STEMI: ATypial Myocardial Infarction-ACUTE MI.
Abnormal Q: Old Myocardial Infarction-Abnormal ECG.
Inverted-T: Ischemia and Myocardial Infarction-Abnormal ECG.
11 STEMI Ext Q Normalize ST Inverted T
- Rate = 60bpm (60-100 bpm)
- P-Wave Present (Atrial Depolarization)
- PR-Interval = 133ms. (Normal 0.12s-0.20s + Allowance)
- QRS Interval = 109ms. (Normal 0.06s-0.12s + Allowance)
- QTc Interval = 320ms. (QTc is abnormally short if < 350ms. QTc is prolonged if > 440ms in men or > 460ms in women + Allowance)
- Heart Rate Variability = 0.00% smaller than 5.00%
- Deceleration Capacity: 0
- PQRST-Status: +P Wave, Q-Abnormal Wave, Inv-T Wave
- ST-Analysis: STEMI
- ST Elevation: ST-Segment Area Under the Curve is positive.
- ST-Slope: STm=0.1592
- Heart Rate Turbulence: TO=0, TS=0
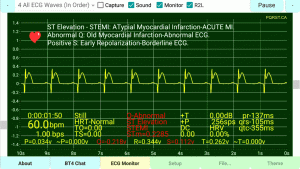
STEMI-Extended-Q-Positive-T-Wave
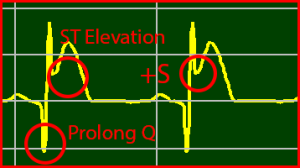
12 STEMI Ext Q Positive T
STEMI擴展Q正T
| 0:00:00:00 | Still | Q-Abnormal | +T | 0.00dB | pr-137ms |
| 60bpm | HRT-Normal | ST Elevation | +P | 256sps | qrs-105ms |
| 1bps | TO=0 | STEMI | DC | HRV | qtc-355ms |
| TS=0 | STm=0.2285 | 0 | 0.00% |
| P=0.034v | ~P=0v | Q=-0.218v | R=0.344v | S=0.112v | T=0.262v | ~T=0v |
ECG Interpretation
ST Elevation – STEMI: ATypial Myocardial Infarction-ACUTE MI.
Abnormal Q: Old Myocardial Infarction-Abnormal ECG.
Positive S: Early Repolarization-Borderline ECG.
12 STEMI Ext Q Positive T
- Rate = 60bpm (60-100 bpm)
- P-Wave Present (Atrial Depolarization)
- PR-Interval = 137ms. (Normal 0.12s-0.20s + Allowance)
- QRS Interval = 105ms. (Normal 0.06s-0.12s + Allowance)
- QTc Interval = 355ms. (QTc is abnormally short if < 350ms. QTc is prolonged if > 440ms in men or > 460ms in women + Allowance)
- Heart Rate Variability = 0.00% smaller than 5.00%
- Deceleration Capacity: 0
- PQRST-Status: +P Wave, Q-Abnormal Wave, +T Wave
- ST-Analysis: STEMI
- ST Elevation: ST-Segment Area Under the Curve is positive.
- ST-Slope: STm=0.2285
- Heart Rate Turbulence: TO=0, TS=0
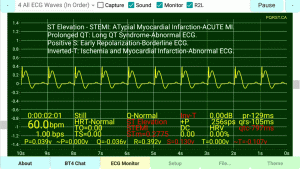
STEMI-Inverted-T-Wave
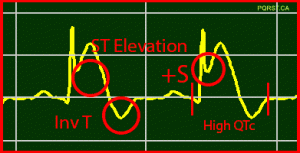
13 STEMI Inverted T
STEMI倒T
| 0:00:00:00 | Still | Q-Normal | Inv-T | 0.00dB | pr-129ms |
| 60bpm | HRT-Normal | ST Elevation | +P | 256sps | qrs-105ms |
| 1bps | TO=0 | STEMI | DC | HRV | qtc-797ms |
| TS=0 | STm=0.2775 | 0 | 0.00% |
| P=0.039v | ~P=0v | Q=-0.036v | R=0.392v | S=0.13v | T=0v | ~T=-0.107v |
ECG Interpretation
ST Elevation – STEMI: ATypial Myocardial Infarction-ACUTE MI.
Prolonged QT: Long QT Syndrome-Abnormal ECG.
Positive S: Early Repolarization-Borderline ECG.
Inverted-T: Ischemia and Myocardial Infarction-Abnormal ECG.
13 STEMI Inverted T
- Rate = 60bpm (60-100 bpm)
- P-Wave Present (Atrial Depolarization)
- PR-Interval = 129ms. (Normal 0.12s-0.20s + Allowance)
- QRS Interval = 105ms. (Normal 0.06s-0.12s + Allowance)
- QTc Interval = 797ms. (QTc is abnormally short if < 350ms. QTc is prolonged if > 440ms in men or > 460ms in women + Allowance)
- Heart Rate Variability = 0.00% smaller than 5.00%
- Deceleration Capacity: 0
- PQRST-Status: +P Wave, Q-Normal Wave, Inv-T Wave
- ST-Analysis: STEMI
- ST Elevation: ST-Segment Area Under the Curve is positive.
- ST-Slope: STm=0.2775
- Heart Rate Turbulence: TO=0, TS=0
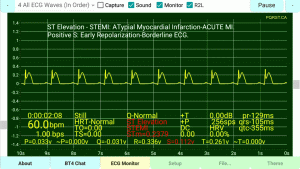
STEMI-Positive-T-Wave
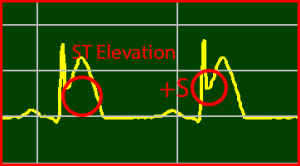
14 STEMI Positive T
STEMI正T
| 0:00:00:00 | Still | Q-Normal | +T | 0.00dB | pr-129ms |
| 60bpm | HRT-Normal | ST Elevation | +P | 256sps | qrs-105ms |
| 1bps | TO=0 | STEMI | DC | HRV | qtc-355ms |
| TS=0 | STm=0.2379 | 0 | 0.00% |
| P=0.033v | ~P=0v | Q=-0.031v | R=0.336v | S=0.112v | T=0.261v | ~T=0v |
ECG Interpretation
ST Elevation – STEMI: ATypial Myocardial Infarction-ACUTE MI.
Positive S: Early Repolarization-Borderline ECG.
14 STEMI Positive T
- Rate = 60bpm (60-100 bpm)
- P-Wave Present (Atrial Depolarization)
- PR-Interval = 129ms. (Normal 0.12s-0.20s + Allowance)
- QRS Interval = 105ms. (Normal 0.06s-0.12s + Allowance)
- QTc Interval = 355ms. (QTc is abnormally short if < 350ms. QTc is prolonged if > 440ms in men or > 460ms in women + Allowance)
- Heart Rate Variability = 0.00% smaller than 5.00%
- Deceleration Capacity: 0
- PQRST-Status: +P Wave, Q-Normal Wave, +T Wave
- ST-Analysis: STEMI
- ST Elevation: ST-Segment Area Under the Curve is positive.
- ST-Slope: STm=0.2379
- Heart Rate Turbulence: TO=0, TS=0
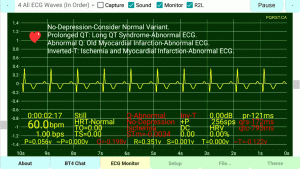
ST-Recovery-Inverted-T-Wave
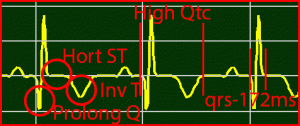
15 ST Recovery Inverted T
ST恢復和倒T
| 0:00:00:00 | Still | Q-Abnormal | Inv-T | 0.00dB | pr-121ms |
| 60bpm | HRT-Normal | No-Depression | +P | 256sps | qrs-172ms |
| 1bps | TO=0 | Ischemia | DC | HRV | qtc-793ms |
| TS=0 | STm=-0.0034 | 0 | 0.00% |
| P=0.056v | ~P=0v | Q=-0.198v | R=0.351v | S=0.001v | T=0v | ~T=-0.122v |
ECG Interpretation
No-Depression-Consider Normal Variant.
Prolonged QT: Long QT Syndrome-Abnormal ECG.
Abnormal Q: Old Myocardial Infarction-Abnormal ECG.
Inverted-T: Ischemia and Myocardial Infarction-Abnormal ECG.
15 ST Recovery Inverted T
- Rate = 60bpm (60-100 bpm)
- P-Wave Present (Atrial Depolarization)
- PR-Interval = 121ms. (Normal 0.12s-0.20s + Allowance)
- QRS Interval = 172ms. (Normal 0.06s-0.12s + Allowance)
- QTc Interval = 793ms. (QTc is abnormally short if < 350ms. QTc is prolonged if > 440ms in men or > 460ms in women + Allowance)
- Heart Rate Variability = 0.00% smaller than 5.00%
- Deceleration Capacity: 0
- PQRST-Status: +P Wave, Q-Abnormal Wave, Inv-T Wave
- ST-Analysis: Ischemia
- No-Depression: ST-Segment Area Under the Curve is approximately zero.
- ST-Slope: STm=-0.0034
- Heart Rate Turbulence: TO=0, TS=0
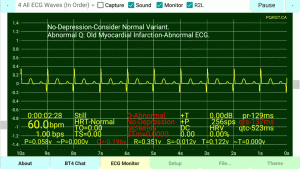
ST-Recovery-Normal-T-Persistent-Q-Wave
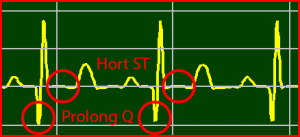
16 ST Recovery Normal T Persistent Q
ST恢復正常T和持久Q
| 0:00:00:00 | Still | Q-Abnormal | +T | 0.00dB | pr-129ms |
| 60bpm | HRT-Normal | No-Depression | +P | 256sps | qrs-137ms |
| 1bps | TO=0 | Ischemia | DC | HRV | qtc-523ms |
| TS=0 | STm=0.0000 | 0 | 0.00% |
| P=0.058v | ~P=0v | Q=-0.196v | R=0.351v | S=-0.012v | T=0.122v | ~T=0v |
ECG Interpretation
No-Depression-Consider Normal Variant.
Abnormal Q: Old Myocardial Infarction-Abnormal ECG.
16 ST Recovery Normal T Persistent Q
- Rate = 60bpm (60-100 bpm)
- P-Wave Present (Atrial Depolarization)
- PR-Interval = 129ms. (Normal 0.12s-0.20s + Allowance)
- QRS Interval = 137ms. (Normal 0.06s-0.12s + Allowance)
- QTc Interval = 523ms. (QTc is abnormally short if < 350ms. QTc is prolonged if > 440ms in men or > 460ms in women + Allowance)
- Heart Rate Variability = 0.00% smaller than 5.00%
- Deceleration Capacity: 0
- PQRST-Status: +P Wave, Q-Abnormal Wave, +T Wave
- ST-Analysis: Ischemia
- No-Depression: ST-Segment Area Under the Curve is approximately zero.
- ST-Slope: STm=0.0000
- Heart Rate Turbulence: TO=0, TS=0
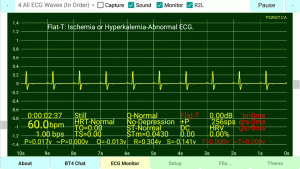
Flat-T-Wave
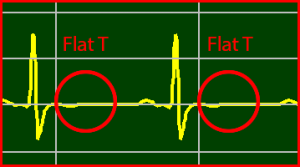
17 Flat T
平T
| 0:00:00:00 | Still | Q-Normal | Flat-T | 0.00dB | pr-0ms |
| 60bpm | HRT-Normal | No-Depression | +P | 256sps | qrs-0ms |
| 1bps | TO=0 | ST-Normal | DC | HRV | qtc-0ms |
| TS=0 | STm=0.0430 | 0 | 0.00% |
| P=0.017v | ~P=0v | Q=-0.013v | R=0.304v | S=-0.141v | T=0v | ~T=0v |
ECG Interpretation
Flat-T: Ischemia or Hyperkalemia-Abnormal ECG.
17 Flat T
- Rate = 60bpm (60-100 bpm)
- P-Wave Absent (No Atrial Depolarization)
- PR-Interval = 0ms. (Normal 0.12s-0.20s + Allowance)
- QRS Interval = 0ms. (Normal 0.06s-0.12s + Allowance)
- QTc Interval = 0ms. (QTc is abnormally short if < 350ms. QTc is prolonged if > 440ms in men or > 460ms in women + Allowance)
- Heart Rate Variability = 0.00% smaller than 5.00%
- Deceleration Capacity: 0
- PQRST-Status: +P Wave, Q-Normal Wave, Flat-T Wave
- ST-Analysis: ST-Normal
- No-Depression: ST-Segment Area Under the Curve is approximately zero.
- ST-Slope: STm=0.0430
- Heart Rate Turbulence: TO=0, TS=0
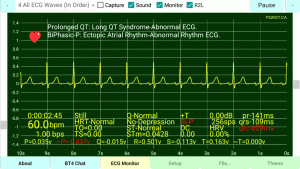
BiPhasic-P-Wave
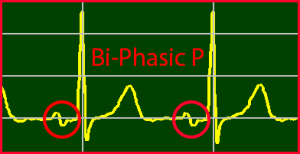
18 BiPhasic P
雙相P
| 0:00:00:00 | Still | Q-Normal | +T | 0.00dB | pr-141ms |
| 60bpm | HRT-Normal | No-Depression | Bi-P | 256sps | qrs-109ms |
| 1bps | TO=0 | ST-Normal | DC | HRV | qtc-629ms |
| TS=0 | STm=0.0428 | 0 | 0.00% |
| P=0.035v | ~P=-0.037v | Q=-0.015v | R=0.501v | S=-0.113v | T=0.163v | ~T=0v |
ECG Interpretation
Prolonged QT: Long QT Syndrome-Abnormal ECG.
BiPhasic-P: Ectopic Atrial Rhythm-Abnormal Rhythm ECG.
18 BiPhasic P
- Rate = 60bpm (60-100 bpm)
- P-Wave Present (Atrial Depolarization)
- PR-Interval = 141ms. (Normal 0.12s-0.20s + Allowance)
- QRS Interval = 109ms. (Normal 0.06s-0.12s + Allowance)
- QTc Interval = 629ms. (QTc is abnormally short if < 350ms. QTc is prolonged if > 440ms in men or > 460ms in women + Allowance)
- Heart Rate Variability = 0.00% smaller than 5.00%
- Deceleration Capacity: 0
- PQRST-Status: Bi-P Wave, Q-Normal Wave, +T Wave
- ST-Analysis: ST-Normal
- No-Depression: ST-Segment Area Under the Curve is approximately zero.
- ST-Slope: STm=0.0428
- Heart Rate Turbulence: TO=0, TS=0
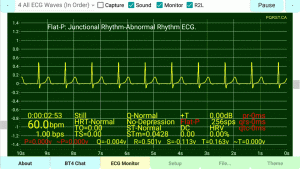
Flat-P-Wave
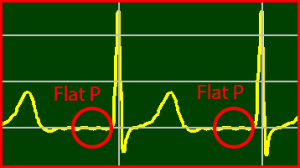
19 Flat P
平P
| 0:00:00:00 | Still | Q-Normal | +T | 0.00dB | pr-0ms |
| 60bpm | HRT-Normal | No-Depression | Flat-P | 256sps | qrs-0ms |
| 1bps | TO=0 | ST-Normal | DC | HRV | qtc-0ms |
| TS=0 | STm=0.0428 | 0 | 0.00% |
| P=0v | ~P=0v | Q=-0.004v | R=0.501v | S=-0.113v | T=0.163v | ~T=0v |
ECG Interpretation
Flat-P: Junctional Rhythm-Abnormal Rhythm ECG.
19 Flat P
- Rate = 60bpm (60-100 bpm)
- P-Wave Absent (No Atrial Depolarization)
- PR-Interval = 0ms. (Normal 0.12s-0.20s + Allowance)
- QRS Interval = 0ms. (Normal 0.06s-0.12s + Allowance)
- QTc Interval = 0ms. (QTc is abnormally short if < 350ms. QTc is prolonged if > 440ms in men or > 460ms in women + Allowance)
- Heart Rate Variability = 0.00% smaller than 5.00%
- Deceleration Capacity: 0
- PQRST-Status: Flat-P Wave, Q-Normal Wave, +T Wave
- ST-Analysis: ST-Normal
- No-Depression: ST-Segment Area Under the Curve is approximately zero.
- ST-Slope: STm=0.0428
- Heart Rate Turbulence: TO=0, TS=0
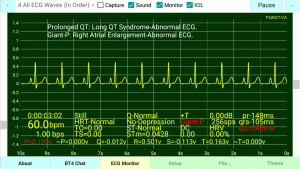
Giant-P-Wave
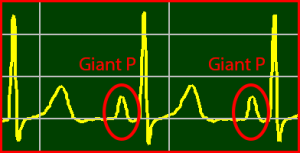
20 Giant P
巨人P
| 0:00:00:00 | Still | Q-Normal | +T | 0.00dB | pr-148ms |
| 60bpm | HRT-Normal | No-Depression | Giant-P | 256sps | qrs-105ms |
| 1bps | TO=0 | ST-Normal | DC | HRV | qtc-543ms |
| TS=0 | STm=0.0428 | 0 | 0.00% |
| P=0.155v | ~P=0v | Q=-0.012v | R=0.501v | S=-0.113v | T=0.163v | ~T=0v |
ECG Interpretation
Prolonged QT: Long QT Syndrome-Abnormal ECG.
Giant-P: Right Atrial Enlargement-Abnormal ECG.
20 Giant P
- Rate = 60bpm (60-100 bpm)
- P-Wave Present (Atrial Depolarization)
- PR-Interval = 148ms. (Normal 0.12s-0.20s + Allowance)
- QRS Interval = 105ms. (Normal 0.06s-0.12s + Allowance)
- QTc Interval = 543ms. (QTc is abnormally short if < 350ms. QTc is prolonged if > 440ms in men or > 460ms in women + Allowance)
- Heart Rate Variability = 0.00% smaller than 5.00%
- Deceleration Capacity: 0
- PQRST-Status: Giant-P Wave, Q-Normal Wave, +T Wave
- ST-Analysis: ST-Normal
- No-Depression: ST-Segment Area Under the Curve is approximately zero.
- ST-Slope: STm=0.0428
- Heart Rate Turbulence: TO=0, TS=0
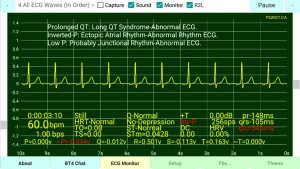
Inverted-P-Wave
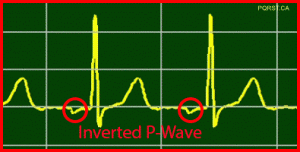
21 Inverted P
倒P
| 0:00:00:00 | Still | Q-Normal | +T | 0.00dB | pr-148ms |
| 60bpm | HRT-Normal | No-Depression | Inv-P | 256sps | qrs-105ms |
| 1bps | TO=0 | ST-Normal | DC | HRV | qtc-543ms |
| TS=0 | STm=0.0428 | 0 | 0.00% |
| P=0v | ~P=-0.034v | Q=-0.012v | R=0.501v | S=-0.113v | T=0.163v | ~T=0v |
ECG Interpretation
Prolonged QT: Long QT Syndrome-Abnormal ECG.
Inverted-P: Ectopic Atrial Rhythm-Abnormal Rhythm ECG.
Low P: Probably Junctional Rhythm-Abnormal ECG.
21 Inverted P
- Rate = 60bpm (60-100 bpm)
- P-Wave Present (Atrial Depolarization)
- PR-Interval = 148ms. (Normal 0.12s-0.20s + Allowance)
- QRS Interval = 105ms. (Normal 0.06s-0.12s + Allowance)
- QTc Interval = 543ms. (QTc is abnormally short if < 350ms. QTc is prolonged if > 440ms in men or > 460ms in women + Allowance)
- Heart Rate Variability = 0.00% smaller than 5.00%
- Deceleration Capacity: 0
- PQRST-Status: Inv-P Wave, Q-Normal Wave, +T Wave
- ST-Analysis: ST-Normal
- No-Depression: ST-Segment Area Under the Curve is approximately zero.
- ST-Slope: STm=0.0428
- Heart Rate Turbulence: TO=0, TS=0
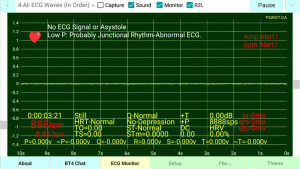
Asystole-or-NO ECG/EKG Signal
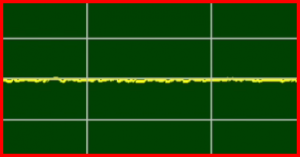
22 Asystole
心搏停止
| 0:00:00:00 | Still | Q-Normal | +T | 0.00dB | pr-0ms |
| 888bpm | HRT-Normal | No-Depression | +P | 256sps | qrs-0ms |
| 8.88bps | TO=0 | ST-Normal | DC | HRV | qtc-0ms |
| TS=0 | STm=0.0000 | 0 | 0.00% |
| P=0v | ~P=0v | Q=0v | R=0v | S=0v | T=0v | ~T=0v |
ECG Interpretation
No ECG Signal or Asystole
Low P: Probably Junctional Rhythm-Abnormal ECG.
22 Asystole
- Rate = 888bpm (60-100 bpm)
- P-Wave Absent (No Atrial Depolarization)
- PR-Interval = 0ms. (Normal 0.12s-0.20s + Allowance)
- QRS Interval = 0ms. (Normal 0.06s-0.12s + Allowance)
- QTc Interval = 0ms. (QTc is abnormally short if < 350ms. QTc is prolonged if > 440ms in men or > 460ms in women + Allowance)
- Heart Rate Variability = 0.00% smaller than 5.00%
- Deceleration Capacity: 0
- PQRST-Status: +P Wave, Q-Normal Wave, +T Wave
- ST-Analysis: ST-Normal
- No-Depression: ST-Segment Area Under the Curve is approximately zero.
- ST-Slope: STm=0.0000
- Heart Rate Turbulence: TO=0, TS=0
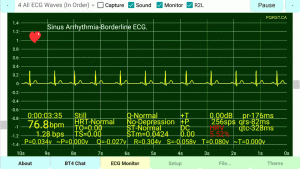
Sinus-Arrhythmia
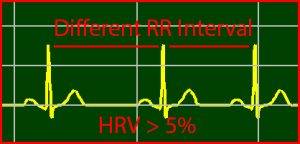
23 Sinus Arrhythmia
竇性心律不齊
| 0:00:00:00 | Still | Q-Normal | +T | 0.00dB | pr-160ms |
| 80bpm | HRT-Normal | No-Depression | +P | 256sps | qrs-82ms |
| 1.3bps | TO=0 | ST-Normal | DC | HRV | qtc-328ms |
| TS=0 | STm=0.0298 | 0 | 5.04% |
| P=0.034v | ~P=0v | Q=-0.027v | R=0.304v | S=-0.058v | T=0.08v | ~T=0v |
ECG Interpretation
Sinus Arrhythmia-Borderline ECG.
23 Sinus Arrhythmia
- Rate = 80bpm (60-100 bpm)
- P-Wave Present (Atrial Depolarization)
- PR-Interval = 160ms. (Normal 0.12s-0.20s + Allowance)
- QRS Interval = 82ms. (Normal 0.06s-0.12s + Allowance)
- QTc Interval = 328ms. (QTc is abnormally short if < 350ms. QTc is prolonged if > 440ms in men or > 460ms in women + Allowance)
- Heart Rate Variability = 5.04% greater than 5.00%
- Deceleration Capacity: 0
- PQRST-Status: +P Wave, Q-Normal Wave, +T Wave
- ST-Analysis: ST-Normal
- No-Depression: ST-Segment Area Under the Curve is approximately zero.
- ST-Slope: STm=0.0298
- Heart Rate Turbulence: TO=0, TS=0
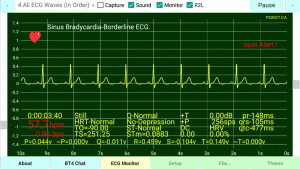
Sinus-Bradycardia
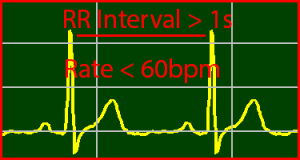
24 Sinus Bradycardia
竇性心律過緩
| 0:00:00:00 | Still | Q-Normal | +T | 0.00dB | pr-148ms |
| 57.7bpm | HRT-Normal | No-Depression | +P | 256sps | qrs-105ms |
| 1bps | TO=-90 | ST-Normal | DC | HRV | qtc-477ms |
| TS=251.25 | STm=0.0883 | 0 | 0.00% |
| P=0.044v | ~P=0v | Q=-0.011v | R=0.459v | S=-0.104v | T=0.149v | ~T=0v |
ECG Interpretation
Sinus Bradycardia-Borderline ECG.
24 Sinus Bradycardia
- Rate = 57.7bpm (60-100 bpm)
- P-Wave Present (Atrial Depolarization)
- PR-Interval = 148ms. (Normal 0.12s-0.20s + Allowance)
- QRS Interval = 105ms. (Normal 0.06s-0.12s + Allowance)
- QTc Interval = 477ms. (QTc is abnormally short if < 350ms. QTc is prolonged if > 440ms in men or > 460ms in women + Allowance)
- Heart Rate Variability = 0.00% smaller than 5.00%
- Deceleration Capacity: 0
- PQRST-Status: +P Wave, Q-Normal Wave, +T Wave
- ST-Analysis: ST-Normal
- No-Depression: ST-Segment Area Under the Curve is approximately zero.
- ST-Slope: STm=0.0883
- Heart Rate Turbulence: TO=-90, TS=251.25
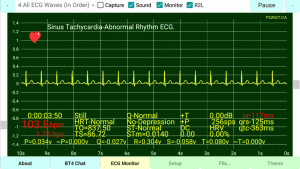
Sinus-Tachycardia
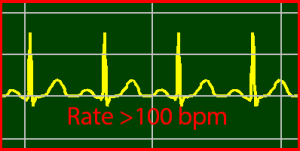
25 Sinus Tachycardia
竇性心律過速
| 0:00:00:00 | Still | Q-Normal | +T | 0.00dB | pr-117ms |
| 103.8bpm | HRT-Normal | No-Depression | +P | 256sps | qrs-125ms |
| 1.7bps | TO=837.5 | ST-Normal | DC | HRV | qtc-363ms |
| TS=86.72 | STm=0.0140 | 0 | 0.00% |
| P=0.034v | ~P=0v | Q=-0.027v | R=0.304v | S=-0.058v | T=0.08v | ~T=0v |
ECG Interpretation
Sinus Tachycardia-Abnormal Rhythm ECG.
25 Sinus Tachycardia
- Rate = 103.8bpm (60-100 bpm)
- P-Wave Present (Atrial Depolarization)
- PR-Interval = 117ms. (Normal 0.12s-0.20s + Allowance)
- QRS Interval = 125ms. (Normal 0.06s-0.12s + Allowance)
- QTc Interval = 363ms. (QTc is abnormally short if < 350ms. QTc is prolonged if > 440ms in men or > 460ms in women + Allowance)
- Heart Rate Variability = 0.00% smaller than 5.00%
- Deceleration Capacity: 0
- PQRST-Status: +P Wave, Q-Normal Wave, +T Wave
- ST-Analysis: ST-Normal
- No-Depression: ST-Segment Area Under the Curve is approximately zero.
- ST-Slope: STm=0.0140
- Heart Rate Turbulence: TO=837.5, TS=86.72
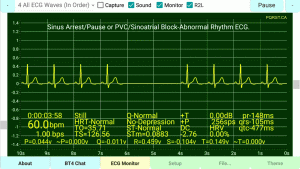
Sinus-Arrest-or-Sinus-Pause

26 Sinus Arrest
竇停滯或暫停
| 0:00:00:00 | Still | Q-Normal | +T | 0.00dB | pr-148ms |
| 60bpm | HRT-Normal | No-Depression | +P | 256sps | qrs-105ms |
| 1bps | TO=35.71 | ST-Normal | DC | HRV | qtc-477ms |
| TS=126.56 | STm=0.0883 | 0.5 | 0.00% |
| P=0.044v | ~P=0v | Q=-0.011v | R=0.459v | S=-0.104v | T=0.149v | ~T=0v |
ECG Interpretation
Sinus Arrest/Pause or Sinoatrial Block-Abnormal Rhythm ECG.
26 Sinus Arrest
- Rate = 60bpm (60-100 bpm)
- P-Wave Present (Atrial Depolarization)
- PR-Interval = 148ms. (Normal 0.12s-0.20s + Allowance)
- QRS Interval = 105ms. (Normal 0.06s-0.12s + Allowance)
- QTc Interval = 477ms. (QTc is abnormally short if < 350ms. QTc is prolonged if > 440ms in men or > 460ms in women + Allowance)
- Heart Rate Variability = 0.00% smaller than 5.00%
- Deceleration Capacity: 0.5
- PQRST-Status: +P Wave, Q-Normal Wave, +T Wave
- ST-Analysis: ST-Normal
- No-Depression: ST-Segment Area Under the Curve is approximately zero.
- ST-Slope: STm=0.0883
- Heart Rate Turbulence: TO=35.71, TS=126.56
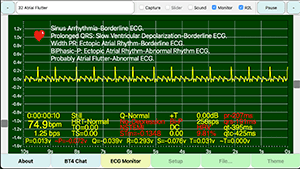
Atrial-Flutter
27 Atrial Flutter
心房震顫
| 0:00:00:00 | Still | Q-Normal | +T | 0.00dB | pr-102ms |
| 74.9bpm | HRT-Normal | No-Depression | +P | 256sps | qrs-141ms |
| 1.25bps | TO=83.41 | NSTEMI | DC | HRV | qtc-324ms |
| TS=26.56 | Stm=-0.5712 | 0 | 8.88% |
| P=0.085v | ~P=0v | Q=-0.015v | R=0.323v | S=-0.046v | T=0.061v | ~T=0v |
ECG Interpretation
Sinus Arrhythmia-Borderline ECG
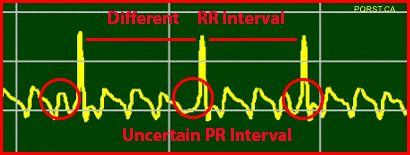
Atrial Flutter
27 Atrial Flutter
- Rate = 74.9bpm (60-100 bpm)
- P-Wave Uncertain (Atrial Depolarization)
- PR-Interval = 102ms. (Normal 0.12s-0.20s + Allowance)
- QRS Interval = 141ms. (Normal 0.06s-0.12s + Allowance)
- QTc Interval = 324ms. (QTc is abnormally short if < 350ms. QTc is prolonged if > 440ms in men or > 460ms in women + Allowance)
- Heart Rate Variability = 8.88% greater than 5.00%
- Deceleration Capacity: 0
- PQRST-Status: +P Wave, Q-Normal Wave, +T Wave
- ST-Analysis: NSTEMI
- No-Depression: ST-Segment Area Under the Curve is approximately zero.
- ST-Slope: Stm=-0.5712
- Heart Rate Turbulence: TO=83.41, TS=26.56
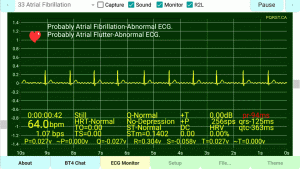
Atrial-Fibrillation
28 Atrial Fibrillation
心房震顫
| 0:00:00:00 | Still | Q-Normal | +T | 0.00dB | pr-94ms |
| 64bpm | HRT-Normal | No-Depression | +P | 256sps | qrs-125ms |
| 1.07bps | TO=0 | ST-Normal | DC | HRV | qtc-363ms |
| TS=0 | Stm=0.1402 | 0 | 0.00% |
| P=0.027v | ~P=0v | Q=-0.027v | R=0.304v | S=-0.058v | T=0.027v | ~T=0v |
ECG Interpretation
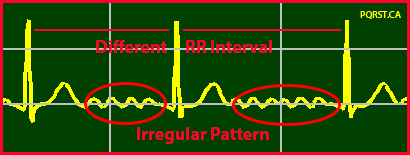
Probably Atrial Fibrillation
28 Atrial Fibrillation
- Rate = 64bpm (60-100 bpm)
- P-Wave Uncertain (Atrial Depolarization)
- PR-Interval = 94ms. (Normal 0.12s-0.20s + Allowance)
- QRS Interval = 125ms. (Normal 0.06s-0.12s + Allowance)
- QTc Interval = 363ms. (QTc is abnormally short if < 350ms. QTc is prolonged if > 440ms in men or > 460ms in women + Allowance)
- Heart Rate Variability = 0.00% smaller than 5.00%
- Deceleration Capacity: 0
- PQRST-Status: +P Wave, Q-Normal Wave, +T Wave
- ST-Analysis: ST-Normal
- No-Depression: ST-Segment Area Under the Curve is approximately zero.
- ST-Slope: Stm=0.1402
- Heart Rate Turbulence: TO=0, TS=0
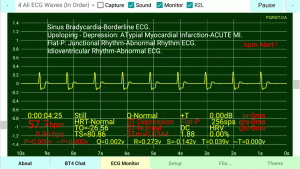
Idioventricular-Rhythm
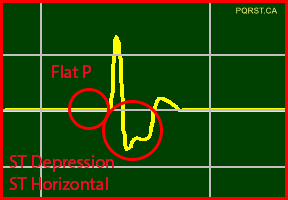
29 Idioventricular Rhythm
室性心律
| 0:00:00:00 | Still | Q-Normal | +T | 0.00dB | pr-0ms |
| 57.7bpm | HRT-Normal | ST Depression | Flat-P | 256sps | qrs-0ms |
| 0.96bps | TO=-26.56 | ST-Normal | DC | HRV | qtc-0ms |
| TS=80.86 | STm=0.0344 | 1.88 | 0.00% |
| P=0v | ~P=0v | Q=0.002v | R=0.273v | S=-0.142v | T=0.039v | ~T=0v |
ECG Interpretation
Sinus Bradycardia-Borderline ECG.
Upsloping – Depression: ATypial Myocardial Infarction-ACUTE MI.
Flat-P: Junctional Rhythm-Abnormal Rhythm ECG.
Idioventricular Rhythm-Abnormal ECG.
29 Idioventricular Rhythm
- Rate = 57.7bpm (60-100 bpm)
- P-Wave Absent (No Atrial Depolarization)
- PR-Interval = 0ms. (Normal 0.12s-0.20s + Allowance)
- QRS Interval = 0ms. (Normal 0.06s-0.12s + Allowance)
- QTc Interval = 0ms. (QTc is abnormally short if < 350ms. QTc is prolonged if > 440ms in men or > 460ms in women + Allowance)
- Heart Rate Variability = 0.00% smaller than 5.00%
- Deceleration Capacity: 1.88
- PQRST-Status: Flat-P Wave, Q-Normal Wave, +T Wave
- ST-Analysis: ST-Normal
- ST Depression: ST-Segment Area Under the Curve is negative.
- ST-Slope: STm=0.0344
- Heart Rate Turbulence: TO=-26.56, TS=80.86
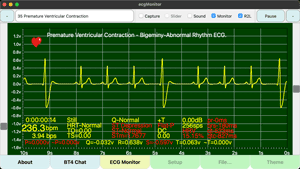
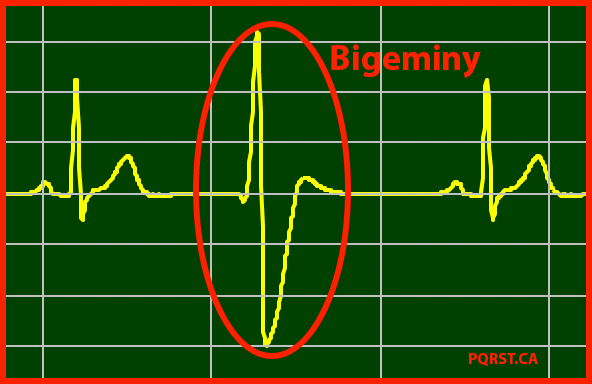
Premature Ventricular Contraction – Bigeminy
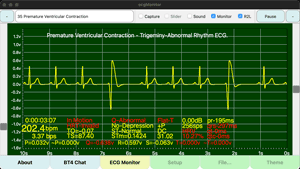
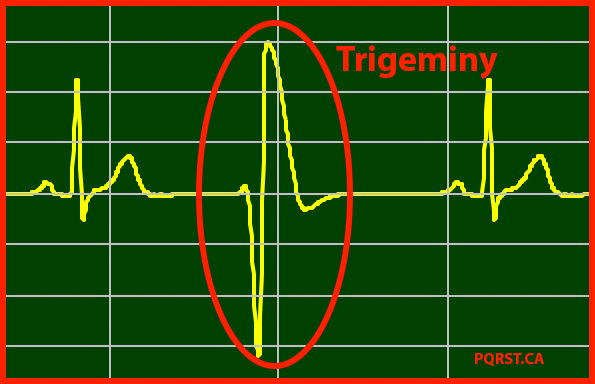
Premature Ventricular Contraction – Trigeminy
30 Premature Ventricular Contraction
心室性早搏
| 0:00:00:00 | Still | Q-Normal | +T | 0.00dB | pr-148ms |
| 135bpm | HRT-Normal | No-Depression | +P | 256sps | qrs-105ms |
| 2.25bps | TO=-3.28 | ST-Normal | DC | HRV | qtc-477ms |
| TS=46.09 | STm=0.0883 | 3.46 | 0.00% |
| P=0.044v | ~P=0v | Q=-0.011v | R=0.459v | S=-0.104v | T=0.149v | ~T=0v |
ECG Interpretation
Sinus Tachycardia-Abnormal Rhythm ECG.
Premature Ventricular Contraction – Bigeminy -Abnormal Rhythm ECG.
Premature Ventricular Contraction – Trigeminy -Abnormal Rhythm ECG.
30 Premature Ventricular Contraction
- Rate = 135bpm (60-100 bpm)
- P-Wave Present (Atrial Depolarization)
- PR-Interval = 148ms. (Normal 0.12s-0.20s + Allowance)
- QRS Interval = 105ms. (Normal 0.06s-0.12s + Allowance)
- QTc Interval = 477ms. (QTc is abnormally short if < 350ms. QTc is prolonged if > 440ms in men or > 460ms in women + Allowance)
- Heart Rate Variability = 0.00% smaller than 5.00%
- Deceleration Capacity: 3.46
- PQRST-Status: +P Wave, Q-Normal Wave, +T Wave
- ST-Analysis: ST-Normal
- No-Depression: ST-Segment Area Under the Curve is approximately zero.
- ST-Slope: STm=0.0883
- Heart Rate Turbulence: TO=-3.28, TS=46.09
Supraventricular-Tachycardia
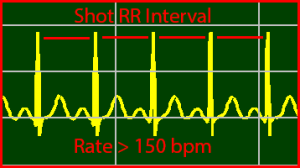
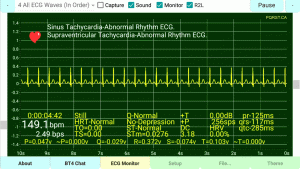
31 Supraventricular Tachycardia
心室上性心律過速
| 0:00:00:00 | Still | Q-Normal | +T | 0.00dB | pr-125ms |
| 149.1bpm | HRT-Normal | No-Depression | +P | 256sps | qrs-117ms |
| 2.5bps | TO=0 | ST-Normal | DC | HRV | qtc-285ms |
| TS=0 | STm=0.0276 | 3.18 | 0.00% |
| P=0.047v | ~P=0v | Q=-0.029v | R=0.372v | S=-0.074v | T=0.103v | ~T=0v |
ECG Interpretation
Sinus Tachycardia-Abnormal Rhythm ECG.
Supraventricular Tachycardia-Abnormal Rhythm ECG.
31 Supraventricular Tachycardia
- Rate = 149.1bpm (60-100 bpm)
- P-Wave Present (Atrial Depolarization)
- PR-Interval = 125ms. (Normal 0.12s-0.20s + Allowance)
- QRS Interval = 117ms. (Normal 0.06s-0.12s + Allowance)
- QTc Interval = 285ms. (QTc is abnormally short if < 350ms. QTc is prolonged if > 440ms in men or > 460ms in women + Allowance)
- Heart Rate Variability = 0.00% smaller than 5.00%
- Deceleration Capacity: 3.18
- PQRST-Status: +P Wave, Q-Normal Wave, +T Wave
- ST-Analysis: ST-Normal
- No-Depression: ST-Segment Area Under the Curve is approximately zero.
- ST-Slope: STm=0.0276
- Heart Rate Turbulence: TO=0, TS=0
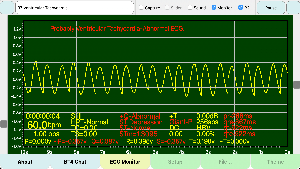
Ventricular-Tachycardia
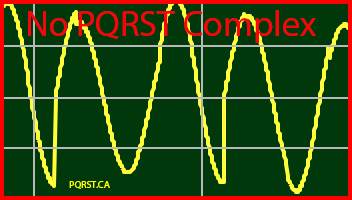
32 Ventricular Tachycardia
室性心搏過速
| 0:00:00:00 | Still | +Q-Abnormal | +T | 0.00dB | pr-199ms |
| 161.3bpm | HRT-Normal | No-Depression | Bi-P | 256sps | qrs-207ms |
| 2.7bps | TO=0 | NSTEMI | DC | HRV | qtc-461ms |
| TS=0 | STm=-0.3682 | 4.08 | 0.00% |
| P=0.089v | ~P=-0.174v | Q=0.088v | R=0.169v | S=0.088v | T=0.092v | ~T=0v |
ECG Interpretation
Probably Ventricular Tachycardia
32 Ventricular Tachycardia
- Rate = 161.3bpm (60-100 bpm)
- P-Wave Absent (No Atrial Depolarization)
- PR-Interval = 199ms. (Normal 0.12s-0.20s + Allowance)
- QRS Interval = 207ms. (Normal 0.06s-0.12s + Allowance)
- QTc Interval = 461ms. (QTc is abnormally short if < 350ms. QTc is prolonged if > 440ms in men or > 460ms in women + Allowance)
- Heart Rate Variability = 0.00% smaller than 5.00%
- Deceleration Capacity: 4.08
- PQRST-Status: Bi-P Wave, +Q-Abnormal Wave, +T Wave
- ST-Analysis: NSTEMI
- No-Depression: ST-Segment Area Under the Curve is approximately zero.
- ST-Slope: STm=-0.3682
- Heart Rate Turbulence: TO=0, TS=0
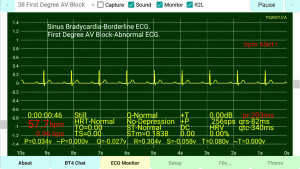
First-Degree-AV-Block
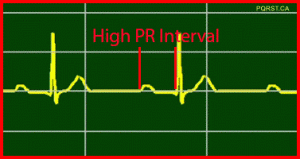
33 First Degree AV Block
一級AV塊
| 0:00:00:00 | Still | Q-Normal | +T | 0.00dB | pr-203ms |
| 57.7bpm | HRT-Normal | No-Depression | +P | 256sps | qrs-82ms |
| 0.96bps | TO=0 | ST-Normal | DC | HRV | qtc-340ms |
| TS=0 | STm=0.1838 | 0 | 0.00% |
| P=0.034v | ~P=0v | Q=-0.027v | R=0.304v | S=-0.058v | T=0.08v | ~T=0v |
ECG Interpretation
ECG Interpretation
Sinus Bradycardia-Borderline ECG.
First Degree AV Block-Abnormal ECG.
33 First Degree AV Block
- Rate = 57.7bpm (60-100 bpm)
- P-Wave Present (Atrial Depolarization)
- PR-Interval = 203ms. (Normal 0.12s-0.20s + Allowance)
- QRS Interval = 82ms. (Normal 0.06s-0.12s + Allowance)
- QTc Interval = 340ms. (QTc is abnormally short if < 350ms. QTc is prolonged if > 440ms in men or > 460ms in women + Allowance)
- Heart Rate Variability = 0.00% smaller than 5.00%
- Deceleration Capacity: 0
- PQRST-Status: +P Wave, Q-Normal Wave, +T Wave
- ST-Analysis: ST-Normal
- No-Depression: ST-Segment Area Under the Curve is approximately zero.
- ST-Slope: STm=0.1838
- Heart Rate Turbulence: TO=0, TS=0
Second-Degree-AV-Block

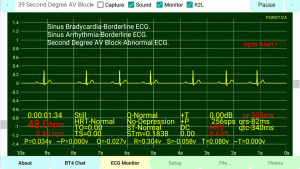
34 Second Degree AV Block
二級AV塊
| 0:00:00:00 | Still | Q-Normal | +T | 0.00dB | pr-203ms |
| 48bpm | HRT-Normal | No-Depression | +P | 256sps | qrs-82ms |
| 0.8bps | TO=0 | ST-Normal | DC | HRV | qtc-340ms |
| TS=0 | STm=0.1838 | 0 | 6.63% |
| P=0.034v | ~P=0v | Q=-0.027v | R=0.304v | S=-0.058v | T=0.08v | ~T=0v |
ECG Interpretation
Sinus Bradycardia-Borderline ECG.
Sinus Arrhythmia-Borderline ECG.
Second Degree AV Block-Abnormal ECG.
34 Second Degree AV Block
- Rate = 48bpm (60-100 bpm)
- P-Wave Present (Atrial Depolarization)
- PR-Interval = 203ms. (Normal 0.12s-0.20s + Allowance)
- QRS Interval = 82ms. (Normal 0.06s-0.12s + Allowance)
- QTc Interval = 340ms. (QTc is abnormally short if < 350ms. QTc is prolonged if > 440ms in men or > 460ms in women + Allowance)
- Heart Rate Variability = 6.63% greater than 5.00%
- Deceleration Capacity: 0
- PQRST-Status: +P Wave, Q-Normal Wave, +T Wave
- ST-Analysis: ST-Normal
- No-Depression: ST-Segment Area Under the Curve is approximately zero.
- ST-Slope: STm=0.1838
- Heart Rate Turbulence: TO=0, TS=0
Wolff-Parkinson-White
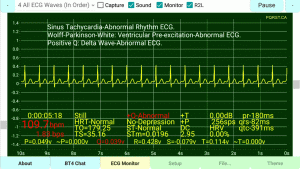
35 Wolff Parkinson White
沃爾夫·帕金森·懷特
| 0:00:00:00 | Still | +Q-Abnormal | +T | 0.00dB | pr-180ms |
| 109.7bpm | HRT-Normal | No-Depression | +P | 256sps | qrs-82ms |
| 1.88bps | TO=179.25 | ST-Normal | DC | HRV | qtc-391ms |
| TS=35.16 | STm=0.0196 | 2.95 | 0.00% |
| P=0.049v | ~P=0v | Q=0.039v | R=0.428v | S=-0.079v | T=0.114v | ~T=0v |
ECG Interpretation
Sinus Tachycardia-Abnormal Rhythm ECG.
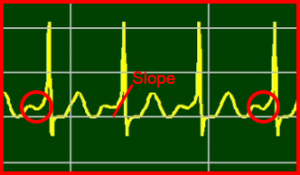
Wolff-Parkinson-White: Ventricular Pre-excitation-Abnormal ECG.
Positive Q: Delta Wave-Abnormal ECG.
35 Wolff Parkinson White
- Rate = 109.7bpm (60-100 bpm)
- P-Wave Present (Atrial Depolarization)
- PR-Interval = 180ms. (Normal 0.12s-0.20s + Allowance)
- QRS Interval = 82ms. (Normal 0.06s-0.12s + Allowance)
- QTc Interval = 391ms. (QTc is abnormally short if < 350ms. QTc is prolonged if > 440ms in men or > 460ms in women + Allowance)
- Heart Rate Variability = 0.00% smaller than 5.00%
- Deceleration Capacity: 2.95
- PQRST-Status: +P Wave, +Q-Abnormal Wave, +T Wave
- ST-Analysis: ST-Normal
- No-Depression: ST-Segment Area Under the Curve is approximately zero.
- ST-Slope: STm=0.0196
- Heart Rate Turbulence: TO=179.25, TS=35.16
Ventricular-Flutter
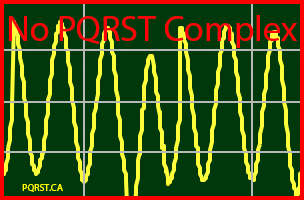
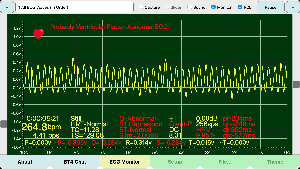
36 Ventricular Flutter
心室撲動
| 0:00:00:00 | Still | Q-Abnormal | +T | 0.00dB | pr-199ms |
| 77.2bpm | HRT-Normal | No-Depression | +P | 256sps | qrs-207ms |
| 1.29bps | TO=5.64 | ST-Normal | DC | HRV | qtc-770ms |
| TS=23.44 | Stm=1.7256 | 2.79 | 0.00% |
| P=0.15v | ~P=0v | Q=-0.214v | R=0.14v | S=-0.13v | T=0.049v | ~T=0v |
ECG Interpretation
Probably Ventricular Flutter
36 Ventricular Flutter
- Rate = 77.2bpm (60-100 bpm)
- P-Wave Present (Atrial Depolarization)
- PR-Interval = 199ms. (Normal 0.12s-0.20s + Allowance)
- QRS Interval = 207ms. (Normal 0.06s-0.12s + Allowance)
- QTc Interval = 770ms. (QTc is abnormally short if < 350ms. QTc is prolonged if > 440ms in men or > 460ms in women + Allowance)
- Heart Rate Variability = 0.00% smaller than 5.00%
- Deceleration Capacity: 2.79
- PQRST-Status: +P Wave, Q-Abnormal Wave, +T Wave
- ST-Analysis: ST-Normal
- No-Depression: ST-Segment Area Under the Curve is approximately zero.
- ST-Slope: Stm=1.7256
- Heart Rate Turbulence: TO=5.64, TS=23.44
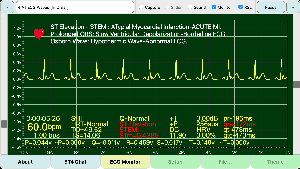
Osborn-Wave
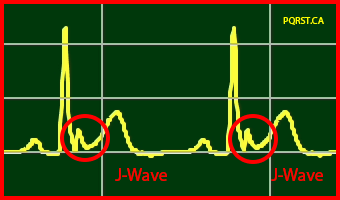
37 Osborn Wave
奧斯本波
| 0:00:00:00 | Still | Q-Normal | +T | 0.00dB | pr-148ms |
| 60bpm | HRT-Normal | No-Depression | +P | 256sps | qrs-105ms |
| 1bps | TO=-54.55 | NSTEMI | DC | HRV | qtc-477ms |
| TS=69.14 | STm=-0.0459 | 5.6 | 0.00% |
| P=0.044v | ~P=0v | Q=-0.011v | R=0.459v | S=-0.105v | T=0.149v | ~T=0v |
ECG Interpretation
Probably Osborn Wave
37 Osborn Wave
- Rate = 60bpm (60-100 bpm)
- P-Wave Present (Atrial Depolarization)
- PR-Interval = 148ms. (Normal 0.12s-0.20s + Allowance)
- QRS Interval = 105ms. (Normal 0.06s-0.12s + Allowance)
- QTc Interval = 477ms. (QTc is abnormally short if < 350ms. QTc is prolonged if > 440ms in men or > 460ms in women + Allowance)
- Heart Rate Variability = 0.00% smaller than 5.00%
- Deceleration Capacity: 5.6
- PQRST-Status: +P Wave, Q-Normal Wave, +T Wave
- ST-Analysis: NSTEMI
- No-Depression: ST-Segment Area Under the Curve is approximately zero.
- ST-Slope: STm=-0.0459
- Heart Rate Turbulence: TO=-54.55, TS=69.14
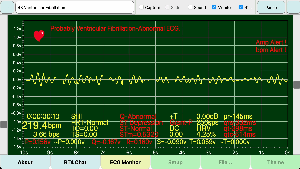
Ventricular-Fibrillation
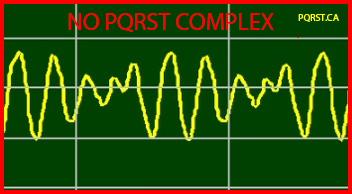
38 Ventricular Fibrillation
心室顫動
| 0:00:00:00 | Still | Q-Normal | Flat-T | 0.00dB | pr-0ms |
| 60bpm | HRT-Normal | No-Depression | +P | 256sps | qrs-0ms |
| 1bps | TO=42.14 | ST-Normal | DC | HRV | qtc-0ms |
| TS=66.8 | STm=0.2196 | 5.64 | 0.00% |
| P=0v | ~P=0v | Q=-0.01v | R=0.021v | S=-0.007v | T=0v | ~T=0v |
ECG Interpretation
Probably Ventricular Fibrillation
38 Ventricular Fibrillation
- Rate = 60bpm (60-100 bpm)
- P-Wave Present (Atrial Depolarization)
- PR-Interval = 0ms. (Normal 0.12s-0.20s + Allowance)
- QRS Interval = 0ms. (Normal 0.06s-0.12s + Allowance)
- QTc Interval = 0ms. (QTc is abnormally short if < 350ms. QTc is prolonged if > 440ms in men or > 460ms in women + Allowance)
- Heart Rate Variability = 0.00% smaller than 5.00%
- Deceleration Capacity: 5.64
- PQRST-Status: +P Wave, Q-Normal Wave, Flat-T Wave
- ST-Analysis: ST-Normal
- No-Depression: ST-Segment Area Under the Curve is approximately zero.
- ST-Slope: STm=0.2196
- Heart Rate Turbulence: TO=42.14, TS=66.8
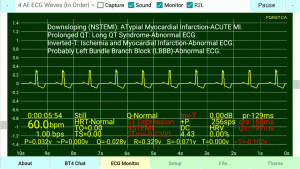
Left-Bundle-Branch-Block
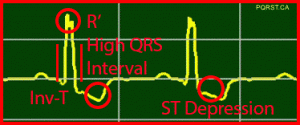
39 Left Bundle Branch Block
左束支阻滯
| 0:00:00:00 | Still | Q-Normal | Inv-T | 0.00dB | pr-129ms |
| 60bpm | HRT-Normal | ST Depression | +P | 256sps | qrs-168ms |
| 1bps | TO=0 | NSTEMI | DC | HRV | qtc-797ms |
| TS=0 | STm=-0.1300 | 4.43 | 0.00% |
| P=0.032v | ~P=0v | Q=-0.028v | R=0.329v | S=-0.071v | T=0v | ~T=-0.102v |
ECG Interpretation
Downsloping (NSTEMI): ATypial Myocardial Infarction-ACUTE MI.
Prolonged QT: Long QT Syndrome-Abnormal ECG.
Inverted-T: Ischemia and Myocardial Infarction-Abnormal ECG.
Probably Left Bundle Branch Block (LBBB)-Abnormal ECG.
39 Left Bundle Branch Block
- Rate = 60bpm (60-100 bpm)
- P-Wave Present (Atrial Depolarization)
- PR-Interval = 129ms. (Normal 0.12s-0.20s + Allowance)
- QRS Interval = 168ms. (Normal 0.06s-0.12s + Allowance)
- QTc Interval = 797ms. (QTc is abnormally short if < 350ms. QTc is prolonged if > 440ms in men or > 460ms in women + Allowance)
- Heart Rate Variability = 0.00% smaller than 5.00%
- Deceleration Capacity: 4.43
- PQRST-Status: +P Wave, Q-Normal Wave, Inv-T Wave
- ST-Analysis: NSTEMI
- ST Depression: ST-Segment Area Under the Curve is approximately zero.
- ST-Slope: STm=-0.1300
- Heart Rate Turbulence: TO=0, TS=0
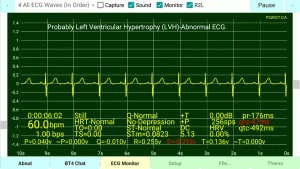
Left-Ventricular-Hypertrophy
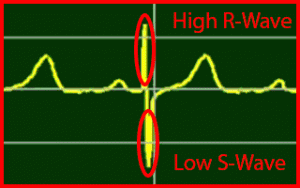
40 Left Ventricular Hypertrophy
左心室肥大
| 0:00:00:00 | Still | Q-Normal | +T | 0.00dB | pr-176ms |
| 60bpm | HRT-Normal | No-Depression | +P | 256sps | qrs-47ms |
| 1bps | TO=0 | ST-Normal | DC | HRV | qtc-492ms |
| TS=0 | STm=0.0823 | 5.13 | 0.00% |
| P=0.04v | ~P=0v | Q=-0.01v | R=0.255v | S=-0.293v | T=0.136v | ~T=0v |
ECG Interpretation
Probably Left Ventricular Hypertrophy (LVH)-Abnormal ECG.
40 Left Ventricular Hypertrophy
- Rate = 60bpm (60-100 bpm)
- P-Wave Present (Atrial Depolarization)
- PR-Interval = 176ms. (Normal 0.12s-0.20s + Allowance)
- QRS Interval = 47ms. (Normal 0.06s-0.12s + Allowance)
- QTc Interval = 492ms. (QTc is abnormally short if < 350ms. QTc is prolonged if > 440ms in men or > 460ms in women + Allowance)
- Heart Rate Variability = 0.00% smaller than 5.00%
- Deceleration Capacity: 5.13
- PQRST-Status: +P Wave, Q-Normal Wave, +T Wave
- ST-Analysis: ST-Normal
- No-Depression: ST-Segment Area Under the Curve is approximately zero.
- ST-Slope: STm=0.0823
- Heart Rate Turbulence: TO=0, TS=0
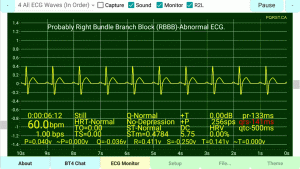
Right-Bundle-Branch-Block
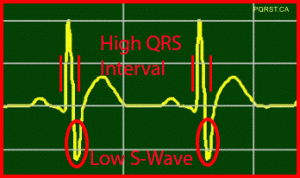
41 Right Bundle Branch Block
右束支阻滯
| 0:00:00:00 | Still | Q-Normal | +T | 0.00dB | pr-133ms |
| 60bpm | HRT-Normal | No-Depression | +P | 256sps | qrs-141ms |
| 1bps | TO=0 | ST-Normal | DC | HRV | qtc-500ms |
| TS=0 | STm=0.4784 | 5.75 | 0.00% |
| P=0.04v | ~P=0v | Q=-0.036v | R=0.411v | S=-0.25v | T=0.141v | ~T=0v |
ECG Interpretation
Probably Right Bundle Branch Block (RBBB)-Abnormal ECG.
41 Right Bundle Branch Block
- Rate = 60bpm (60-100 bpm)
- P-Wave Present (Atrial Depolarization)
- PR-Interval = 133ms. (Normal 0.12s-0.20s + Allowance)
- QRS Interval = 141ms. (Normal 0.06s-0.12s + Allowance)
- QTc Interval = 500ms. (QTc is abnormally short if < 350ms. QTc is prolonged if > 440ms in men or > 460ms in women + Allowance)
- Heart Rate Variability = 0.00% smaller than 5.00%
- Deceleration Capacity: 5.75
- PQRST-Status: +P Wave, Q-Normal Wave, +T Wave
- ST-Analysis: ST-Normal
- No-Depression: ST-Segment Area Under the Curve is approximately zero.
- ST-Slope: STm=0.4784
- Heart Rate Turbulence: TO=0, TS=0
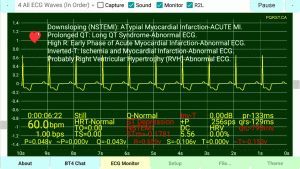
Right-Ventricular-Hypertrophy
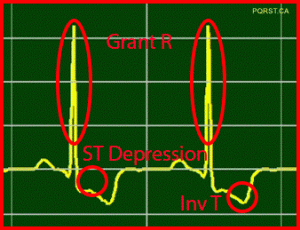
42 Right Ventricular Hypertrophy
右心室肥大
| 0:00:00:00 | Still | Q-Normal | Inv-T | 0.00dB | pr-133ms |
| 60bpm | HRT-Normal | ST Depression | +P | 256sps | qrs-129ms |
| 1bps | TO=0 | NSTEMI | DC | HRV | qtc-793ms |
| TS=0 | STm=-0.1781 | 5.56 | 0.00% |
| P=0.048v | ~P=0v | Q=-0.043v | R=0.659v | S=-0.106v | T=0v | ~T=-0.153v |
ECG Interpretation
Downsloping (NSTEMI): ATypial Myocardial Infarction-ACUTE MI.
Prolonged QT: Long QT Syndrome-Abnormal ECG.
High R: Early Phase of Acute Myocardial Infarction-Abnormal ECG.
Inverted-T: Ischemia and Myocardial Infarction-Abnormal ECG.
Probably Right Ventricular Hypertrophy (RVH)-Abnormal ECG.
42 Right Ventricular Hypertrophy
- Rate = 60bpm (60-100 bpm)
- P-Wave Present (Atrial Depolarization)
- PR-Interval = 133ms. (Normal 0.12s-0.20s + Allowance)
- QRS Interval = 129ms. (Normal 0.06s-0.12s + Allowance)
- QTc Interval = 793ms. (QTc is abnormally short if < 350ms. QTc is prolonged if > 440ms in men or > 460ms in women + Allowance)
- Heart Rate Variability = 0.00% smaller than 5.00%
- Deceleration Capacity: 5.56
- PQRST-Status: +P Wave, Q-Normal Wave, Inv-T Wave
- ST-Analysis: NSTEMI
- ST Depression: ST-Segment Area Under the Curve is approximately zero.
- ST-Slope: STm=-0.1781
- Heart Rate Turbulence: TO=0, TS=0


