ECG Interpretation – PQRST Complex
ECG Interpretation?
- Rate (60-100 bpm)
- P-Wave Present (Atrial Depolarization)
- PR-Interval (Normal 0.12s-0.20s)
- QRS (Ventricular Depolarization)
- QRS Interval (Normal 0.06s-0.12s)
- QTc Interval (QTc is abnormally short if < 350ms. QTc is prolonged if > 440ms in men or > 460ms in women.)
- HRV greater than 5.00%
- PQRST Status – (+P, Inv-P, Bi-P, Grant-P, Q-Normal, Q-Abnormal, +S, -S, +T, Inv-T, Grant-T)
- ST-Analysis (Normal, STEMI, NSTEMI)
- (ST-Elevation, ST-Depression, No Depression)
- ST Slope = (positive, negative , horizontal)
- ST-Segment Area Under the Curve (above zero, below zero, approximately zero)
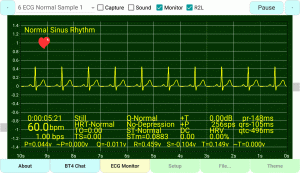
Normal-Sinus-Rhythm
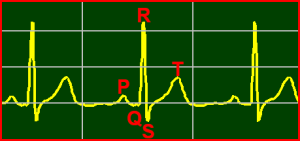
1 ECG/EKG Normal Sinus Rhythm
| 0:00:00:00 | Still | Q-Normal | +T | 0.00dB | pr-148ms |
| 60.0bpm | HRT-Normal | No-Depression | +P | 256sps | qrs-105ms |
| 1.00bps | TO=0.00 | ST-Normal | DC | HRV | qtc-496ms |
| TS=0.00 | STm=0.0883 | 0.00 | 0.00% |
| P=0.044v | ~P=0.000v | Q=-0.011v | R=0.459v | S=-0.104v | T=0.149v | ~T=0.000v |
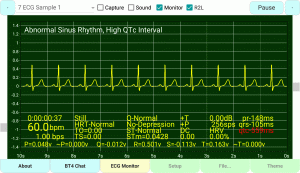
ecg/ekg-Sample
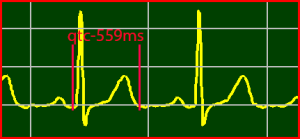
2 ECG Sample
| 0:00:00:00 | Still | Q-Normal | +T | 0.00dB | pr-148ms |
| 60.0bpm | HRT-Normal | No-Depression | +P | 256sps | qrs-105ms |
| 1.00bps | TO=0.00 | ST-Normal | DC | HRV | qtc-559ms |
| TS=0.00 | STm=0.0428 | 0.00 | 0.00% |
| P=0.048v | ~P=0.000v | Q=-0.012v | R=0.501v | S=-0.113v | T=0.163v | ~T=0.000v |
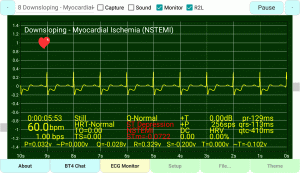
Downsloping-Myocardial-Ischemia-(NSTEMI)-Inverted-T-Wave
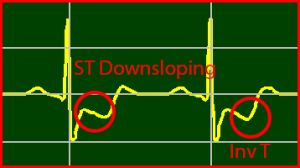
3 Downsloping - Myocardial Ischemia (NSTEMI)
| 0:00:00:00 | Still | Q-Normal | Inv-T | 0.00dB | pr-129ms |
| 60.0bpm | HRT-Normal | ST Depression | +P | 256sps | qrs-113ms |
| 1.00bps | TO=0.00 | NSTEMI | DC | HRV | qtc-410ms |
| TS=0.00 | STm=-0.0722 | 0.00 | 0.00% |
| P=0.032v | ~P=0.000v | Q=-0.028v | R=0.329v | S=-0.200v | T=0.000v | ~T=-0.102v |
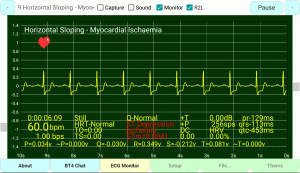
Horizontal-Sloping-Myocardial-Ischemia
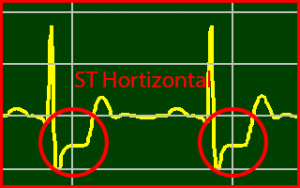
4 Horizontal Sloping - Myocardial Ischemia
| 0:00:00:00 | Still | Q-Normal | +T | 0.00dB | pr-129ms |
| 60.0bpm | HRT-Normal | ST Depression | +P | 256sps | qrs-113ms |
| 1.00bps | TO=0.00 | Ischemia | DC | HRV | qtc-453ms |
| TS=0.00 | STm=0.0041 | 0.00 | 0.00% |
| P=0.034v | ~P=0.000v | Q=-0.030v | R=0.349v | S=-0.212v | T=0.081v | ~T=0.000v |
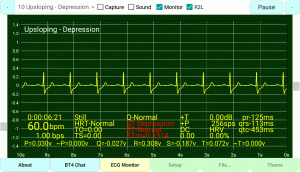
Upsloping-Depression
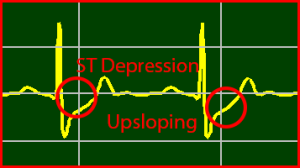
5 Upsloping - Depression
| 0:00:00:00 | Still | Q-Normal | +T | 0.00dB | pr-125ms |
| 60.0bpm | HRT-Normal | ST Depression | +P | 256sps | qrs-113ms |
| 1.00bps | TO=0.00 | ST-Normal | DC | HRV | qtc-453ms |
| TS=0.00 | STm=0.1314 | 0.00 | 0.00% |
| P=0.030v | ~P=0.000v | Q=-0.027v | R=0.308v | S=-0.187v | T=0.072v | ~T=0.000v |
Upsloping-Depression
- Rate (60-100 bpm)
- P-Wave Present (Atrial Depolarization)
- PR-Interval = 125ms. (Normal 0.12s-0.20s)
- QRS (Ventricular Depolarization)
- QRS Interval = 113ms. (Normal 0.06s-0.12s)
- QTc Interval = 453ms. (QTc is abnormally short if < 350ms. QTc is prolonged if > 440ms in men or > 460ms in women.)
- ST-Analysis Normal
- ST Depression
- ST Slope = positive
- Area Under the Curve is negative
- HRV = 0.00% smaller than 5.00%
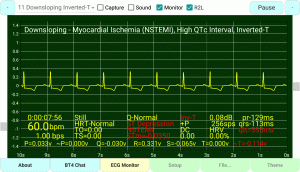
Downsloping-Inverted-T Myocardial Ischemia (NSTEMI)
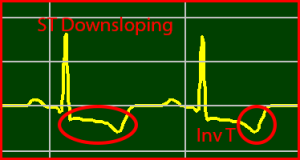
6 Downsloping Inverted-T
| 0:00:00:00 | Still | Q-Normal | Inv-T | 0.00dB | pr-129ms |
| 60.0bpm | HRT-Normal | ST Depression | +P | 256sps | qrs-113ms |
| 1.00bps | TO=0.00 | NSTEMI | DC | HRV | qtc-555ms |
| TS=0.00 | STm=-0.0346 | 0.00 | 0.00% |
| P=0.033v | ~P=0.000v | Q=-0.029v | R=0.328v | S=-0.065v | T=0.000v | ~T=-0.113v |
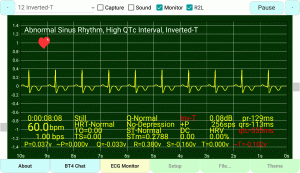
Inverted T-Wave
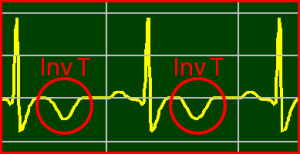
7 Inverted-T
| 0:00:00:00 | Still | Q-Normal | Inv-T | 0.00dB | pr-129ms |
| 60.0bpm | HRT-Normal | No-Depression | +P | 256sps | qrs-113ms |
| 1.00bps | TO=0.00 | ST-Normal | DC | HRV | qtc-555ms |
| TS=0.00 | STm=0.2760 | 0.00 | 0.00% |
| P=0.037v | ~P=0.000v | Q=-0.032v | R=0.377v | S=-0.159v | T=0.000v | ~T=-0.101v |
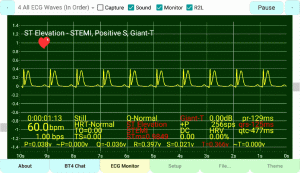
Positive S-Wave & Prolong T-Wave
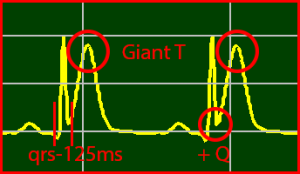
8 Positive S & Prolong T
| 0:00:00:00 | Still | Q-Normal | Giant-T | 0.00dB | pr-129ms |
| 60.0bpm | HRT-Normal | ST Elevation | +P | 256sps | qrs-125ms |
| 1.00bps | TO=0.00 | STEMI | DC | HRV | qtc-477ms |
| TS=0.00 | STm=0.9849 | 0.00 | 0.00% |
| P=0.038v | ~P=0.000v | Q=-0.036v | R=0.397v | S=0.021v | T=0.366v | ~T=0.000v |
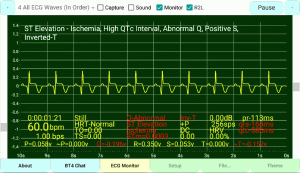
Positive-Horizontal-ST & Inverted-T
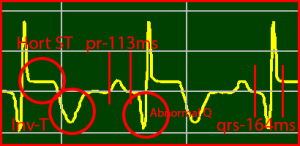
9 Positive Horizontal ST & Inverted T
| 0:00:00:00 | Still | Q-Abnormal | Inv-T | 0.00dB | pr-113ms |
| 60.0bpm | HRT-Normal | ST Elevation | +P | 256sps | qrs-164ms |
| 1.00bps | TO=0.00 | Ischemia | DC | HRV | qtc-586ms |
| TS=0.00 | STm=0.0003 | 0.00 | 0.00% |
| P=0.058v | ~P=0.000v | Q=-0.196v | R=0.350v | S=0.053v | T=0.000v | ~T=-0.152v |
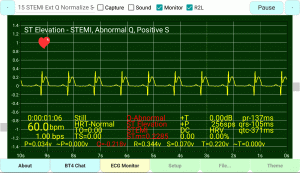
ST-Elevation STEMI Extended-Q Normalize-ST
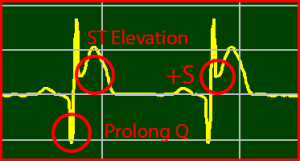
10 STEMI Ext Q Normalize ST
| 0:00:00:00 | Still | Q-Abnormal | +T | 0.00dB | pr-137ms |
| 60.0bpm | HRT-Normal | ST Elevation | +P | 256sps | qrs-105ms |
| 1.00bps | TO=0.00 | STEMI | DC | HRV | qtc-371ms |
| TS=0.00 | STm=0.2285 | 0.00 | 0.00% |
| P=0.034v | ~P=0.000v | Q=-0.218v | R=0.344v | S=0.070v | T=0.220v | ~T=0.000v |
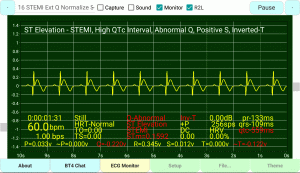
ST Elevation STEMI Extended Q Normalized-ST Inverted T-Wave
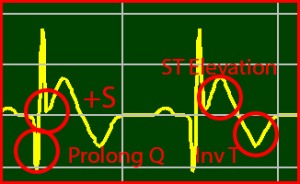
11 STEMI Ext Q Normalize ST Inverted T
| 0:00:00:00 | Still | Q-Abnormal | Inv-T | 0.00dB | pr-133ms |
| 60.0bpm | HRT-Normal | ST Elevation | +P | 256sps | qrs-109ms |
| 1.00bps | TO=0.00 | STEMI | DC | HRV | qtc-559ms |
| TS=0.00 | STm=0.1592 | 0.00 | 0.00% |
| P=0.033v | ~P=0.000v | Q=-0.220v | R=0.345v | S=0.012v | T=0.000v | ~T=-0.122v |
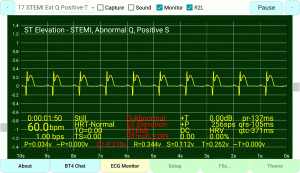
ST Elevation STEMI Extended Q-Wave Positive S-Wave Positive T-Wave
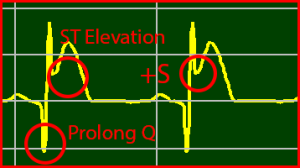
12 STEMI Ext Q Positive-T
| 0:00:00:00 | Still | Q-Abnormal | +T | 0.00dB | pr-137ms |
| 60.0bpm | HRT-Normal | ST Elevation | +P | 256sps | qrs-105ms |
| 1.00bps | TO=0.00 | STEMI | DC | HRV | qtc-371ms |
| TS=0.00 | STm=0.2285 | 0.00 | 0.00% |
| P=0.034v | ~P=0.000v | Q=-0.218v | R=0.344v | S=0.112v | T=0.262v | ~T=0.000v |
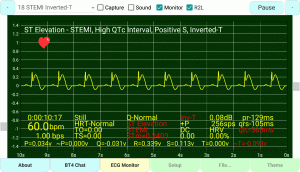
ST-Elevation STEMI Positive S-Wave Inverted-T Wave
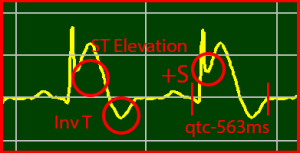
13 STEMI Inverted-T
| 0:00:00:00 | Still | Q-Normal | Inv-T | 0.00dB | pr-129ms |
| 60.0bpm | HRT-Normal | ST Elevation | +P | 256sps | qrs-105ms |
| 1.00bps | TO=0.00 | STEMI | DC | HRV | qtc-563ms |
| TS=0.00 | STm=0.2403 | 0.00 | 0.00% |
| P=0.034v | ~P=0.000v | Q=-0.031v | R=0.339v | S=0.113v | T=0.000v | ~T=-0.093v |
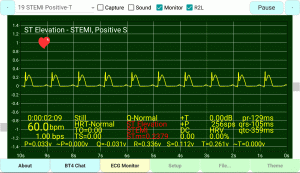
ST-Elevation STEMI Positive S-Wave Positive T-Wave
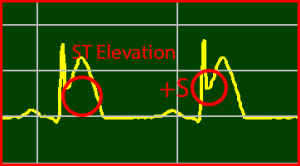
14 STEMI Positive-T
| 0:00:00:00 | Still | Q-Normal | +T | 0.00dB | pr-129ms |
| 60.0bpm | HRT-Normal | ST Elevation | +P | 256sps | qrs-105ms |
| 1.00bps | TO=0.00 | STEMI | DC | HRV | qtc-359ms |
| TS=0.00 | STm=0.2379 | 0.00 | 0.00% |
| P=0.033v | ~P=0.000v | Q=-0.031v | R=0.336v | S=0.112v | T=0.261v | ~T=0.000v |
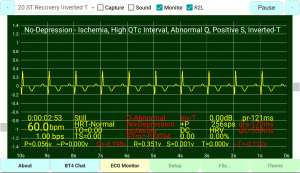
ST-Recovery Inverted T-Wave Prolong Q-Wave
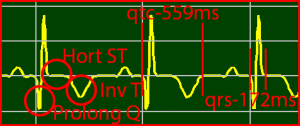
15 ST Recovery Inverted T
| 0:00:00:00 | Still | Q-Abnormal | Inv-T | 0.00dB | pr-121ms |
| 60.0bpm | HRT-Normal | No-Depression | +P | 256sps | qrs-172ms |
| 1.00bps | TO=0.00 | Ischemia | DC | HRV | qtc-559ms |
| TS=0.00 | STm=-0.0034 | 0.00 | 0.00% |
| P=0.056v | ~P=0.000v | Q=-0.198v | R=0.351v | S=0.001v | T=0.000v | ~T=-0.122v |
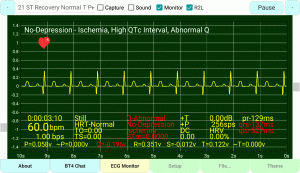
ST Recovery Normalized T-Wave Persistent Q-Wave
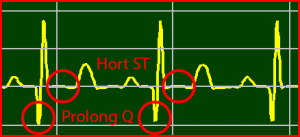
16 ST Recovery Normal T Persistent Q
| 0:00:00:00 | Still | Q-Abnormal | +T | 0.00dB | pr-129ms |
| 60.0bpm | HRT-Normal | No-Depression | +P | 256sps | qrs-137ms |
| 1.00bps | TO=0.00 | Ischemia | DC | HRV | qtc-527ms |
| TS=0.00 | STm=0.0000 | 0.00 | 0.00% |
| P=0.058v | ~P=0.000v | Q=-0.196v | R=0.351v | S=-0.012v | T=0.122v | ~T=0.000v |
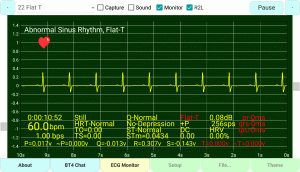
Flat T-Wave
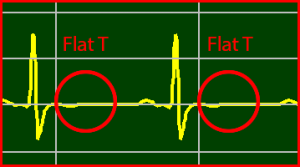
17 Flat T
| 0:00:00:00 | Still | Q-Normal | Flat-T | 0.00dB | pr-0ms |
| 60.0bpm | HRT-Normal | No-Depression | +P | 256sps | qrs-0ms |
| 1.00bps | TO=0.00 | ST-Normal | DC | HRV | qtc-0ms |
| TS=0.00 | STm=0.0430 | 0.00 | 0.00% |
| P=0.017v | ~P=0.000v | Q=-0.013v | R=0.307v | S=-0.143v | T=0.000v | ~T=0.000v |
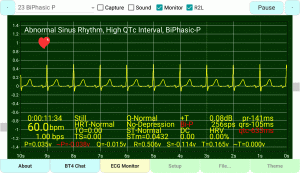
Biphasic P-Wave, Abnormal Sinus Rhythm
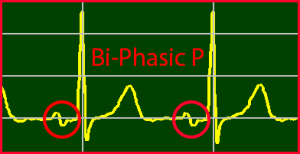
18 BiPhasic P
| 0:00:00:00 | Still | Q-Normal | +T | 0.00dB | pr-141ms |
| 60.0bpm | HRT-Normal | No-Depression | Bi-P | 256sps | qrs-105ms |
| 1.00bps | TO=0.00 | ST-Normal | DC | HRV | qtc-633ms |
| TS=0.00 | STm=0.0432 | 0.00 | 0.00% |
| P=0.035v | ~P=-0.038v | Q=-0.015v | R=0.506v | S=-0.114v | T=0.165v | ~T=0.000v |
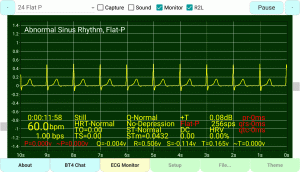
Flat P-Wave
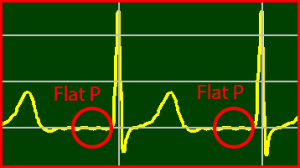
19 Flat P
| 0:00:00:00 | Still | Q-Normal | +T | 0.00dB | pr-0ms |
| 60.0bpm | HRT-Normal | No-Depression | Flat-P | 256sps | qrs-0ms |
| 1.00bps | TO=0.00 | ST-Normal | DC | HRV | qtc-0ms |
| TS=0.00 | STm=0.0432 | 0.00 | 0.00% |
| P=0.000v | ~P=0.000v | Q=-0.004v | R=0.506v | S=-0.114v | T=0.165v | ~T=0.000v |
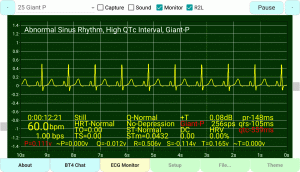
Giant P-Wave
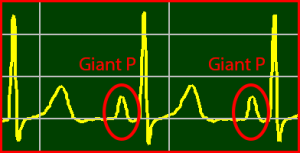
20 Giant P
| 0:00:00:00 | Still | Q-Normal | +T | 0.00dB | pr-148ms |
| 60.0bpm | HRT-Normal | No-Depression | Giant-P | 256sps | qrs-105ms |
| 1.00bps | TO=0.00 | ST-Normal | DC | HRV | qtc-559ms |
| TS=0.00 | STm=0.0432 | 0.00 | 0.00% |
| P=0.111v | ~P=0.000v | Q=-0.012v | R=0.506v | S=-0.114v | T=0.165v | ~T=0.000v |
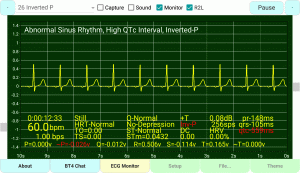
Inverted P-Wave
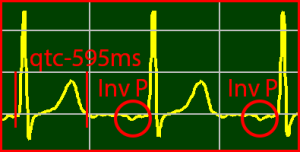
21 Inverted P
| 0:00:00:00 | Still | Q-Normal | +T | 0.00dB | pr-148ms |
| 60.0bpm | HRT-Normal | No-Depression | Inv-P | 256sps | qrs-105ms |
| 1.00bps | TO=0.00 | ST-Normal | DC | HRV | qtc-559ms |
| TS=0.00 | STm=0.0432 | 0.00 | 0.00% |
| P=0.000v | ~P=-0.026v | Q=-0.012v | R=0.506v | S=-0.114v | T=0.165v | ~T=0.000v |
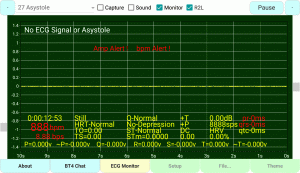
Asystole or NO ECG/EKG Signal
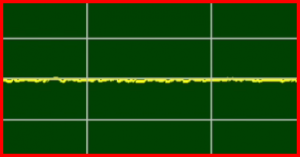
22 Asystole
| 0:00:00:00 | Still | Q-Normal | +T | 0.00dB | pr-0ms |
| 888.0bpm | HRT-Normal | No-Depression | +P | 256sps | qrs-0ms |
| 8.88bps | TO=0.00 | ST-Normal | DC | HRV | qtc-0ms |
| TS=0.00 | Stm=0.0000 | 0.00 | 0.00% |
| P=0.000v | ~P=0.000v | Q=0.000v | R=0.000v | S=0.000v | T=0.000v | ~T=0.000v |
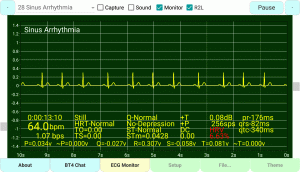
Sinus-Arrhythmia
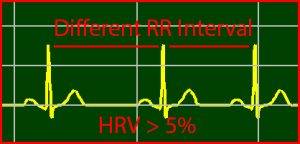
23 Sinus Arrhythmia
| 0:00:00:00 | Still | Q-Normal | +T | 0.00dB | pr-176ms |
| 64.0bpm | HRT-Normal | No-Depression | +P | 256sps | qrs-82ms |
| 1.07bps | TO=0.00 | ST-Normal | DC | HRV | qtc-340ms |
| TS=0.00 | Stm=0.0428 | 0.00 | 6.63% |
| P=0.034v | ~P=0.000v | Q=-0.027v | R=0.307v | S=-0.058v | T=0.081v | ~T=0.000v |
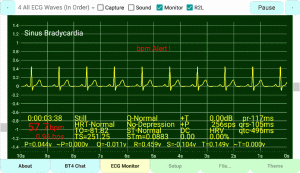
Sinus-Bradycardia
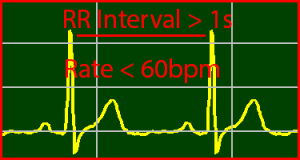
24 Sinus Bradycardia
| 0:00:00:00 | Still | Q-Normal | +T | 0.00dB | pr-117ms |
| 57.7bpm | HRT-Normal | No-Depression | +P | 256sps | qrs-105ms |
| 0.96bps | TO=-81.82 | ST-Normal | DC | HRV | qtc-496ms |
| TS=251.25 | STm=0.0883 | 0.00 | 0.00% |
| P=0.044v | ~P=0.000v | Q=-0.011v | R=0.459v | S=-0.104v | T=0.149v | ~T=0.000v |
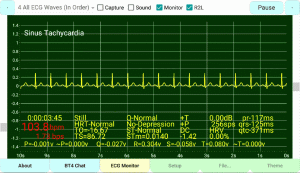
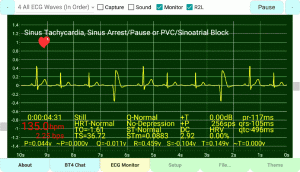
Sinus-Tachycardia
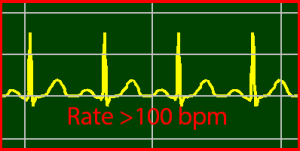
25 Sinus Tachycardia
| 0:00:00:00 | Still | Q-Normal | +T | 0.00dB | pr-117ms |
| 103.8bpm | HRT-Normal | No-Depression | +P | 256sps | qrs-125ms |
| 1.73bps | TO=-16.67 | ST-Normal | DC | HRV | qtc-371ms |
| TS=86.72 | STm=0.0140 | -1.42 | 0.00% |
| P=-0.001v | ~P=0.000v | Q=-0.027v | R=0.304v | S=-0.058v | T=0.080v | ~T=0.000v |
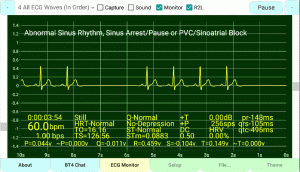
Sinus Arrest or Sinus Pause

26 Sinus Arrest
| 0:00:00:00 | Still | Q-Normal | +T | 0.00dB | pr-148ms |
| 60.0bpm | HRT-Normal | No-Depression | +P | 256sps | qrs-105ms |
| 1.00bps | TO=16.16 | ST-Normal | DC | HRV | qtc-496ms |
| TS=126.56 | STm=0.0883 | 0.50 | 0.00% |
| P=0.044v | ~P=0.000v | Q=-0.011v | R=0.459v | S=-0.104v | T=0.149v | ~T=0.000v |
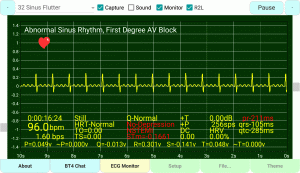
Sinus-Flutter, Undetermined-PQRST-Complex
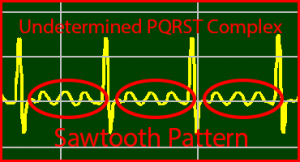
27 Sinus Flutter
| 0:00:00:00 | Still | Q-Normal | +T | 0.00dB | pr-211ms |
| 96.0bpm | HRT-Normal | No-Depression | +P | 256sps | qrs-105ms |
| 1.60bps | TO=0.00 | NSTEMI | DC | HRV | qtc-285ms |
| TS=0.00 | STm=-0.1661 | 0.00 | 0.00% |
| P=0.049v | ~P=0.000v | Q=-0.013v | R=0.301v | S=-0.141v | T=0.048v | ~T=0.000v |
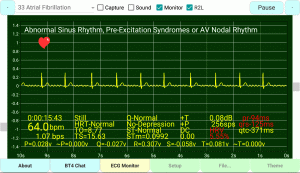
Atrial Fibrillation, Irregular Heartbeat, Undetermined-PQRST-Complex
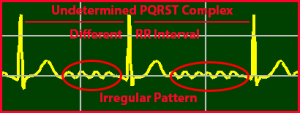
28 Atrial Fibrillation
| 0:00:00:00 | Still | Q-Normal | +T | 0.00dB | pr-94ms |
| 64.0bpm | HRT-Normal | No-Depression | +P | 256sps | qrs-125ms |
| 1.07bps | TO=8.77 | ST-Normal | DC | HRV | qtc-371ms |
| TS=15.63 | STm=0.0992 | 0.00 | 5.55% |
| P=0.028v | ~P=0.000v | Q=-0.027v | R=0.307v | S=-0.058v | T=0.081v | ~T=0.000v |
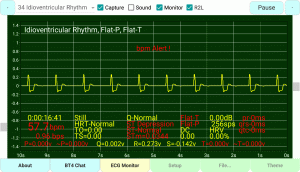
Idioventricular-Rhythm
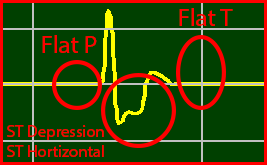
29 Idioventricular Rhythm
| 0:00:00:00 | Still | Q-Normal | Flat-T | 0.00dB | pr-0ms |
| 57.7bpm | HRT-Normal | ST Depression | Flat-P | 256sps | qrs-0ms |
| 0.96bps | TO=0.00 | ST-Normal | DC | HRV | qtc-0ms |
| TS=0.00 | STm=0.0344 | 0.00 | 0.00% |
| P=0.000v | ~P=0.000v | Q=0.002v | R=0.273v | S=-0.142v | T=0.000v | ~T=0.000v |
Premature-Ventricular-Contraction
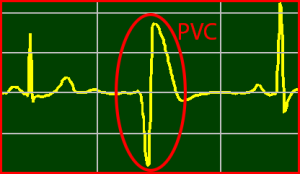
30 Premature Ventricular Contraction
| 0:00:00:00 | Still | Q-Normal | +T | 0.00dB | pr-117ms |
| 135.0bpm | HRT-Normal | No-Depression | +P | 256sps | qrs-105ms |
| 2.25bps | TO=-1.61 | ST-Normal | DC | HRV | qtc-496ms |
| TS=36.72 | STm=0.0883 | 2.92 | 0.00% |
| P=0.044v | ~P=0.000v | Q=-0.011v | R=0.459v | S=-0.104v | T=0.149v | ~T=0.000v |
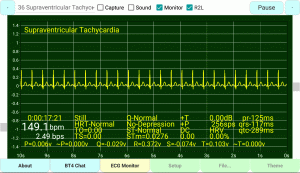
Supraventricular-Tachycardia
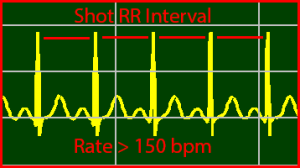
31 Supraventricular Tachycardia
| 0:00:00:00 | Still | Q-Normal | +T | 0.00dB | pr-125ms |
| 149.1bpm | HRT-Normal | No-Depression | +P | 256sps | qrs-117ms |
| 2.49bps | TO=0.00 | ST-Normal | DC | HRV | qtc-289ms |
| TS=0.00 | STm=0.0276 | 0.00 | 0.00% |
| P=0.006v | ~P=0.000v | Q=-0.029v | R=0.372v | S=-0.074v | T=0.103v | ~T=0.000v |
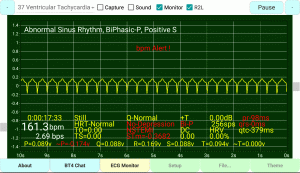
Ventricular-Tachycardia in ECG/EKG, Undetermined-PQRST-Complex
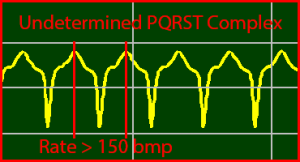
32 Ventricular Tachycardia
| 0:00:00:00 | Still | Q-Normal | +T | 0.00dB | pr-98ms |
| 161.3bpm | HRT-Normal | No-Depression | Bi-P | 256sps | qrs-0ms |
| 2.69bps | TO=0.00 | NSTEMI | DC | HRV | qtc-379ms |
| TS=0.00 | STm=-0.3682 | 0.00 | 0.00% |
| P=0.089v | ~P=-0.174v | Q=0.088v | R=0.169v | S=0.088v | T=0.094v | ~T=0.000v |
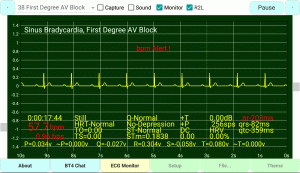
First-Degree-AV-Block
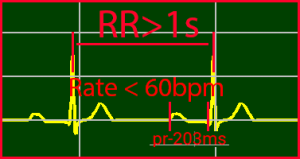
33 First Degree AV Block
| 0:00:00:00 | Still | Q-Normal | +T | 0.00dB | pr-203ms |
| 57.7bpm | HRT-Normal | No-Depression | +P | 256sps | qrs-82ms |
| 0.96bps | TO=0.00 | ST-Normal | DC | HRV | qtc-359ms |
| TS=0.00 | STm=0.1838 | 0.00 | 0.00% |
| P=0.034v | ~P=0.000v | Q=-0.027v | R=0.304v | S=-0.058v | T=0.080v | ~T=0.000v |
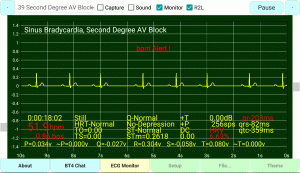
Second-Degree-AV-Block

34 Second Degree AV Block
| 0:00:00:00 | Still | Q-Normal | +T | 0.00dB | pr-203ms |
| 51.9bpm | HRT-Normal | No-Depression | +P | 256sps | qrs-82ms |
| 0.86bps | TO=0.00 | ST-Normal | DC | HRV | qtc-359ms |
| TS=0.00 | STm=0.1838 | 0.00 | 6.63% |
| P=0.034v | ~P=0.000v | Q=-0.027v | R=0.304v | S=-0.058v | T=0.080v | ~T=0.000v |
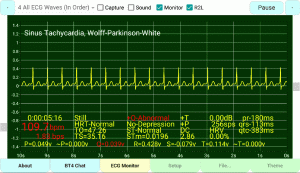
Wolff-Parkinson-White
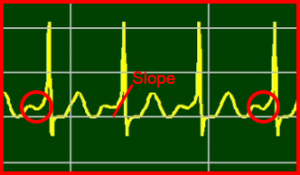
35 Wolff Parkinson White
| 0:00:00:00 | Still | +Q-Abnormal | +T | 0.00dB | pr-180ms |
| 109.7bpm | HRT-Normal | No-Depression | +P | 256sps | qrs-113ms |
| 1.83bps | TO=47.26 | ST-Normal | DC | HRV | qtc-383ms |
| TS=35.16 | STm=0.0196 | 2.86 | 0.00% |
| P=0.049v | ~P=0.000v | Q=0.039v | R=0.428v | S=-0.079v | T=0.114v | ~T=0.000v |
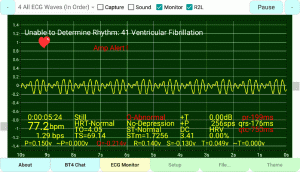
Ventricular-Fibrillation, Undetermined-PQRST-Complex
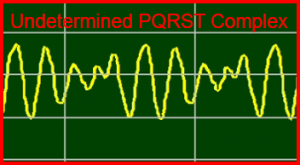
36 Ventricular Fibrillation
| 0:00:00:00 | Still | Q-Abnormal | +T | 0.00dB | pr-199ms |
| 77.2bpm | HRT-Normal | No-Depression | +P | 256sps | qrs-176ms |
| 1.29bps | TO=4.05 | ST-Normal | DC | HRV | qtc-750ms |
| TS=69.14 | STm=0.9933 | 3.41 | 0.00% |
| P=0.150v | ~P=0.000v | Q=-0.214v | R=0.140v | S=-0.130v | T=0.049v | ~T=0.000v |
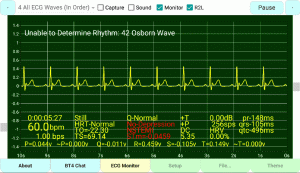
Osborn-Wave, Undetermined-PQRST-Complex
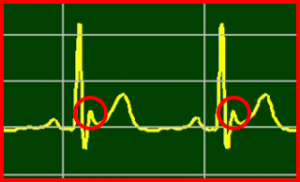
37 Osborn Wave
| 0:00:00:00 | Still | Q-Normal | +T | 0.00dB | pr-148ms |
| 60.0bpm | HRT-Normal | No-Depression | +P | 256sps | qrs-105ms |
| 1.00bps | TO=-22.30 | NSTEMI | DC | HRV | qtc-496ms |
| TS=69.14 | STm=-0.0459 | 5.35 | 0.00% |
| P=0.044v | ~P=0.000v | Q=-0.011v | R=0.459v | S=-0.105v | T=0.149v | ~T=0.000v |

