ECG Project Timeline
September 2022
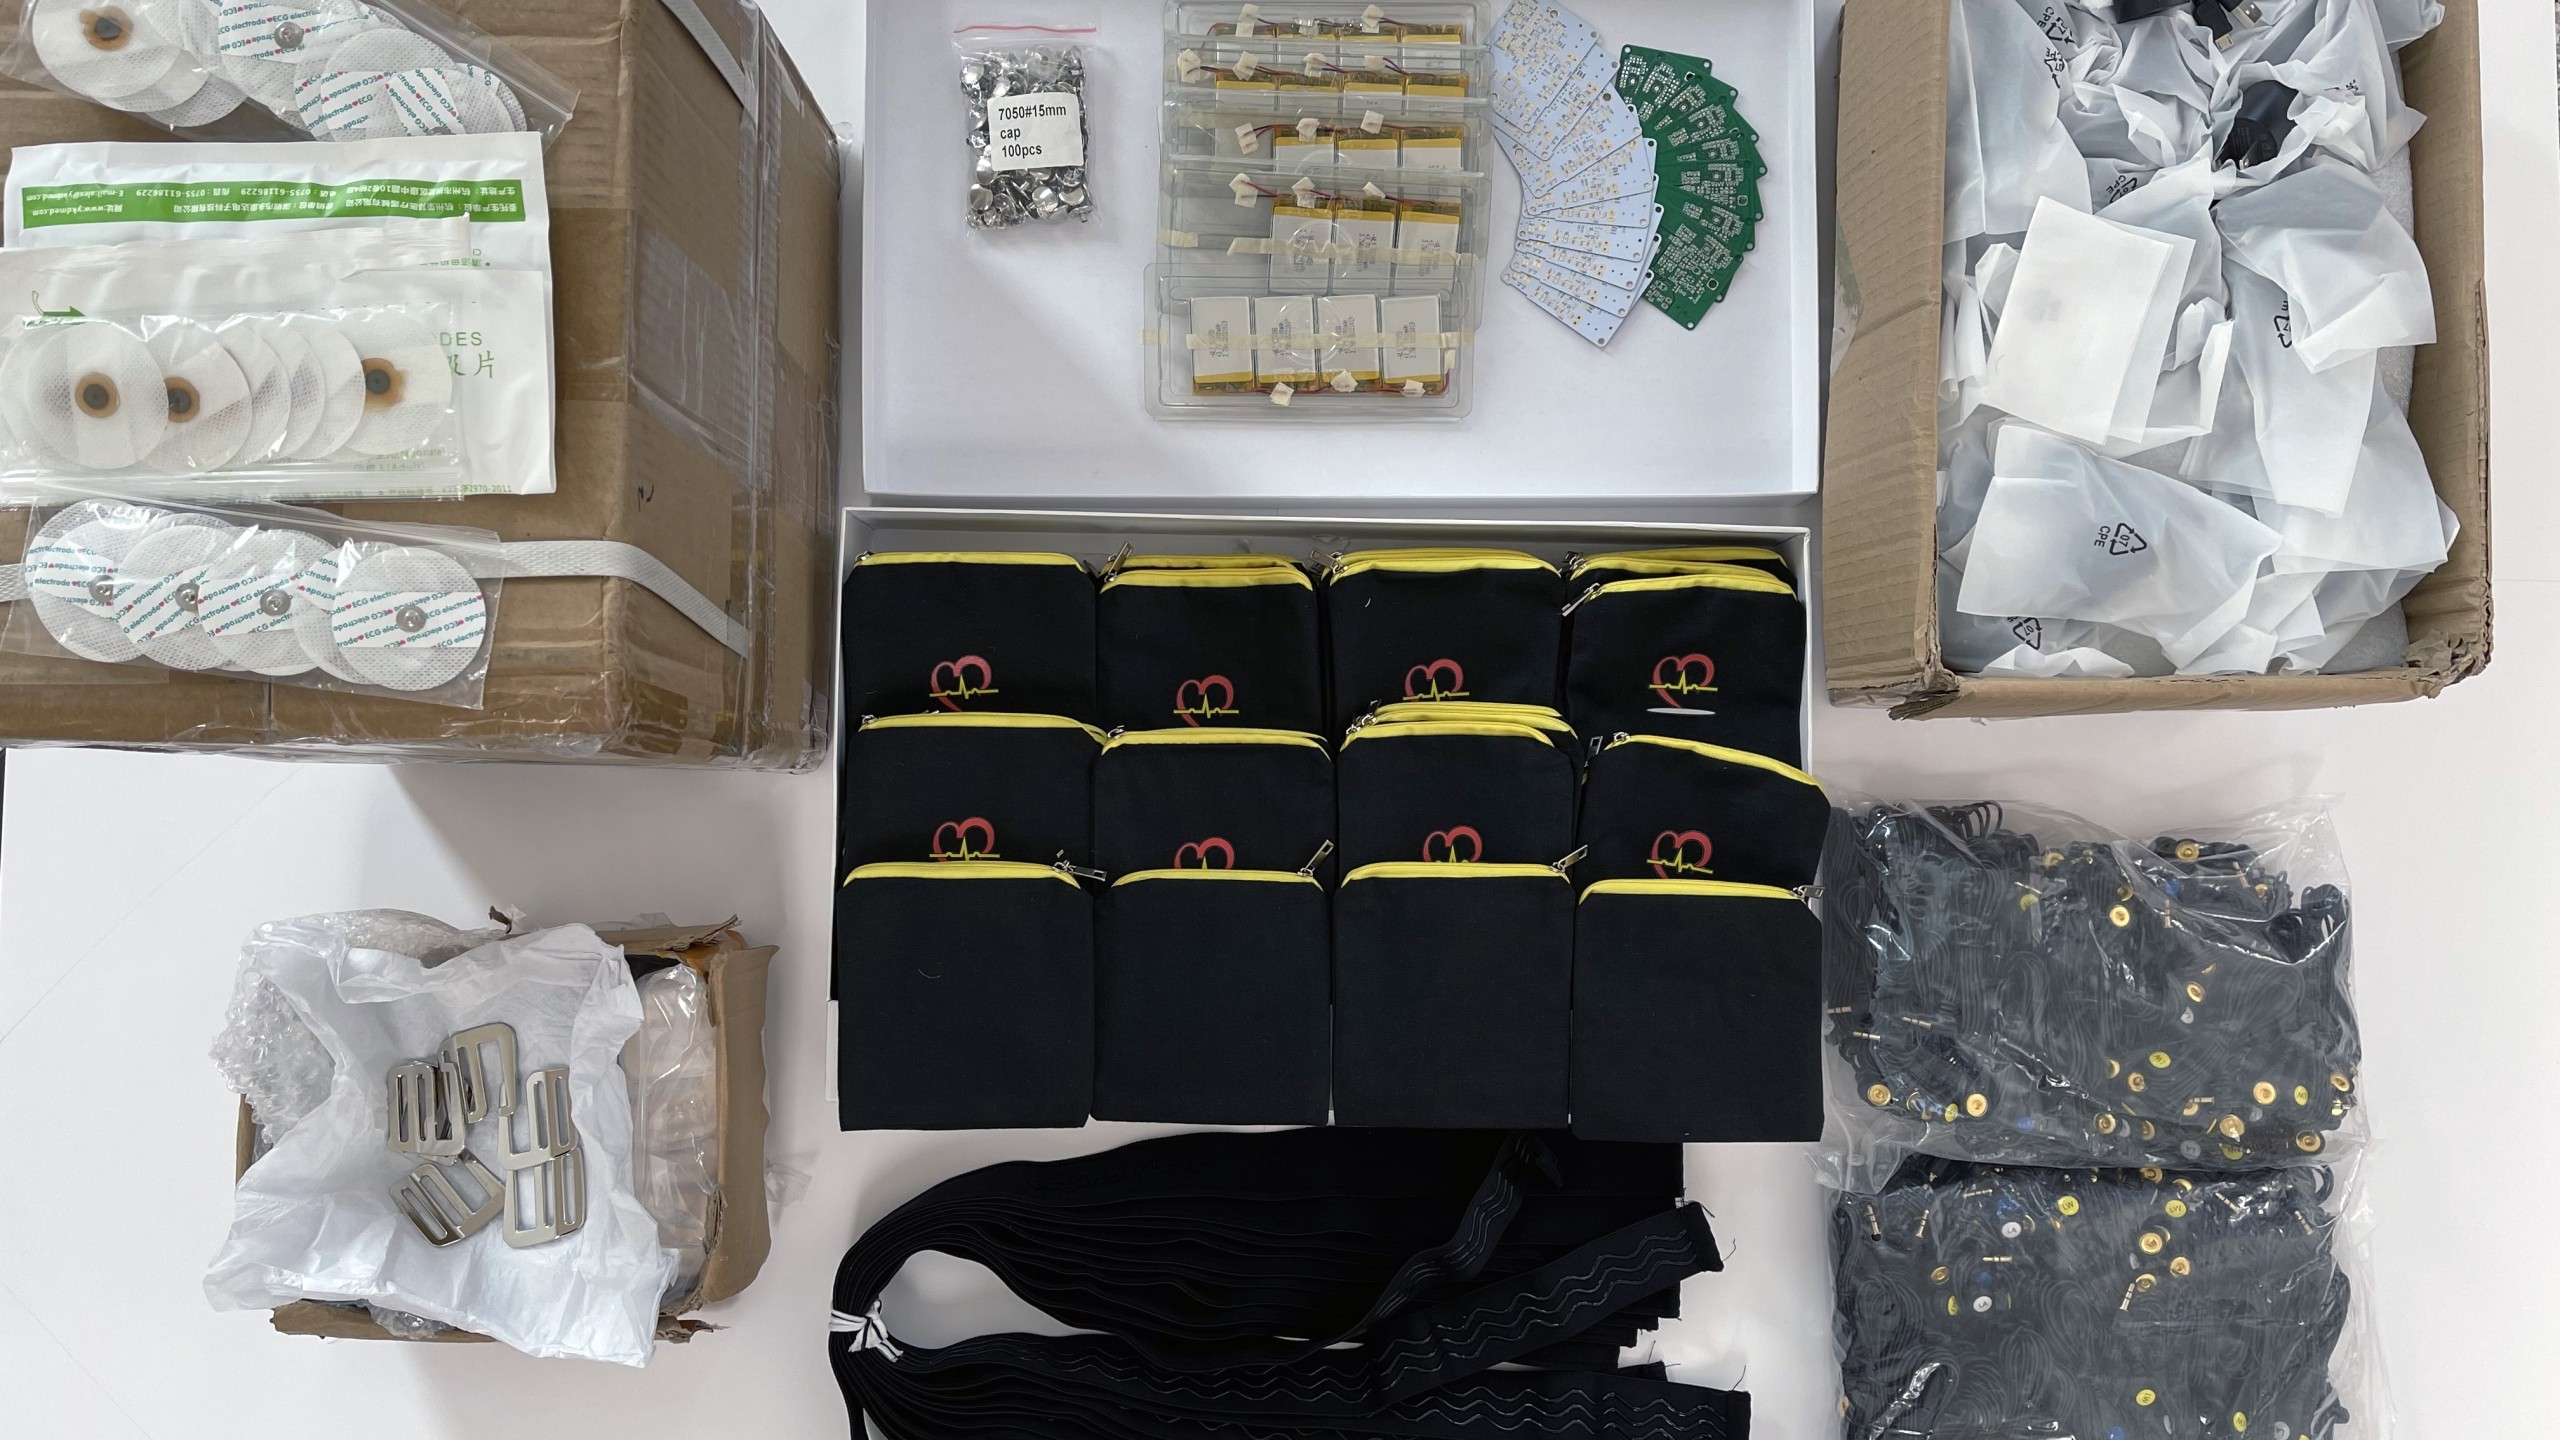
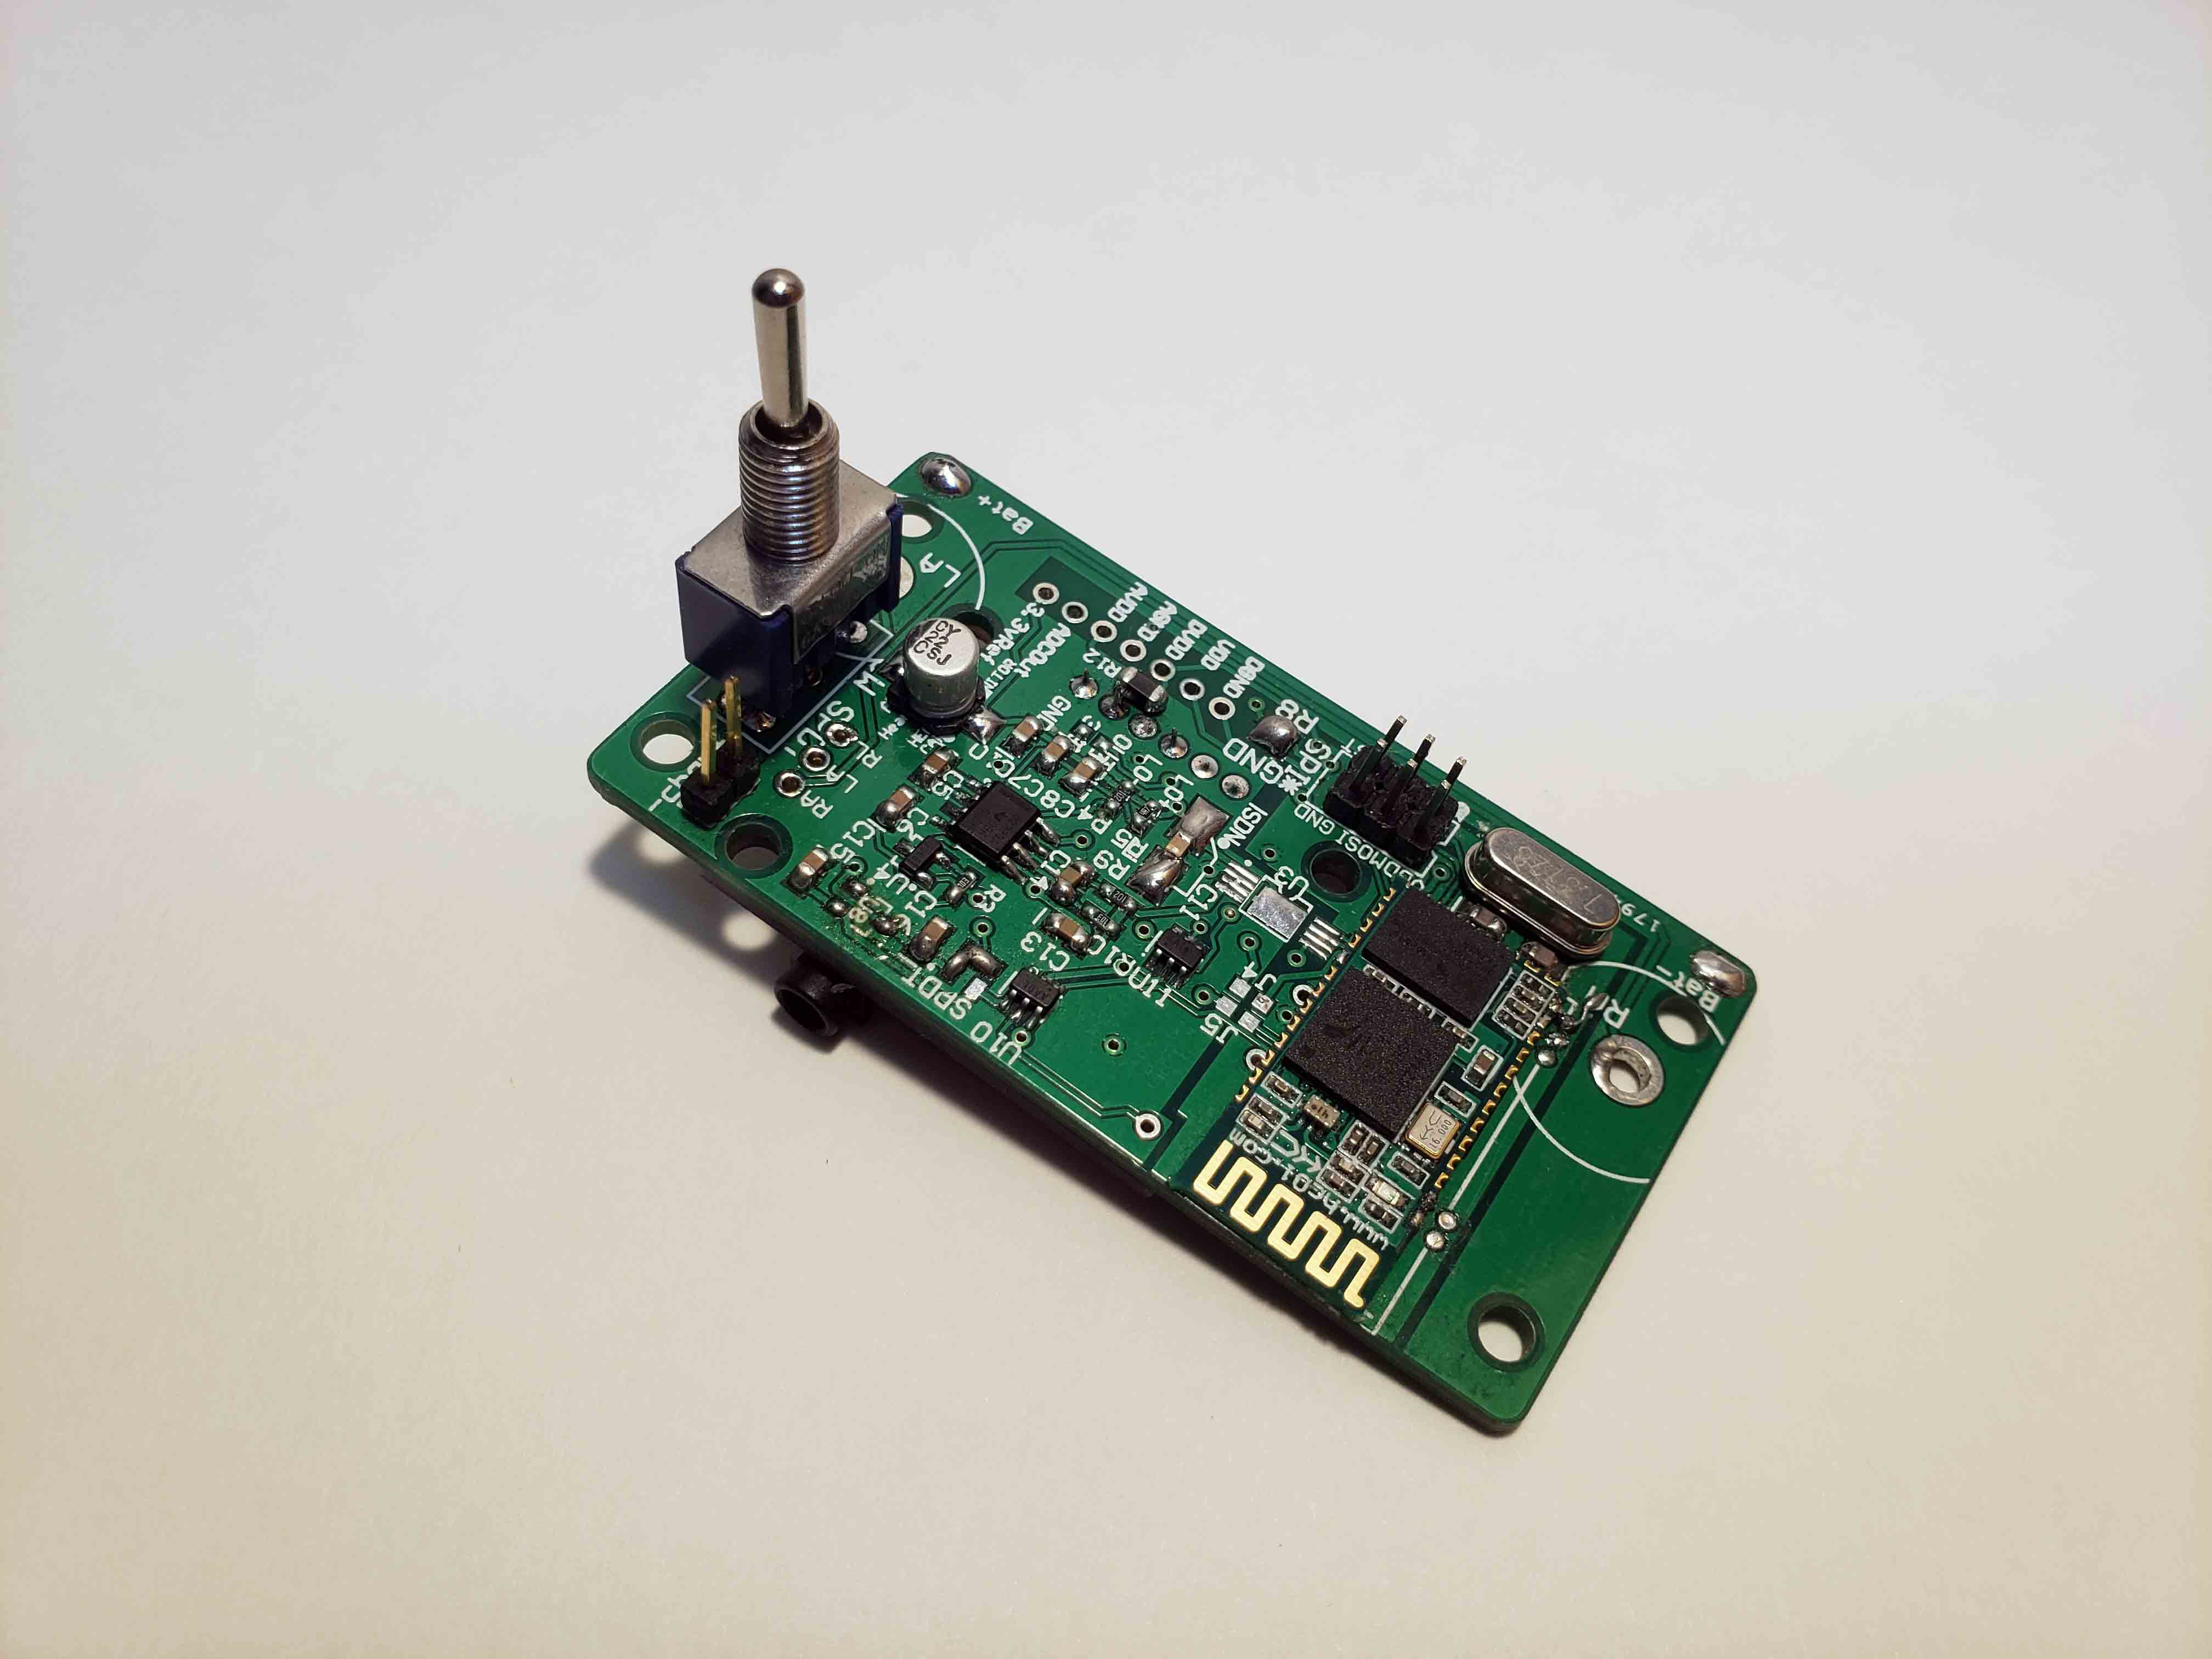
ecgMonitor PCB
ecgMonitor Pouch Bag
3-Lead ECG Cable
USB Charger
USB Cable
Elastic Belt
ECG Electrode
Contact Metal Piece
Li-ion Batteries
G-Hook
February 2020
How To Use ecgMonitor
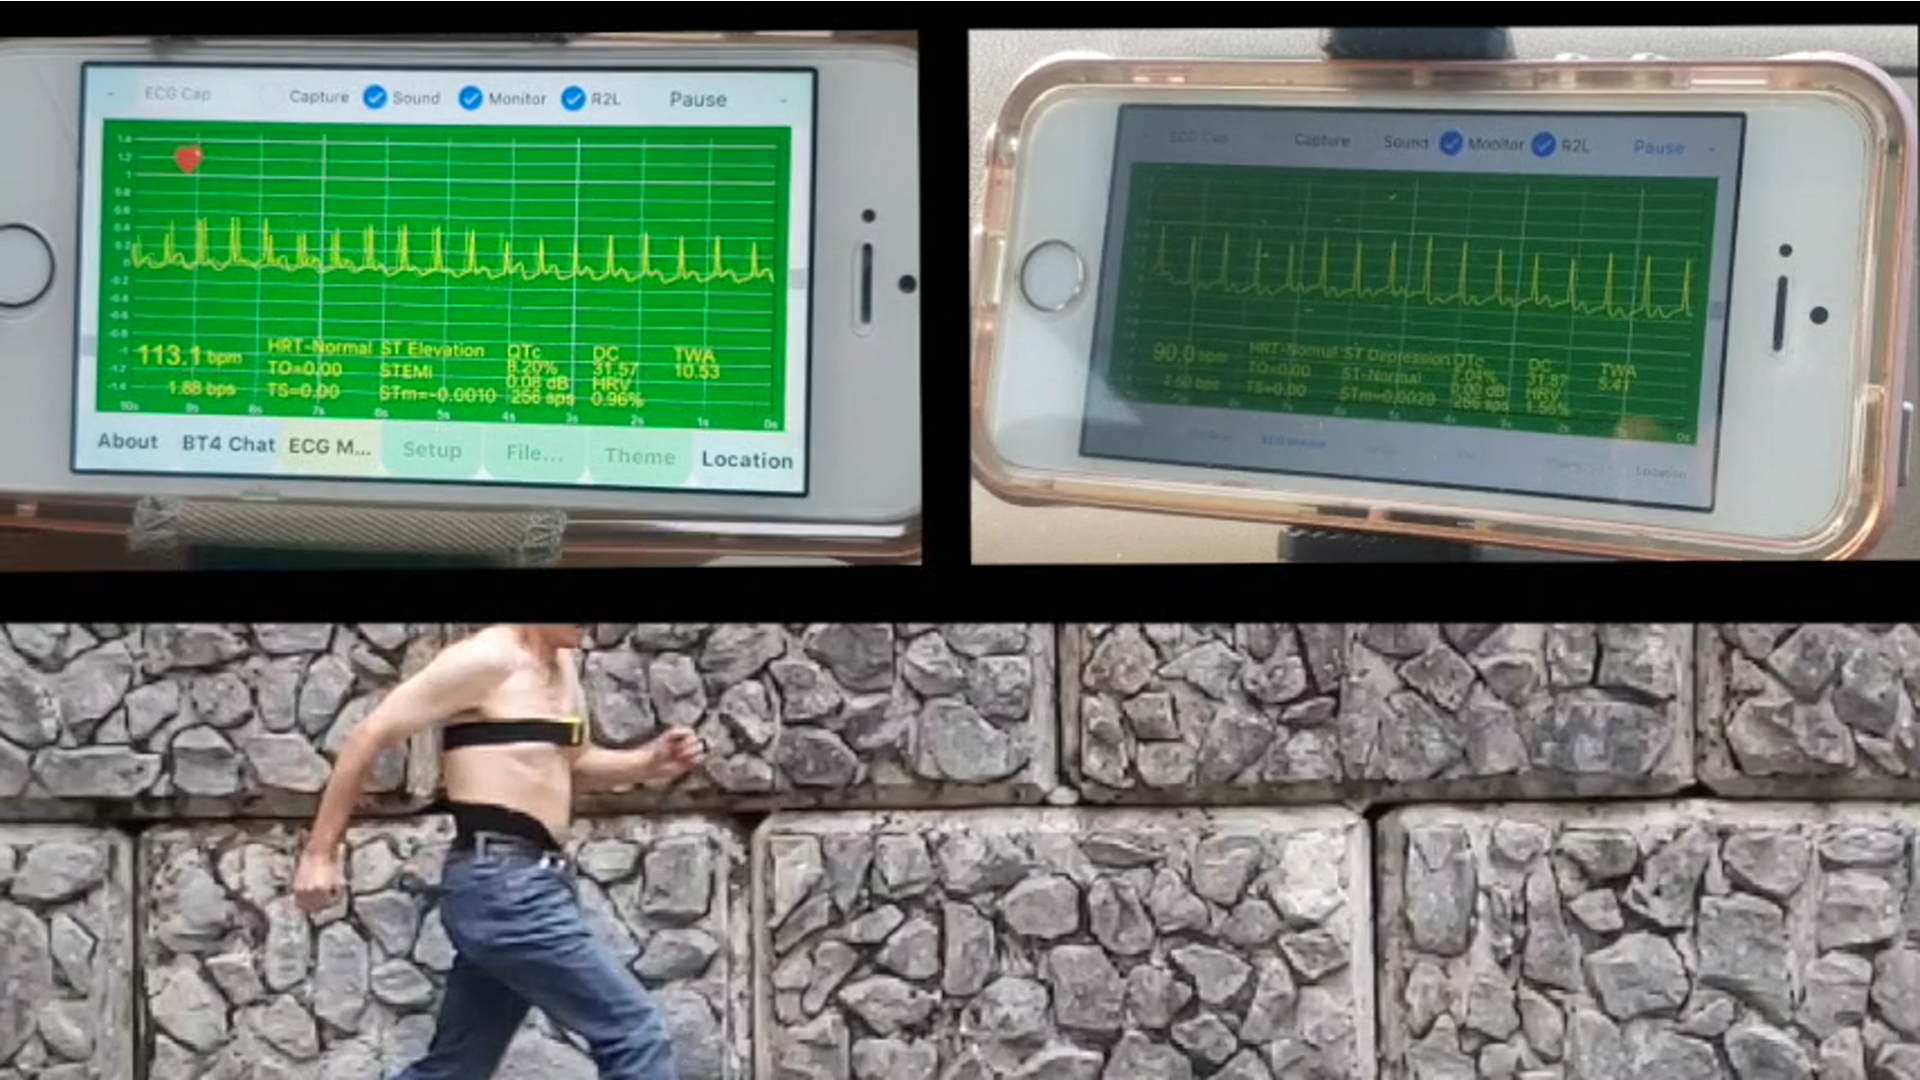
ecgMonitor Running Exercise in iPhone SE
How To Use ecgMonitor
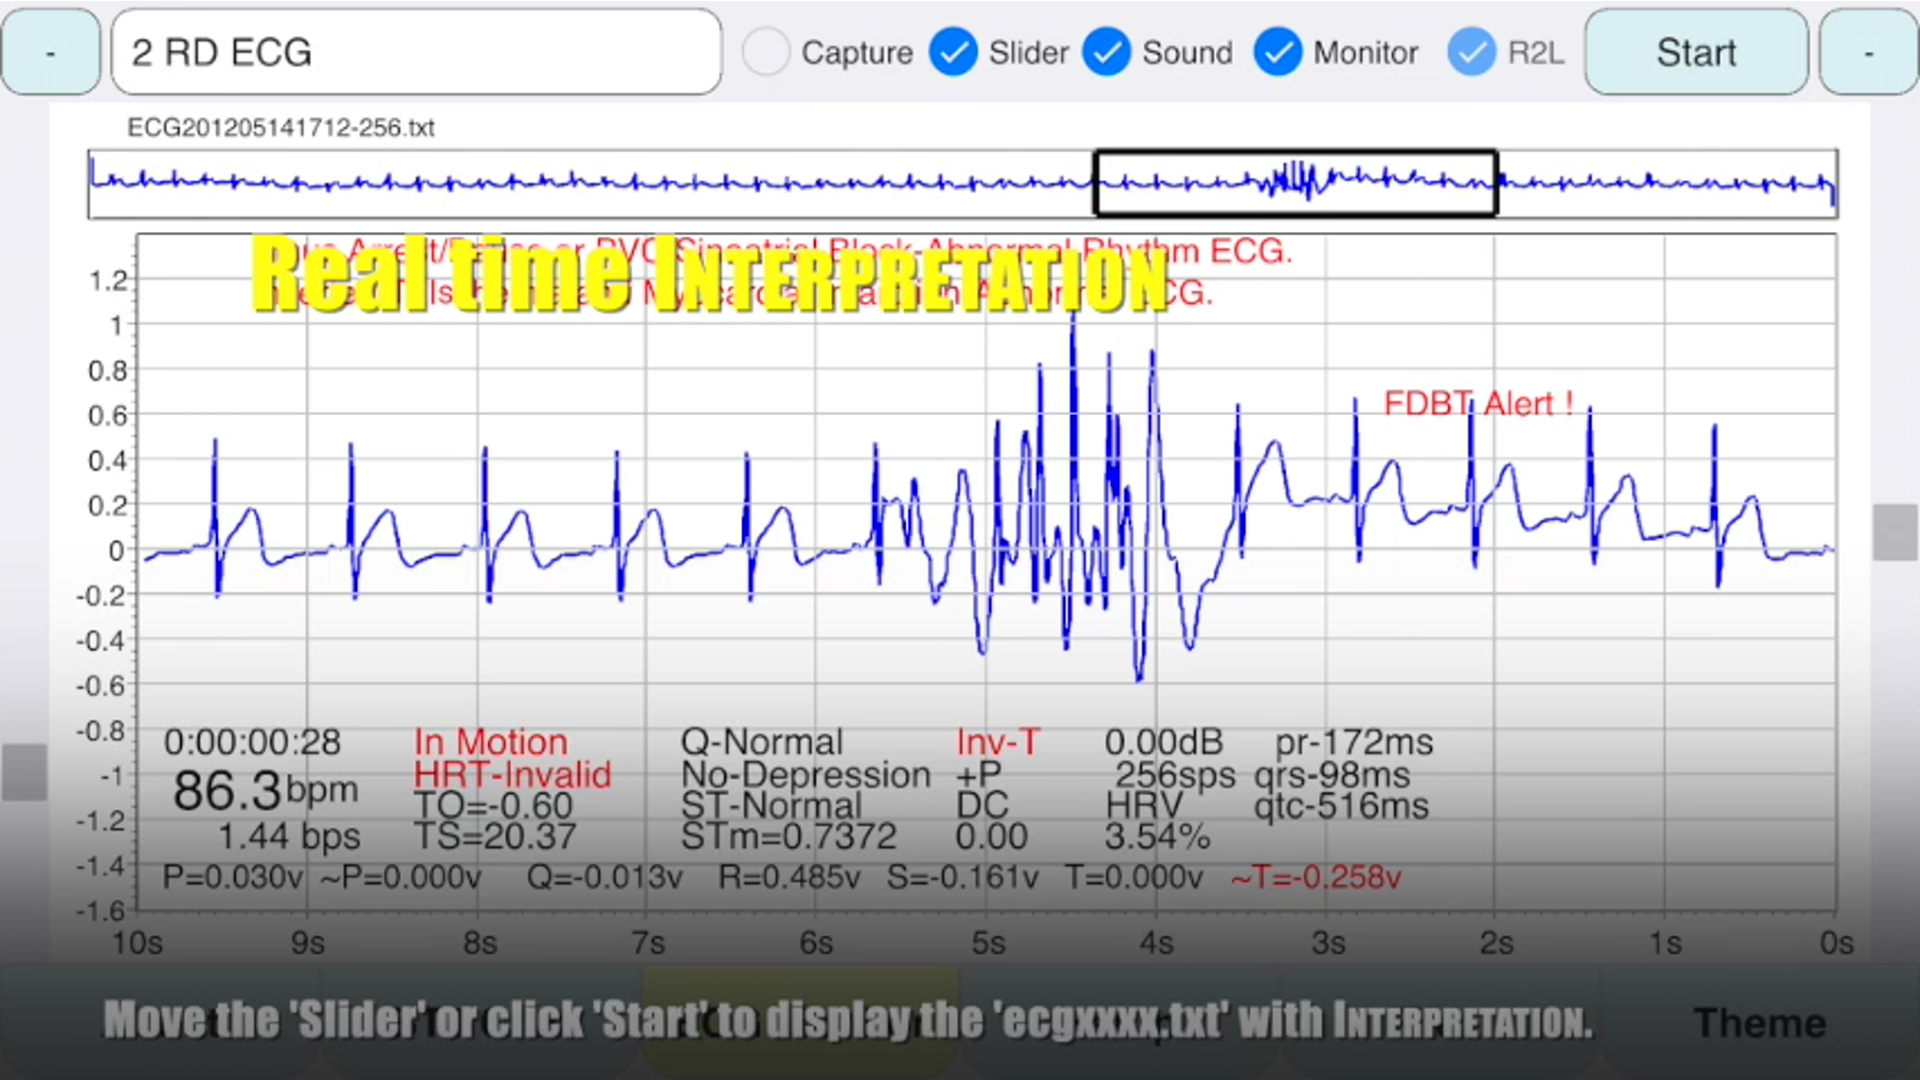
ecgMonitor Realtime Interpretation
January 2020
ecgMonitor Review
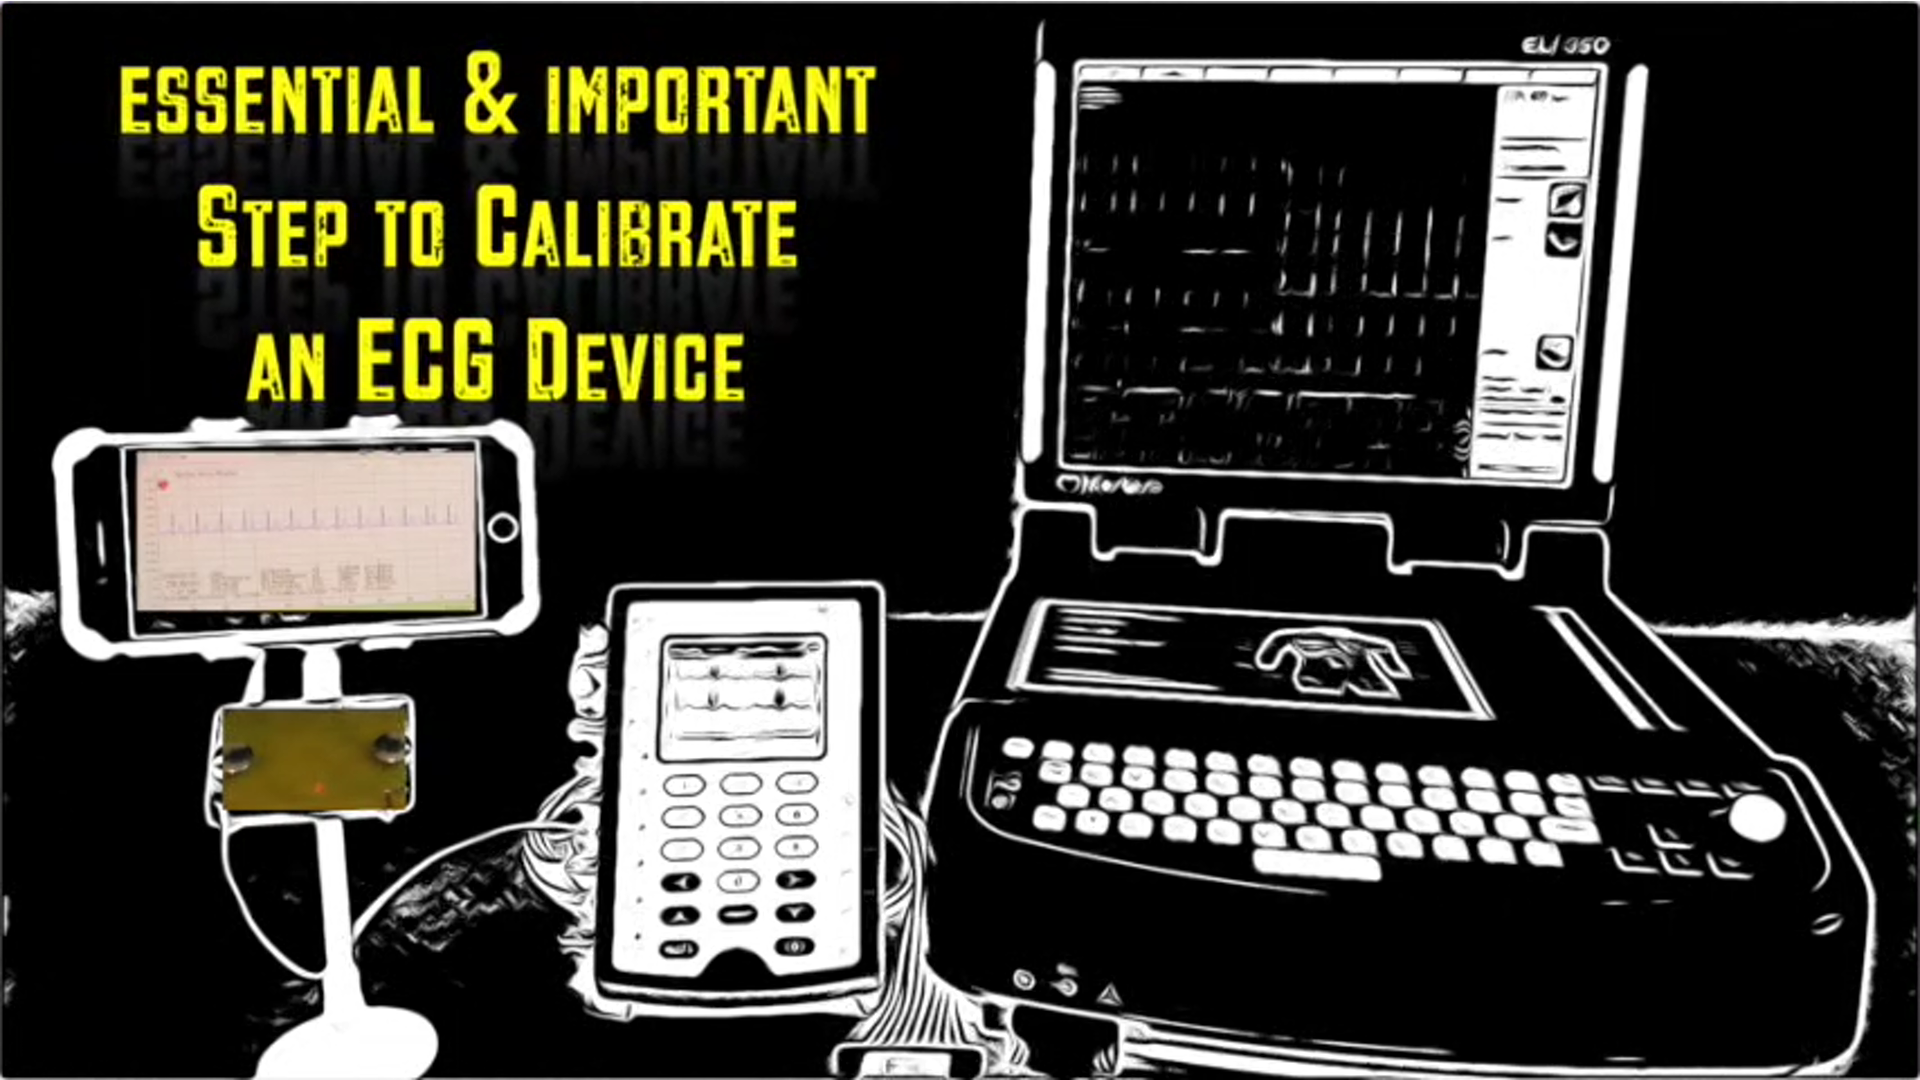
ecgMonitor vs 12 leads ECG Machine
Calibration
Essential & Important Step to Calibrate an ECG Device
ecgMonitor Review
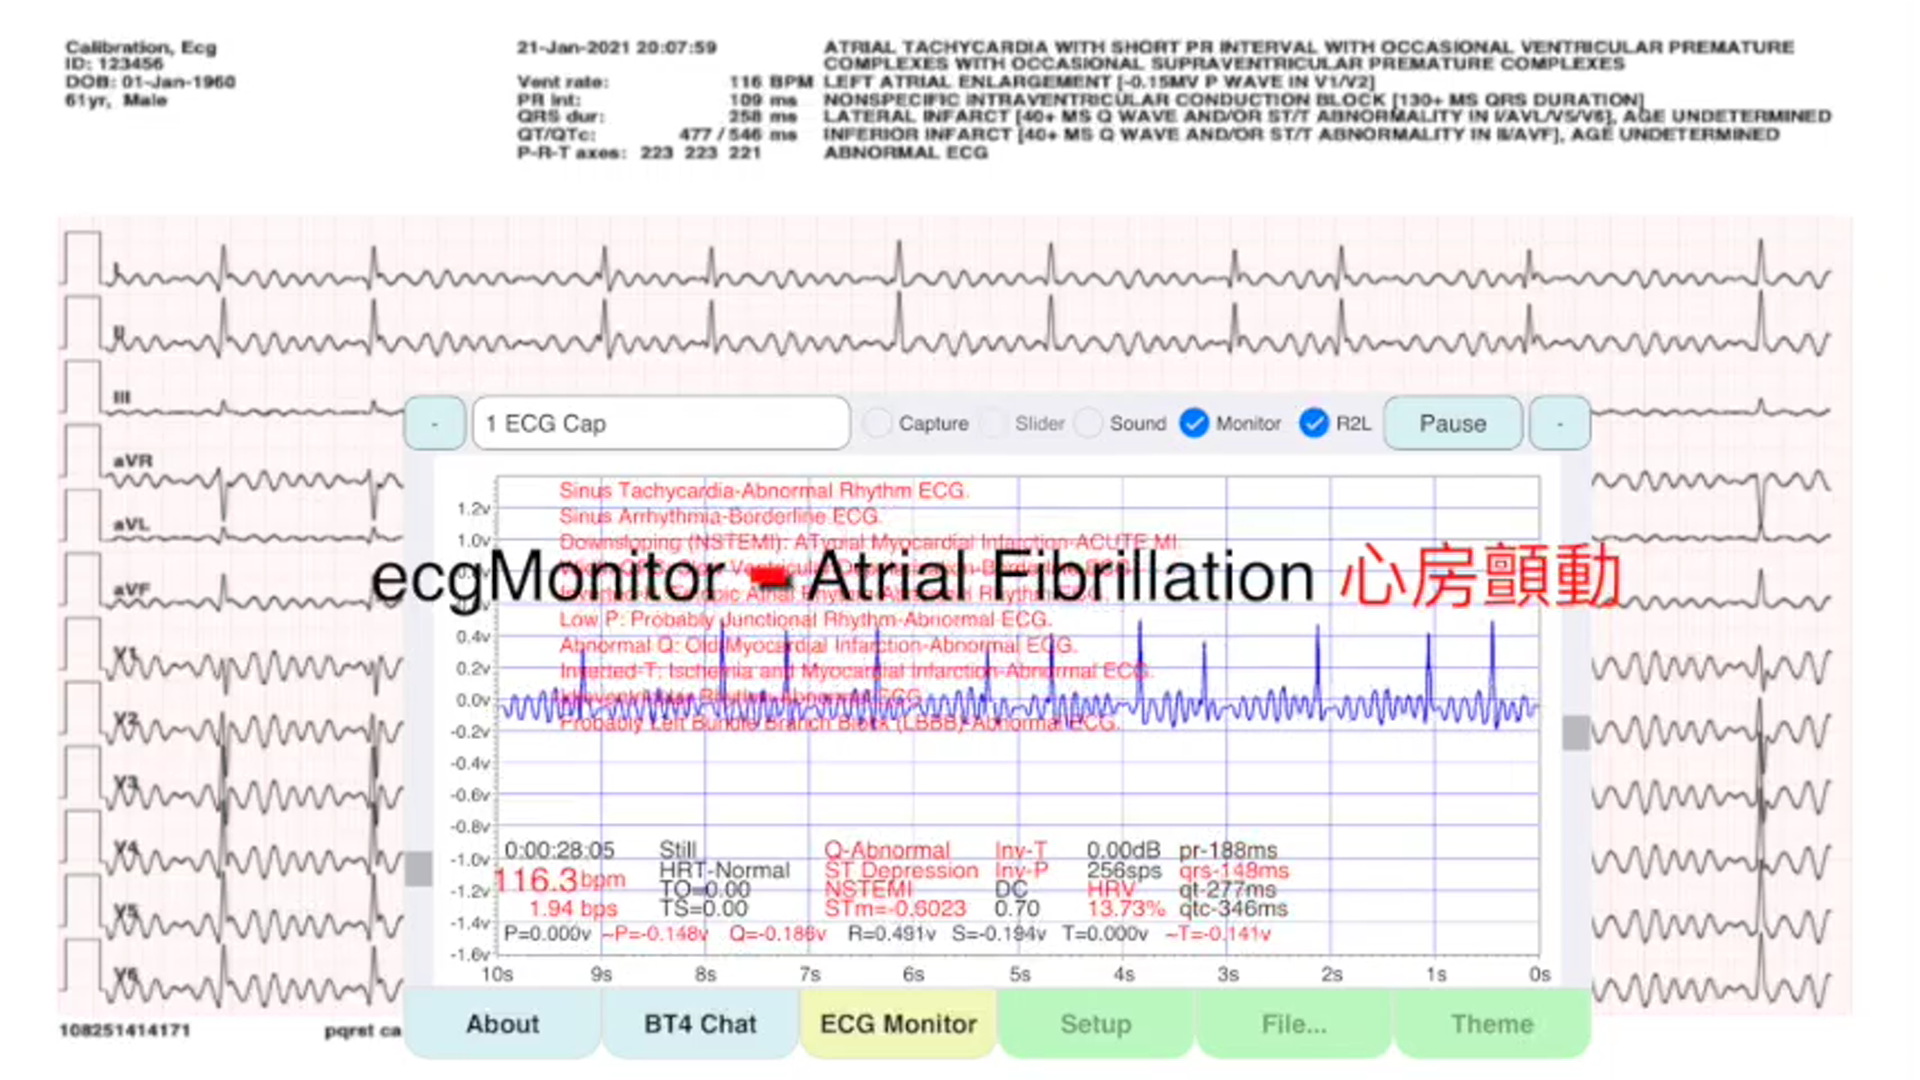
ecgMonitor Atrial Fibrillation
December 2019
ecgMonitor Real Time Measurement
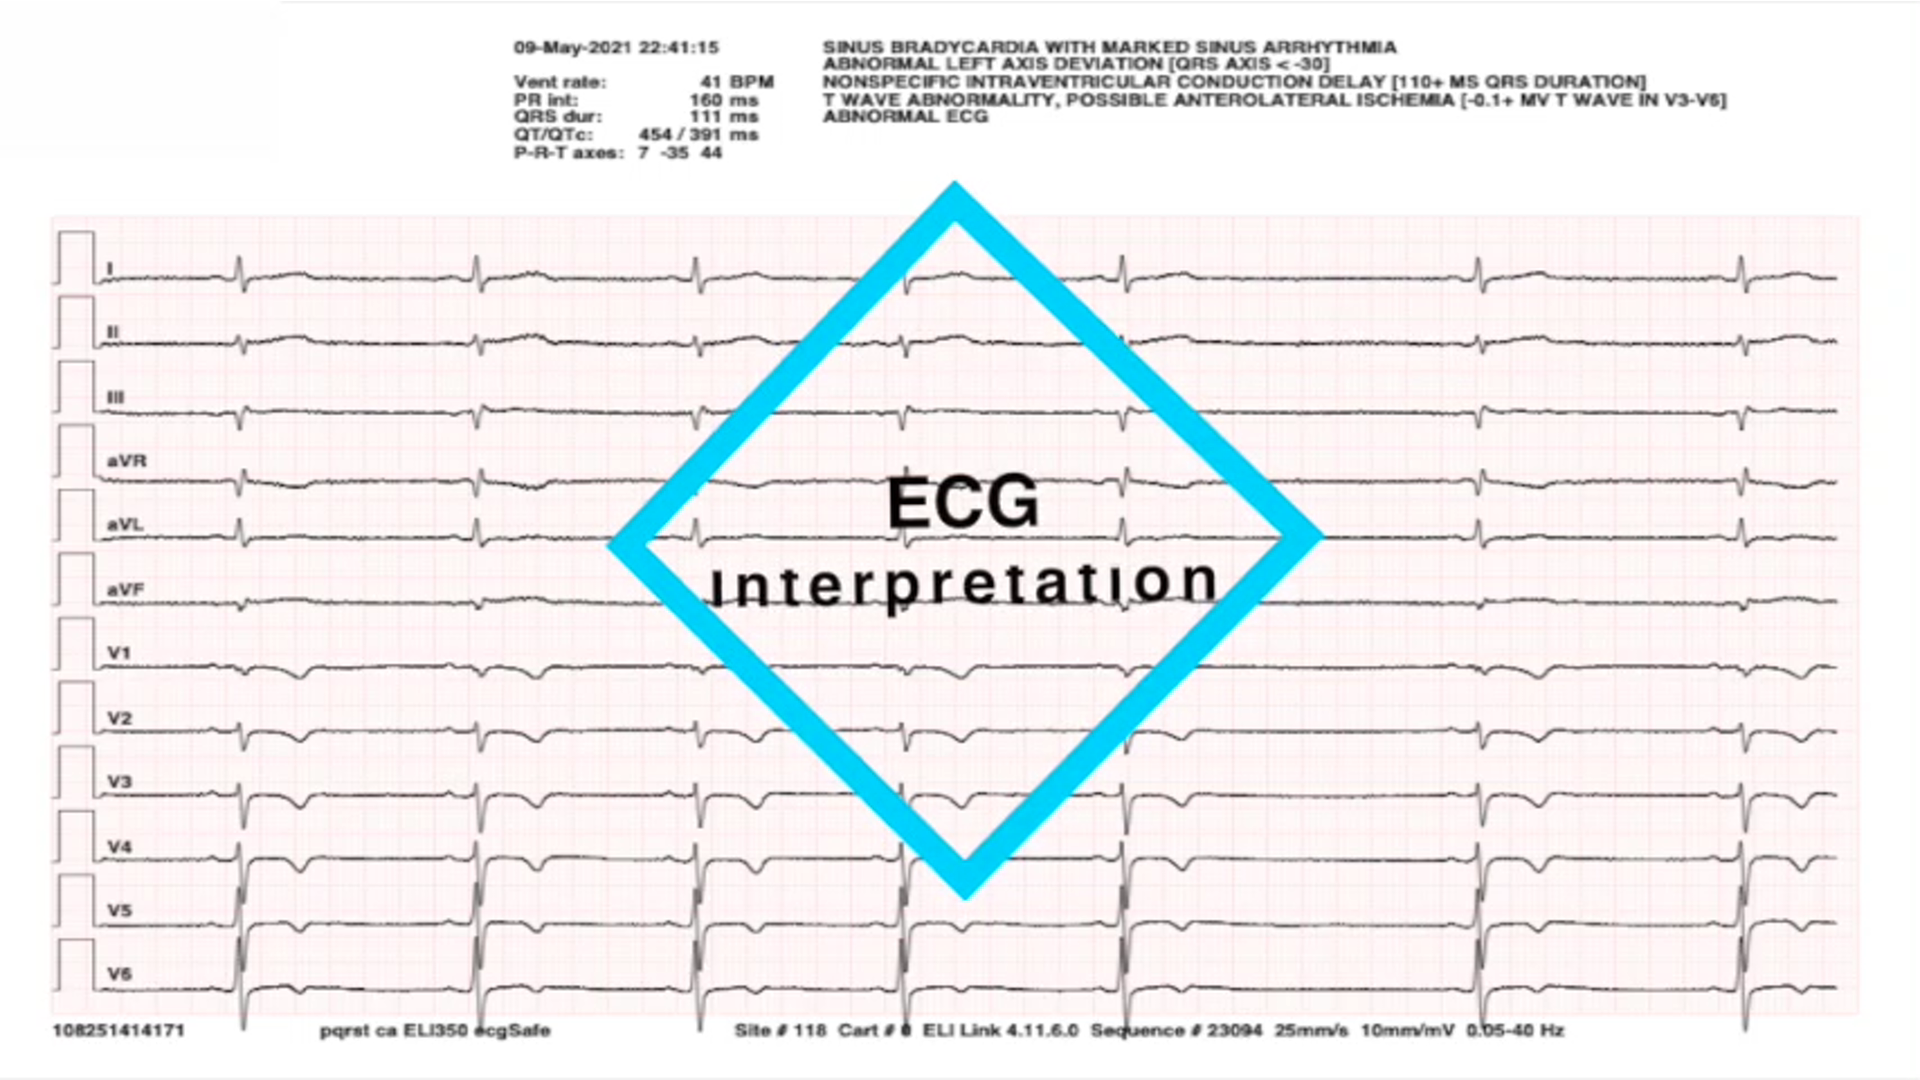
ecg Interpretation by 12 Leads ecg Machine
ecgMonitor Real Time Measurement
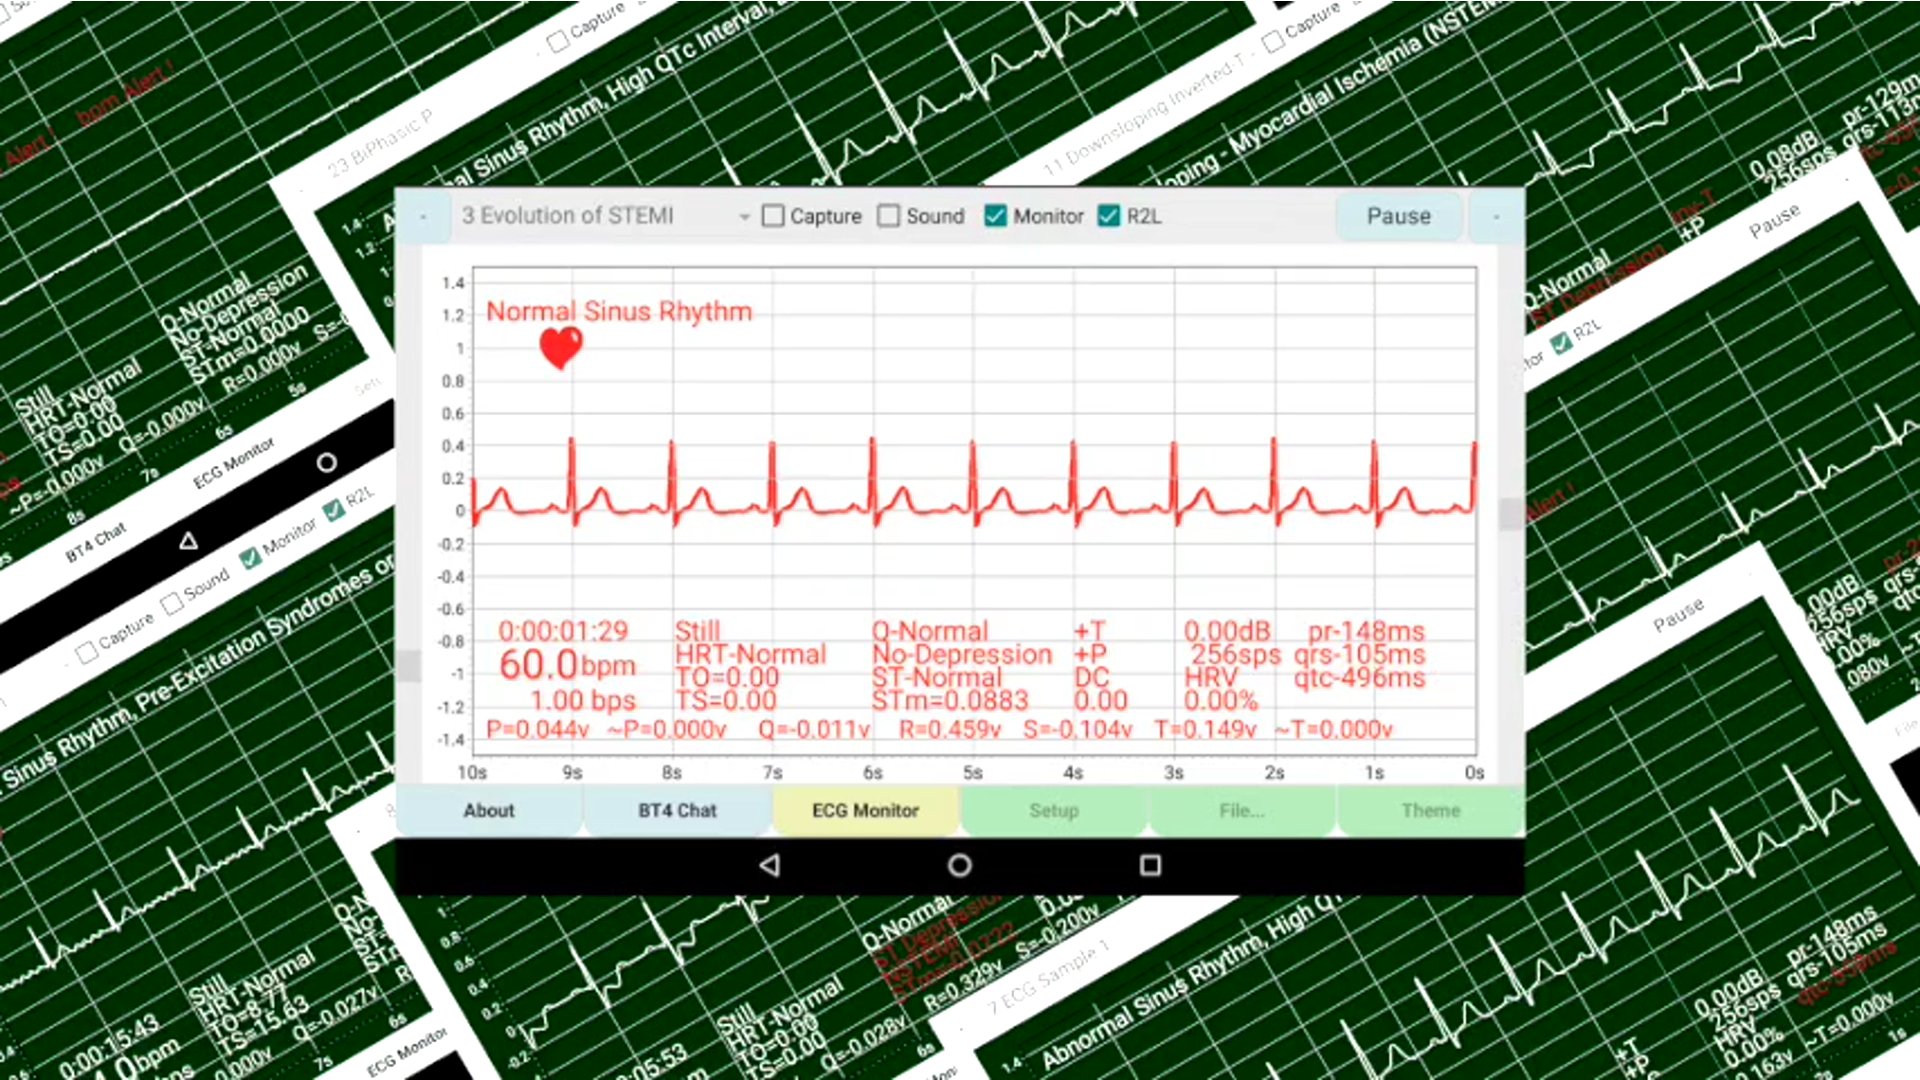
ecg Interpretation by ecgMonitor 40 Kinds of ECG/EKG Sinus Rhythm
November 2019
ecgMonitor All Times Trailer
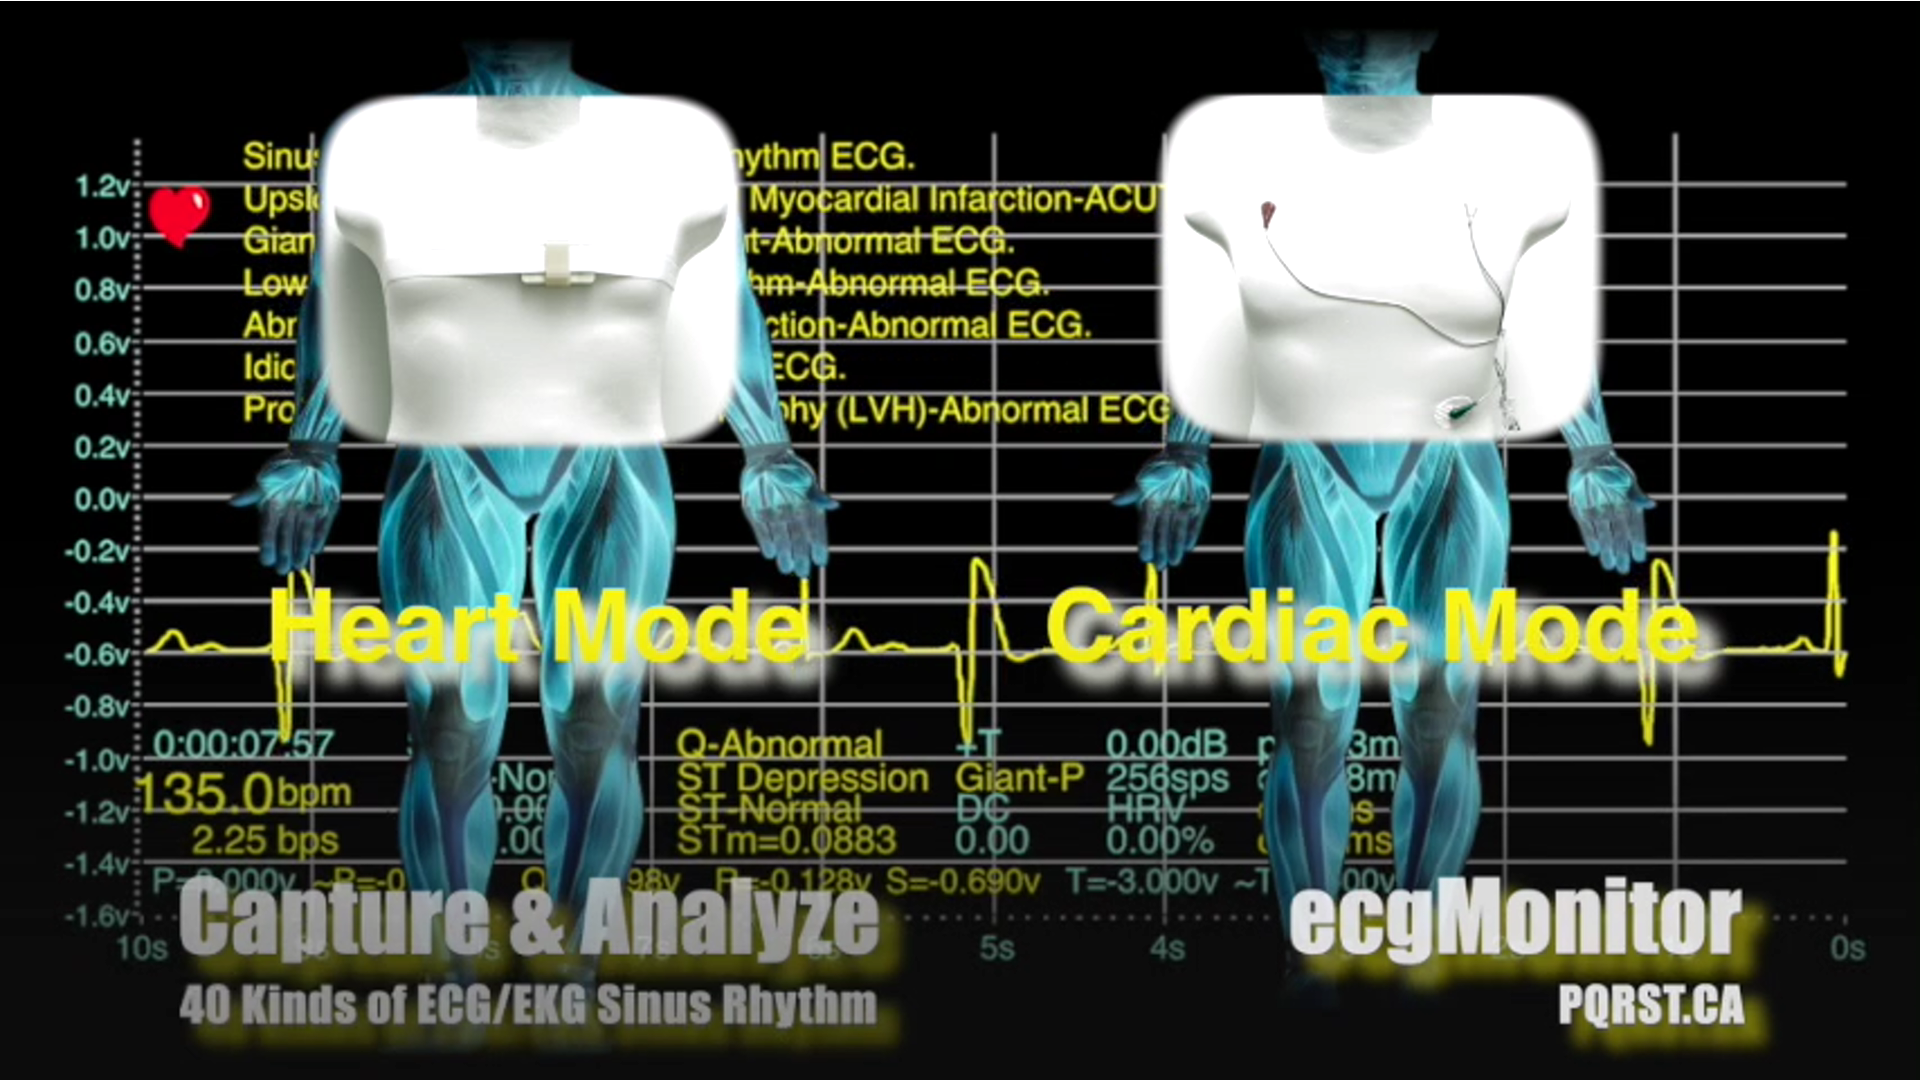
Heart and Cardiac Mode
ecgMonitor
PQRST.CA
Capture & Analyze
40 Kinds of ECG/EKG Sinus Rhythm
October 2019
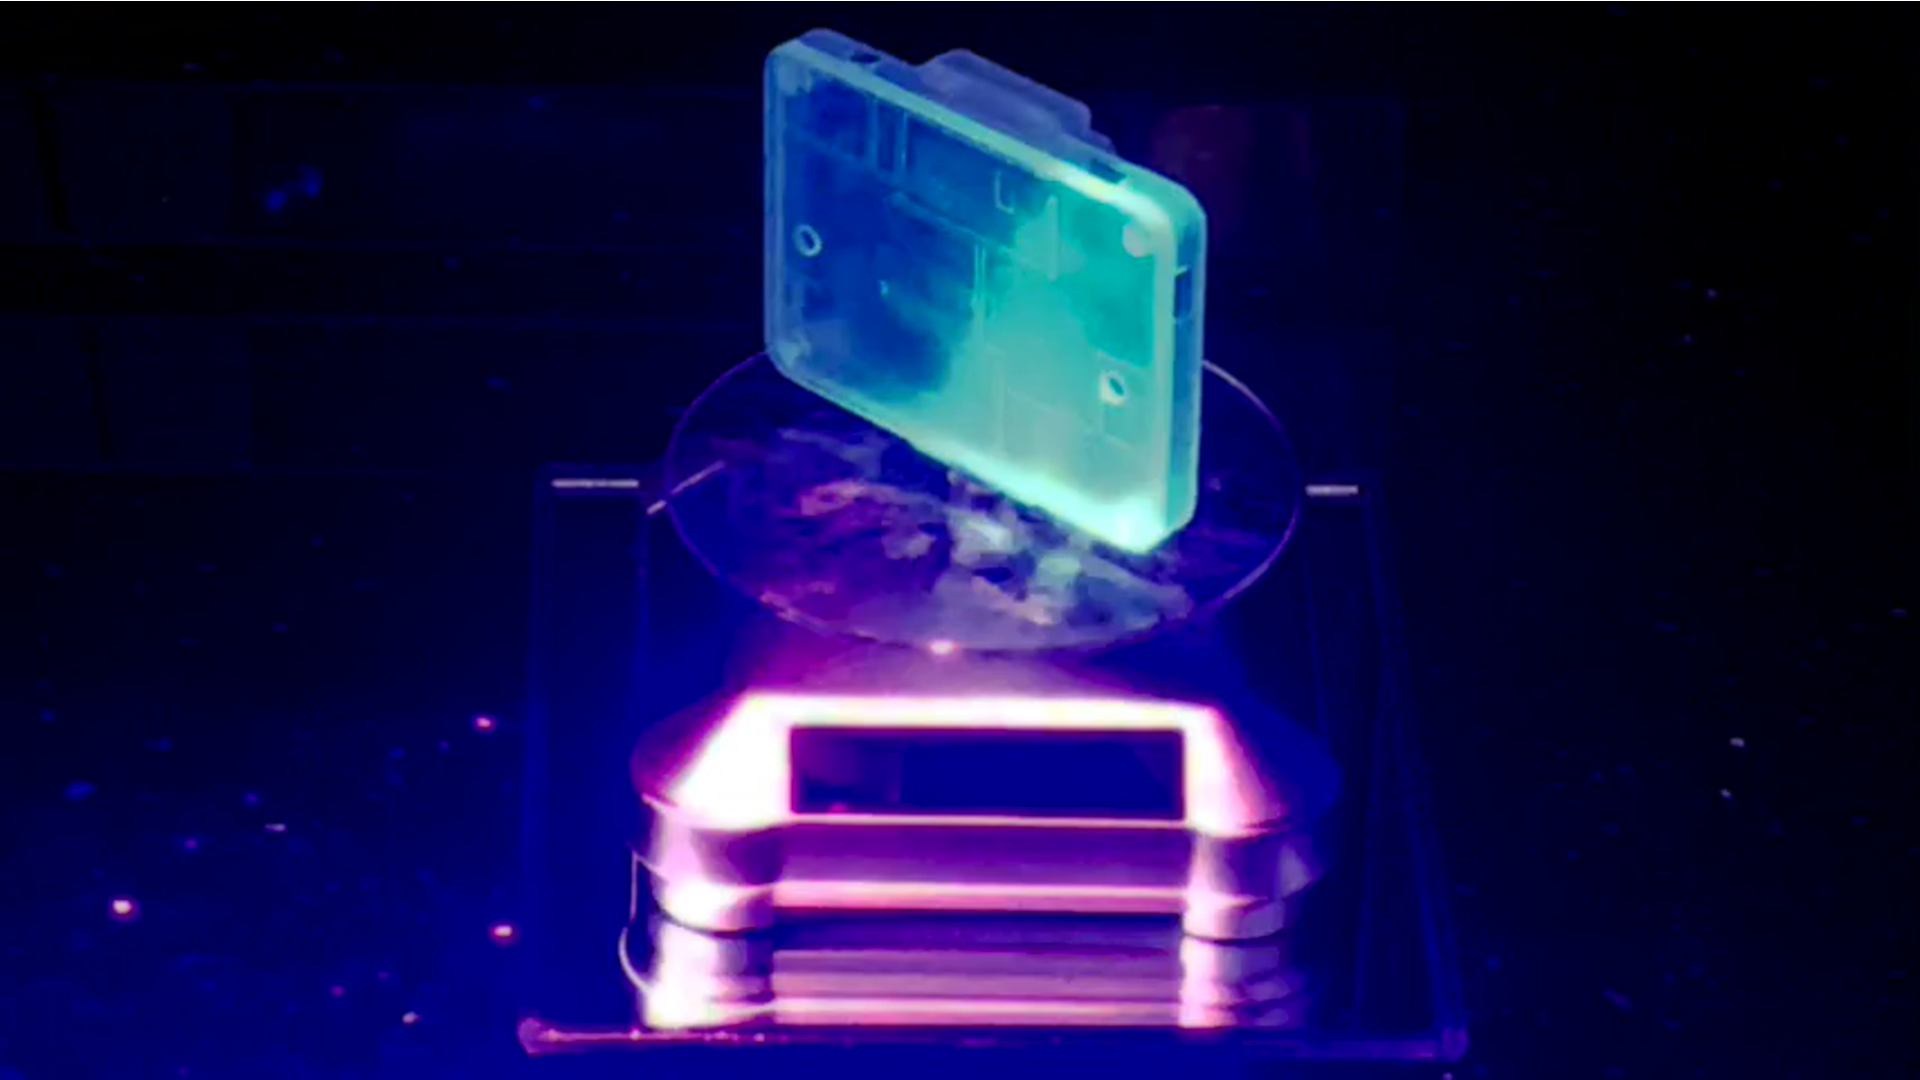
ecgMonitor Prototype UV 3D Printing
UV Curing after Stereolithography
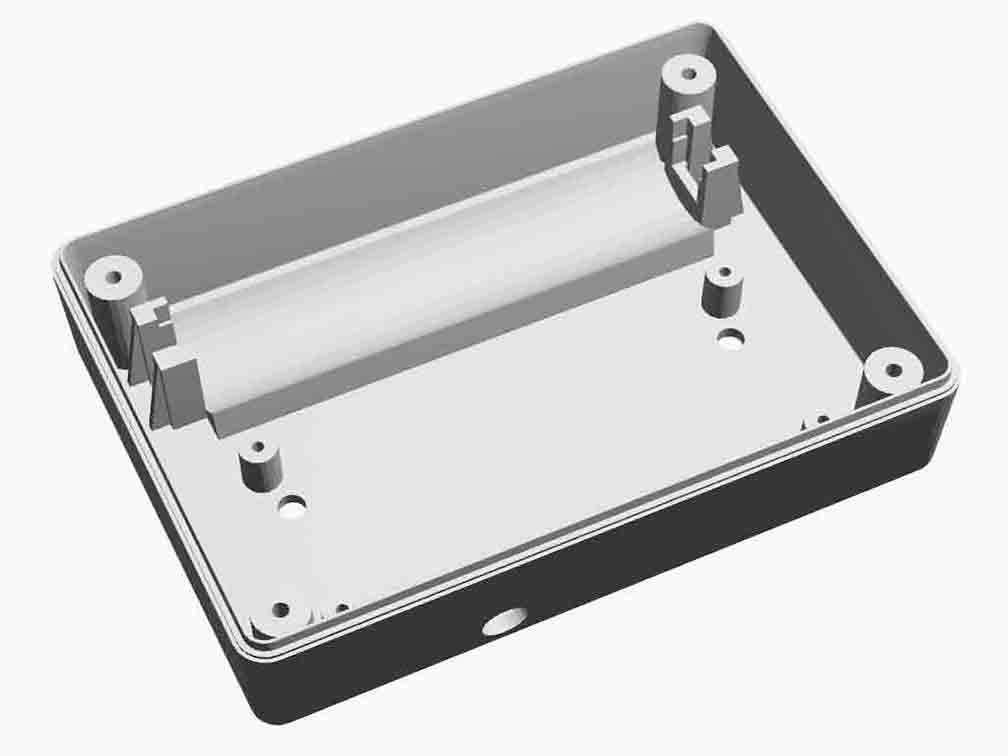
ecgMonitor Chassis Housing Case
ecgMonitor Prototype UV 3D Printing
ecgMonitor Testing – iPhone 7 Plus
September 2019
ecg Interpretation
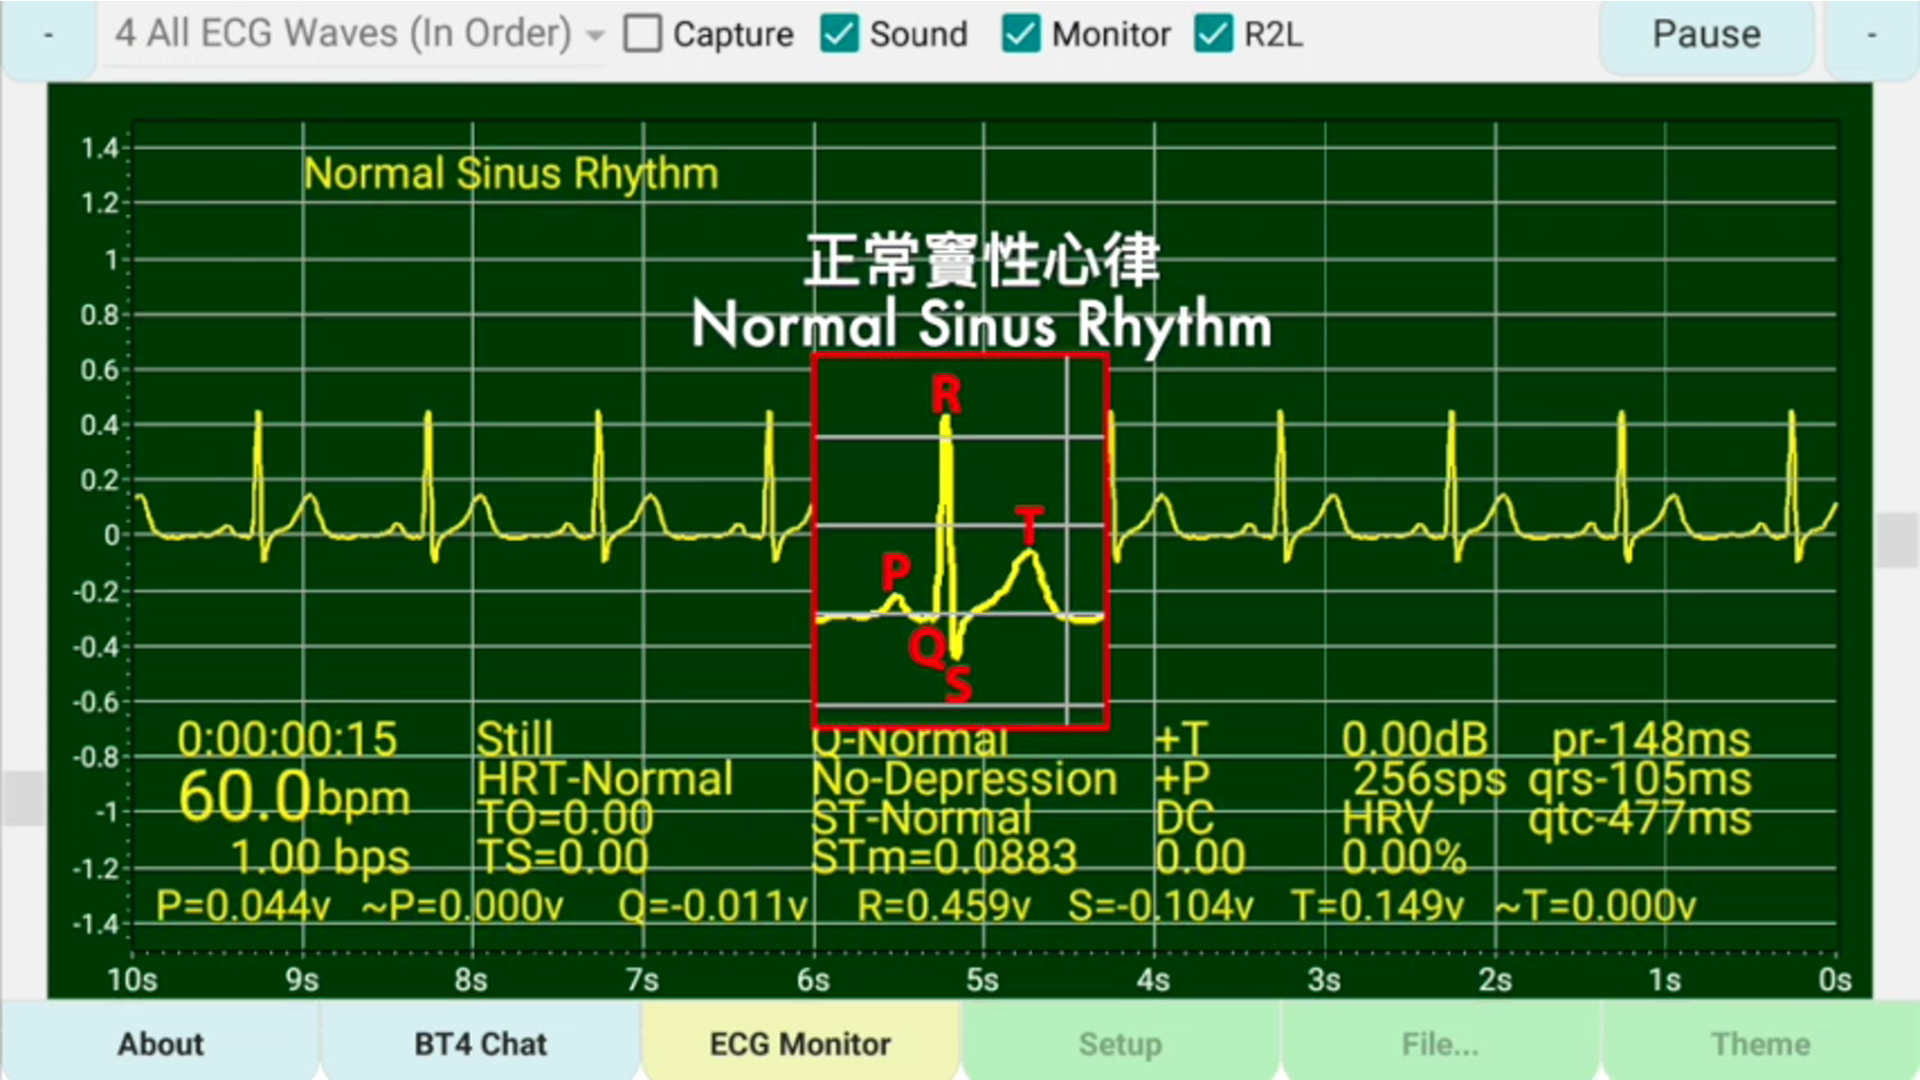
ecgMonitor detect Normal Sinus Rhythm
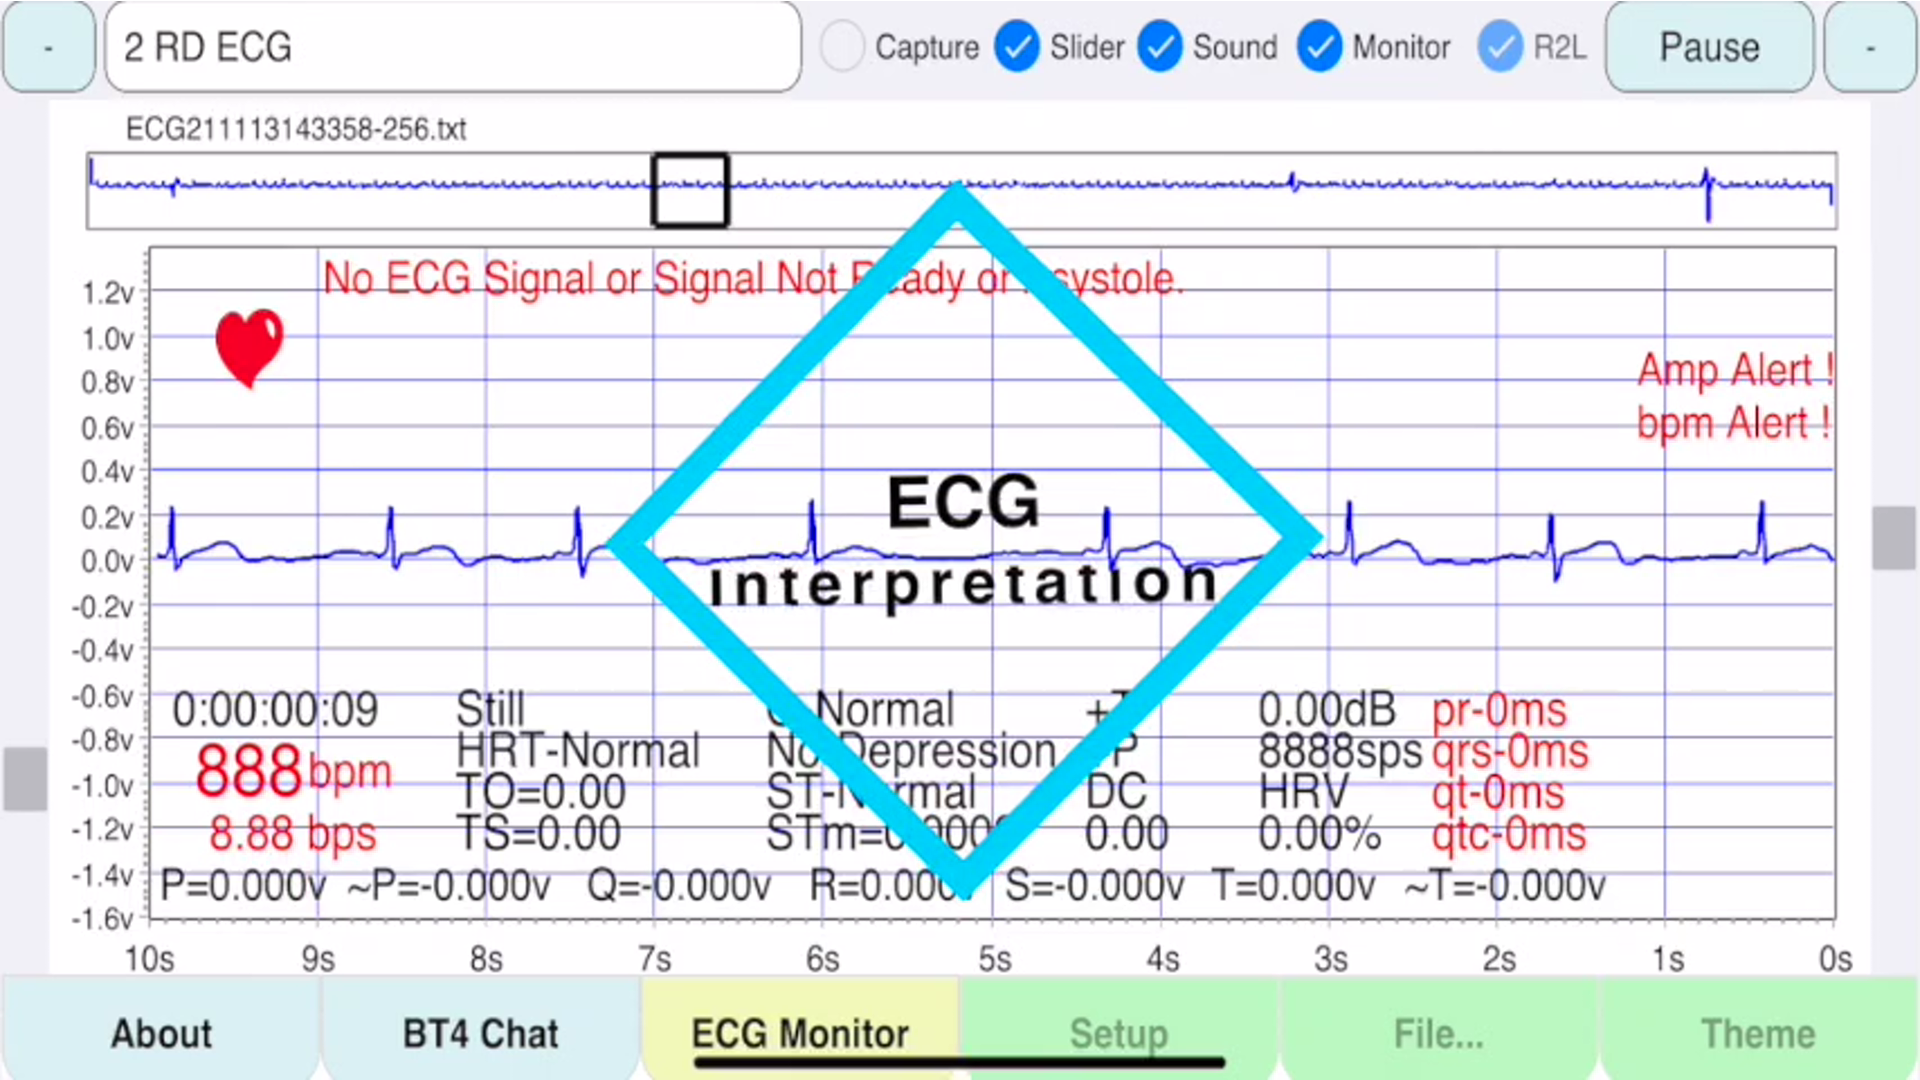
ecg Interpretation
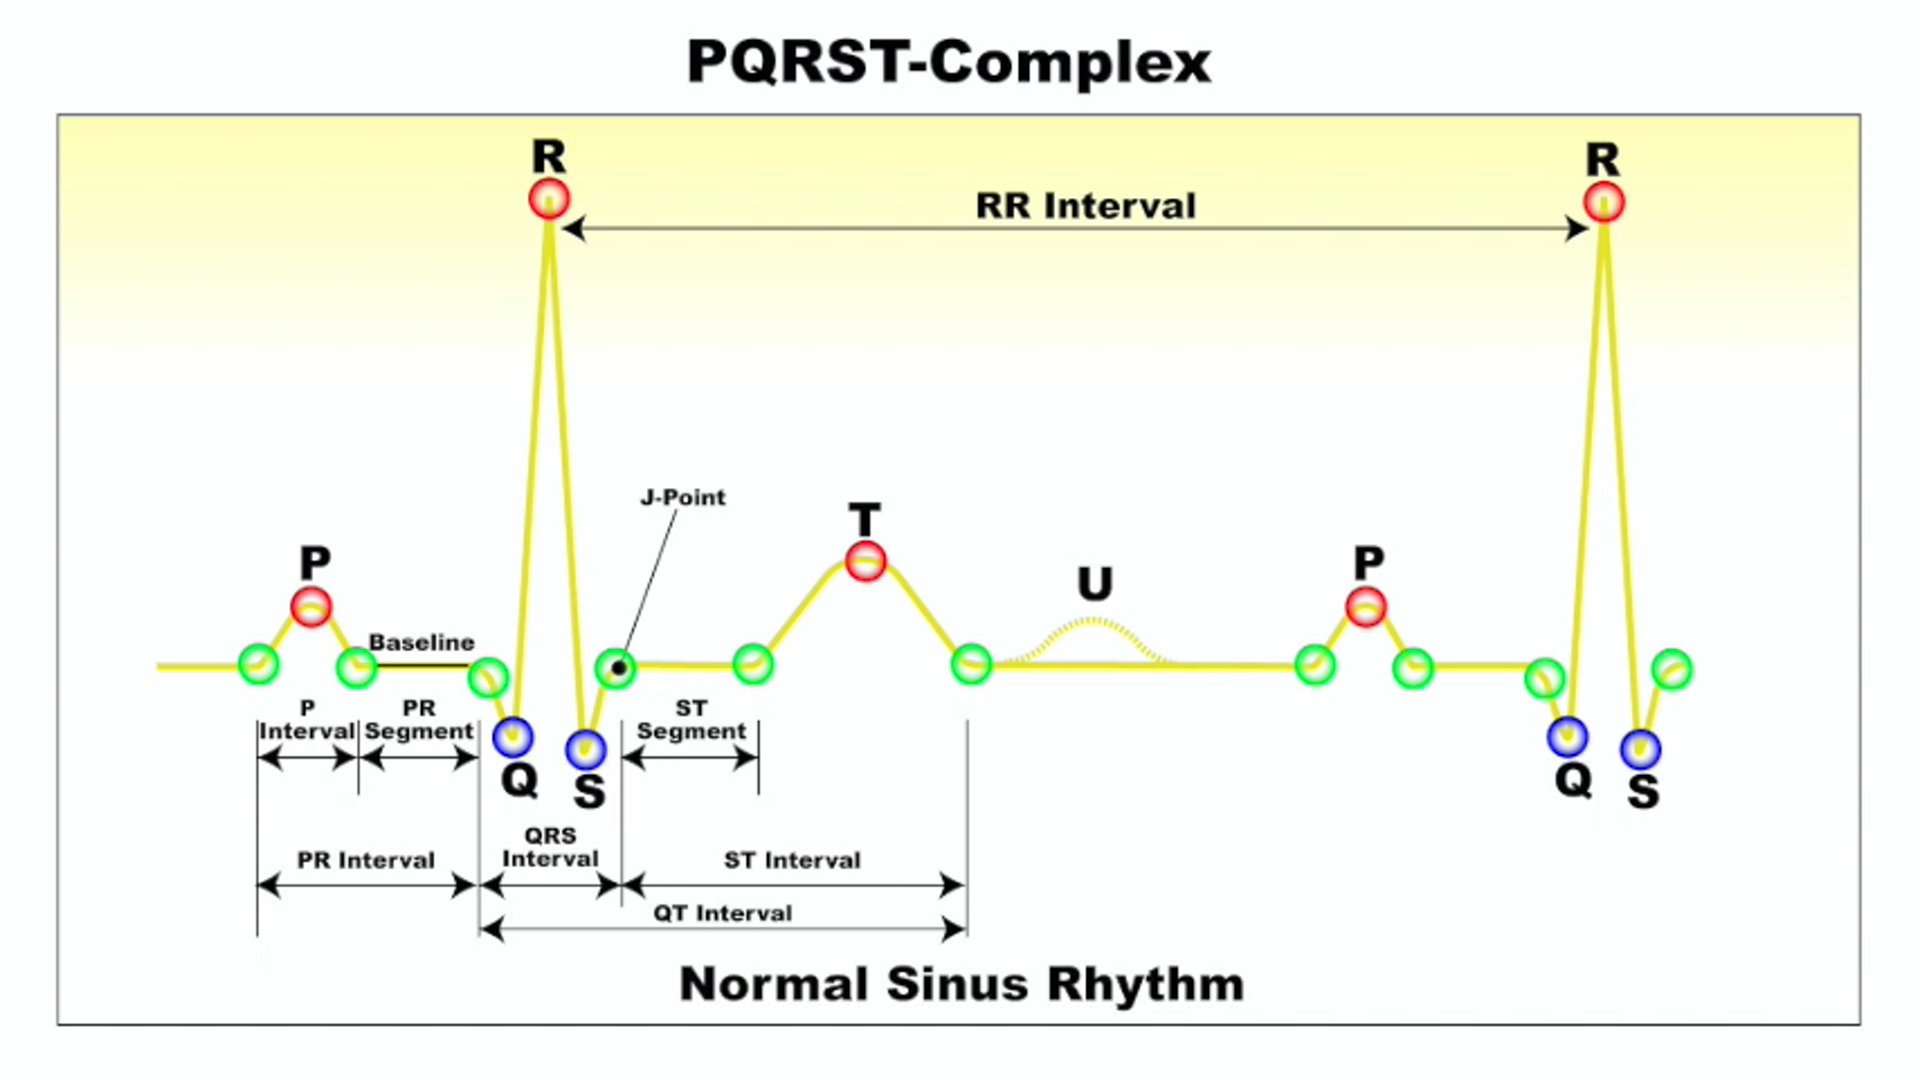
PQRST Complex-Normal Sinus Rhythm by ecgMonitor
August 2019
ecgMonitor 10 Years Journey (Part 3)
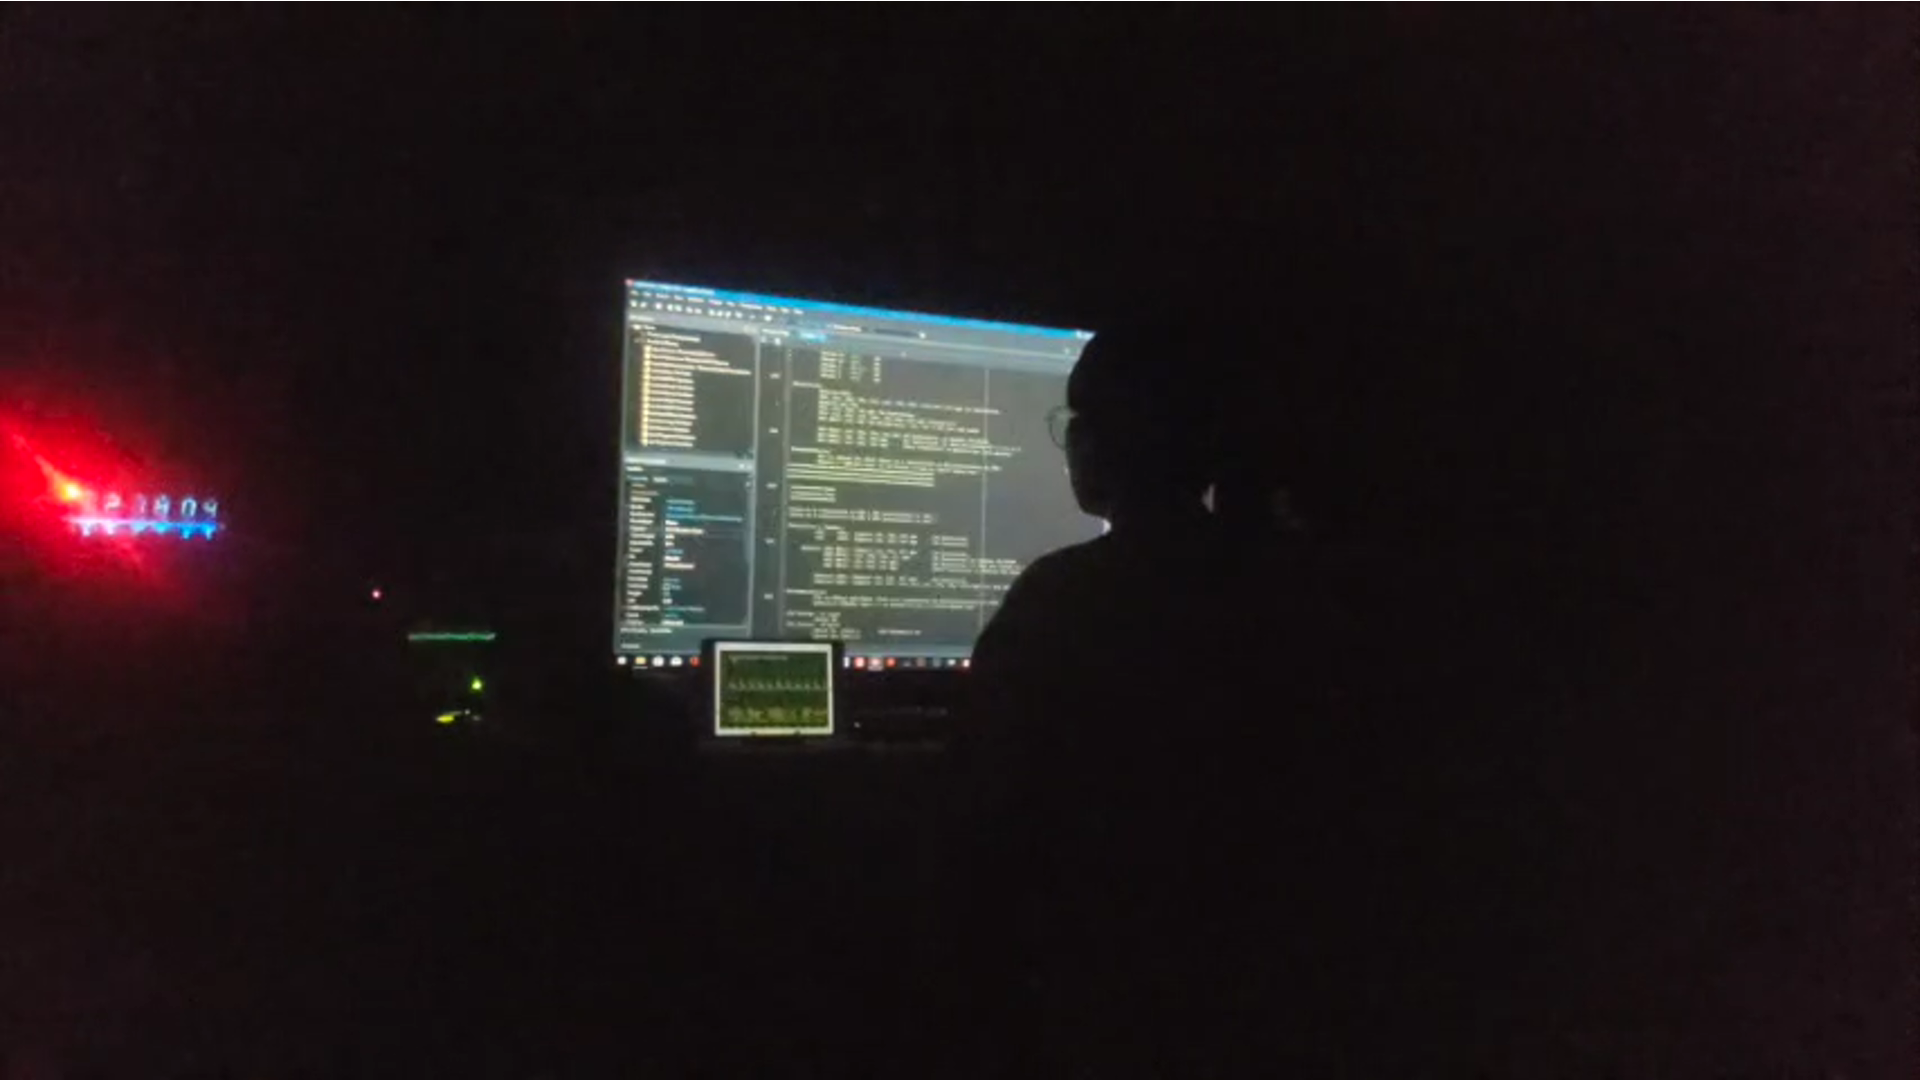
In The Dark Working Software Programming
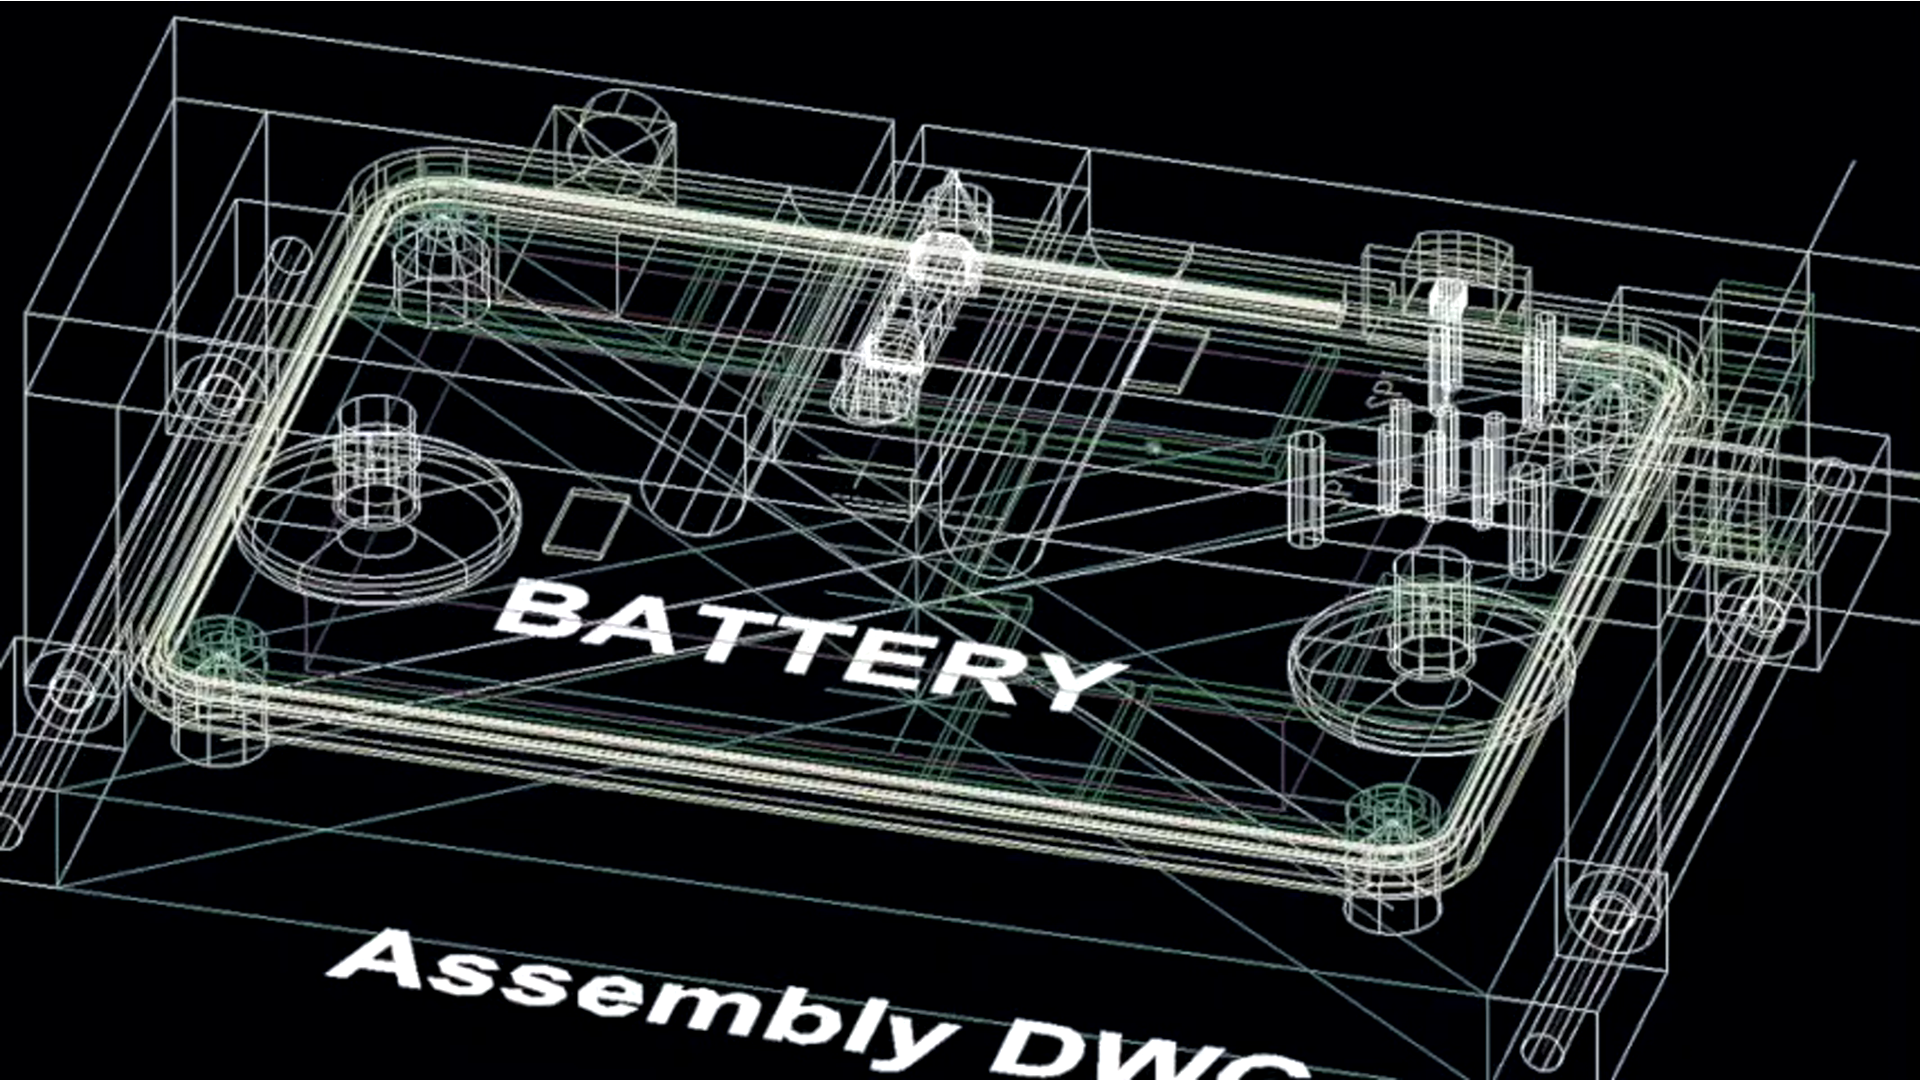
ecgMonitor 10 Years Journey (Part 3)
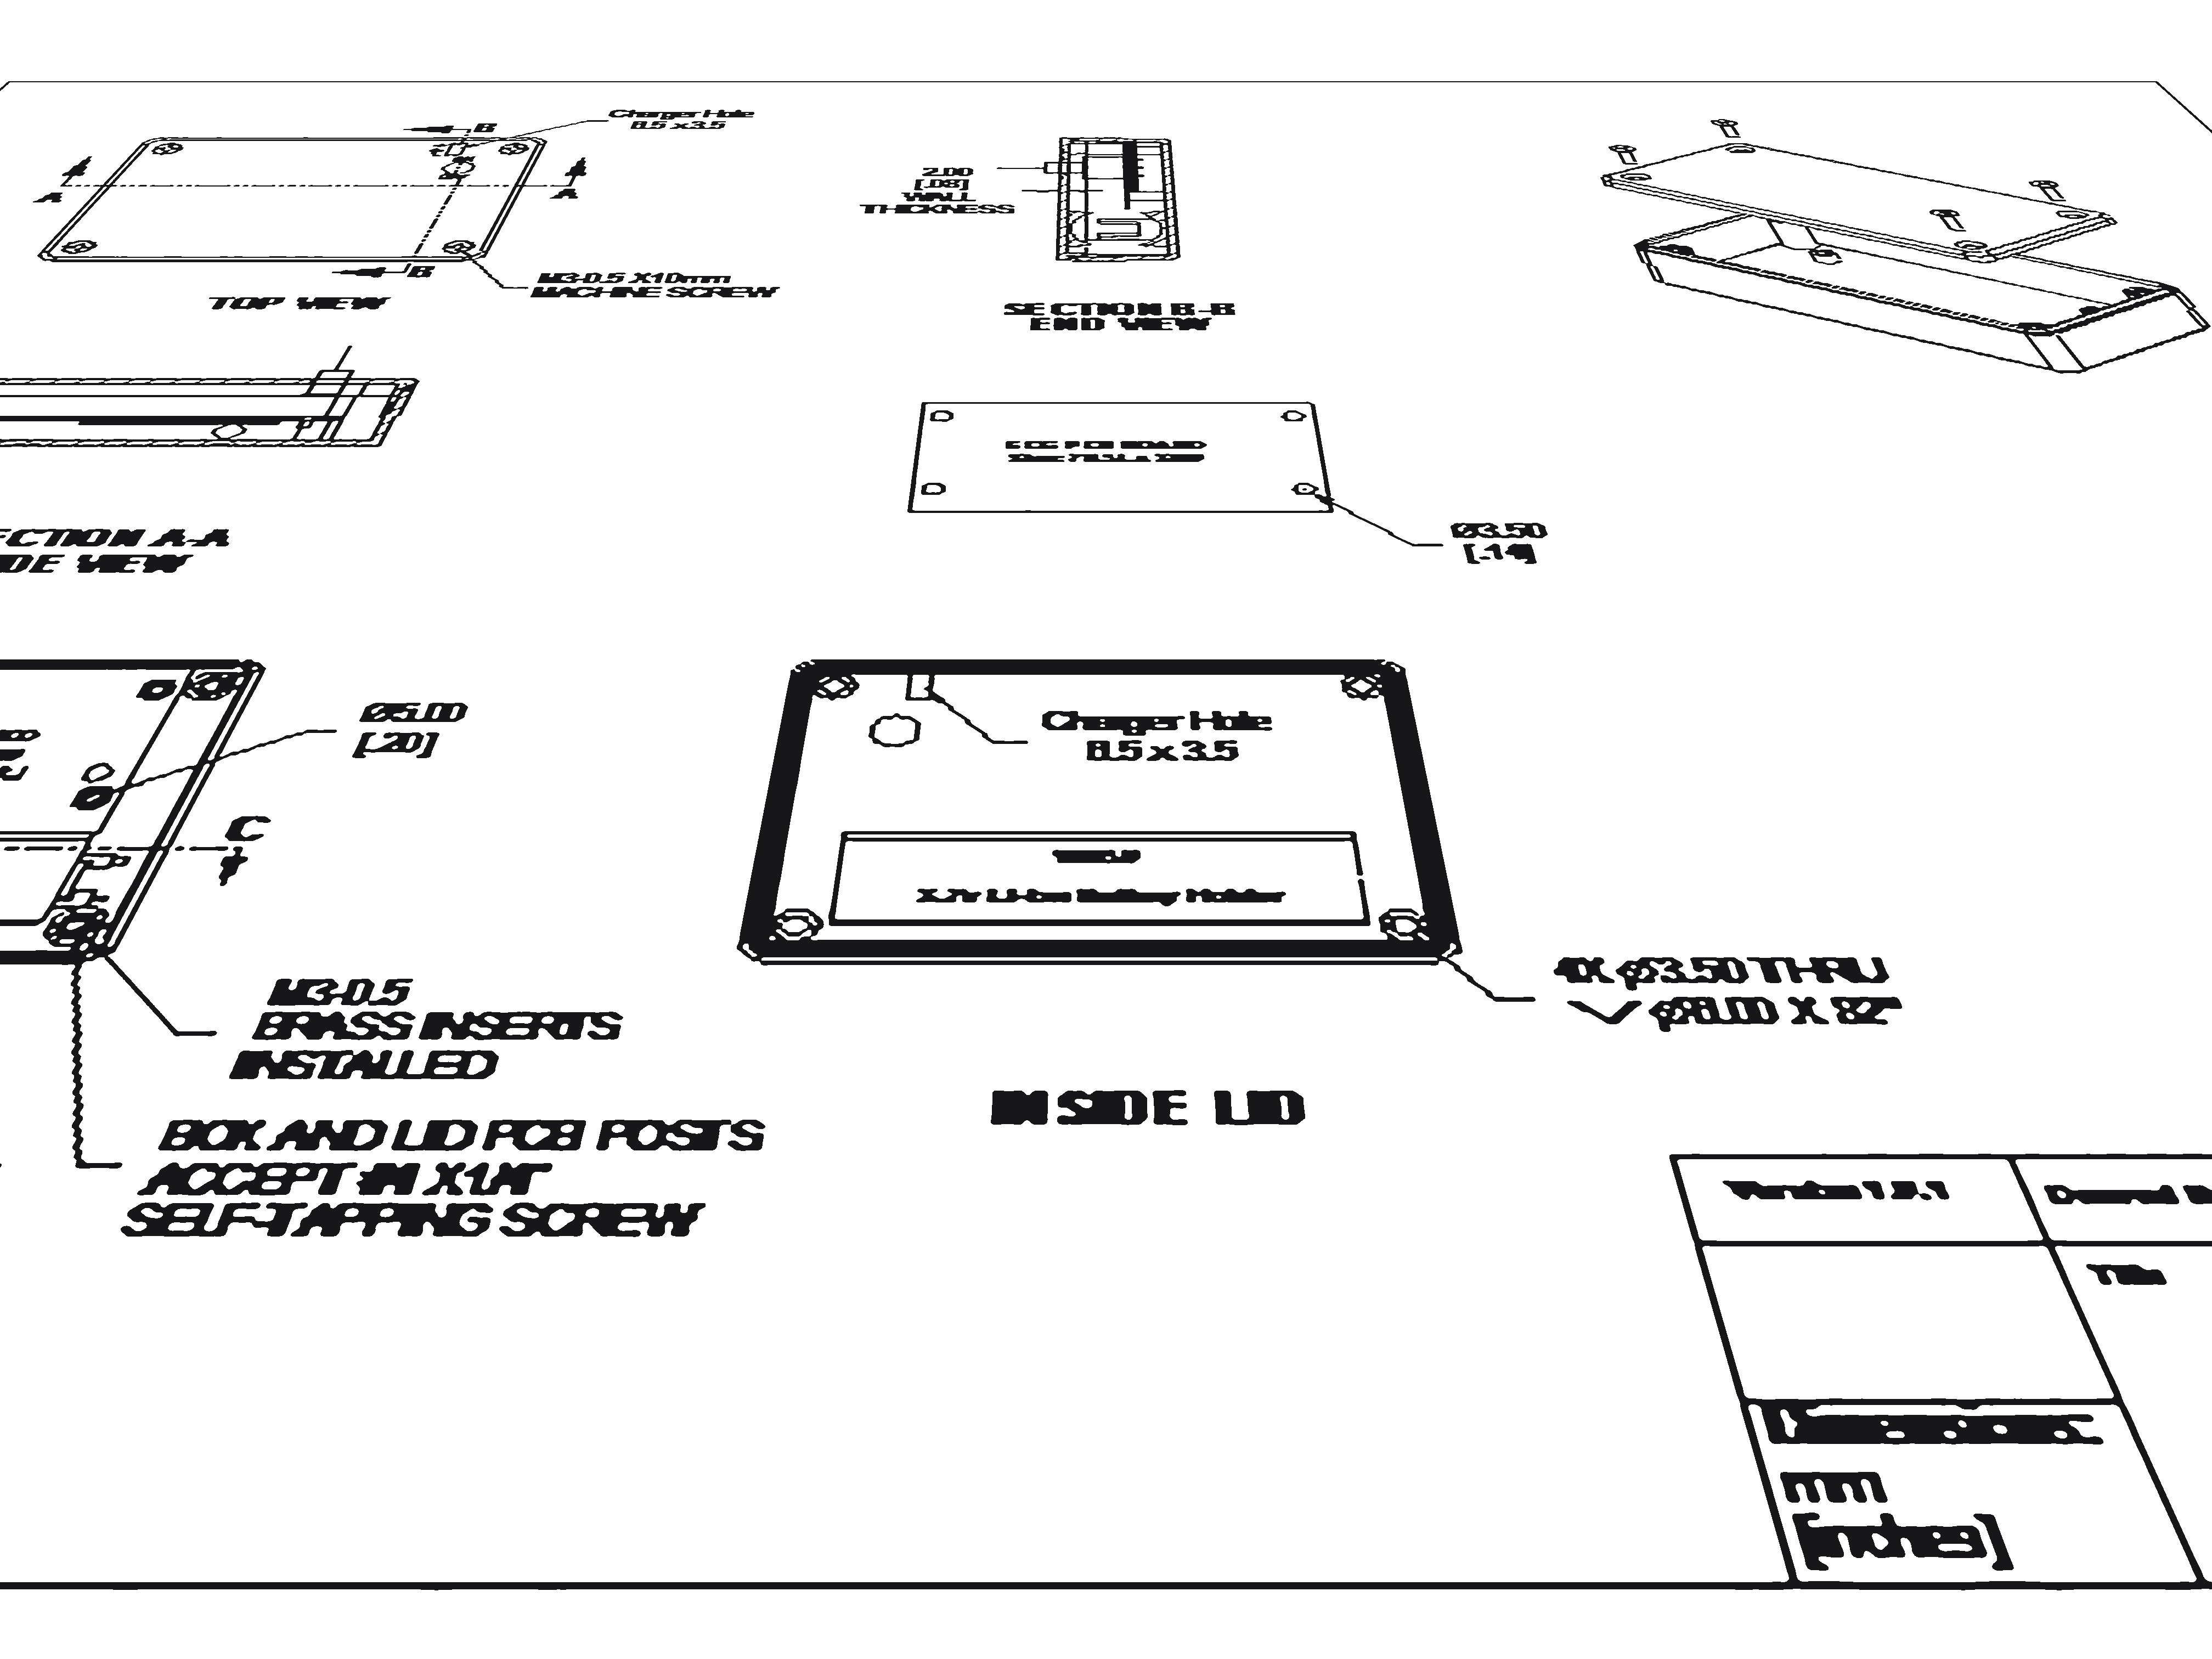
AutoCAD Drawing of ecgMonitor Programmer
July 2019
ecgMonitor 10 Years Journey (Part 2)
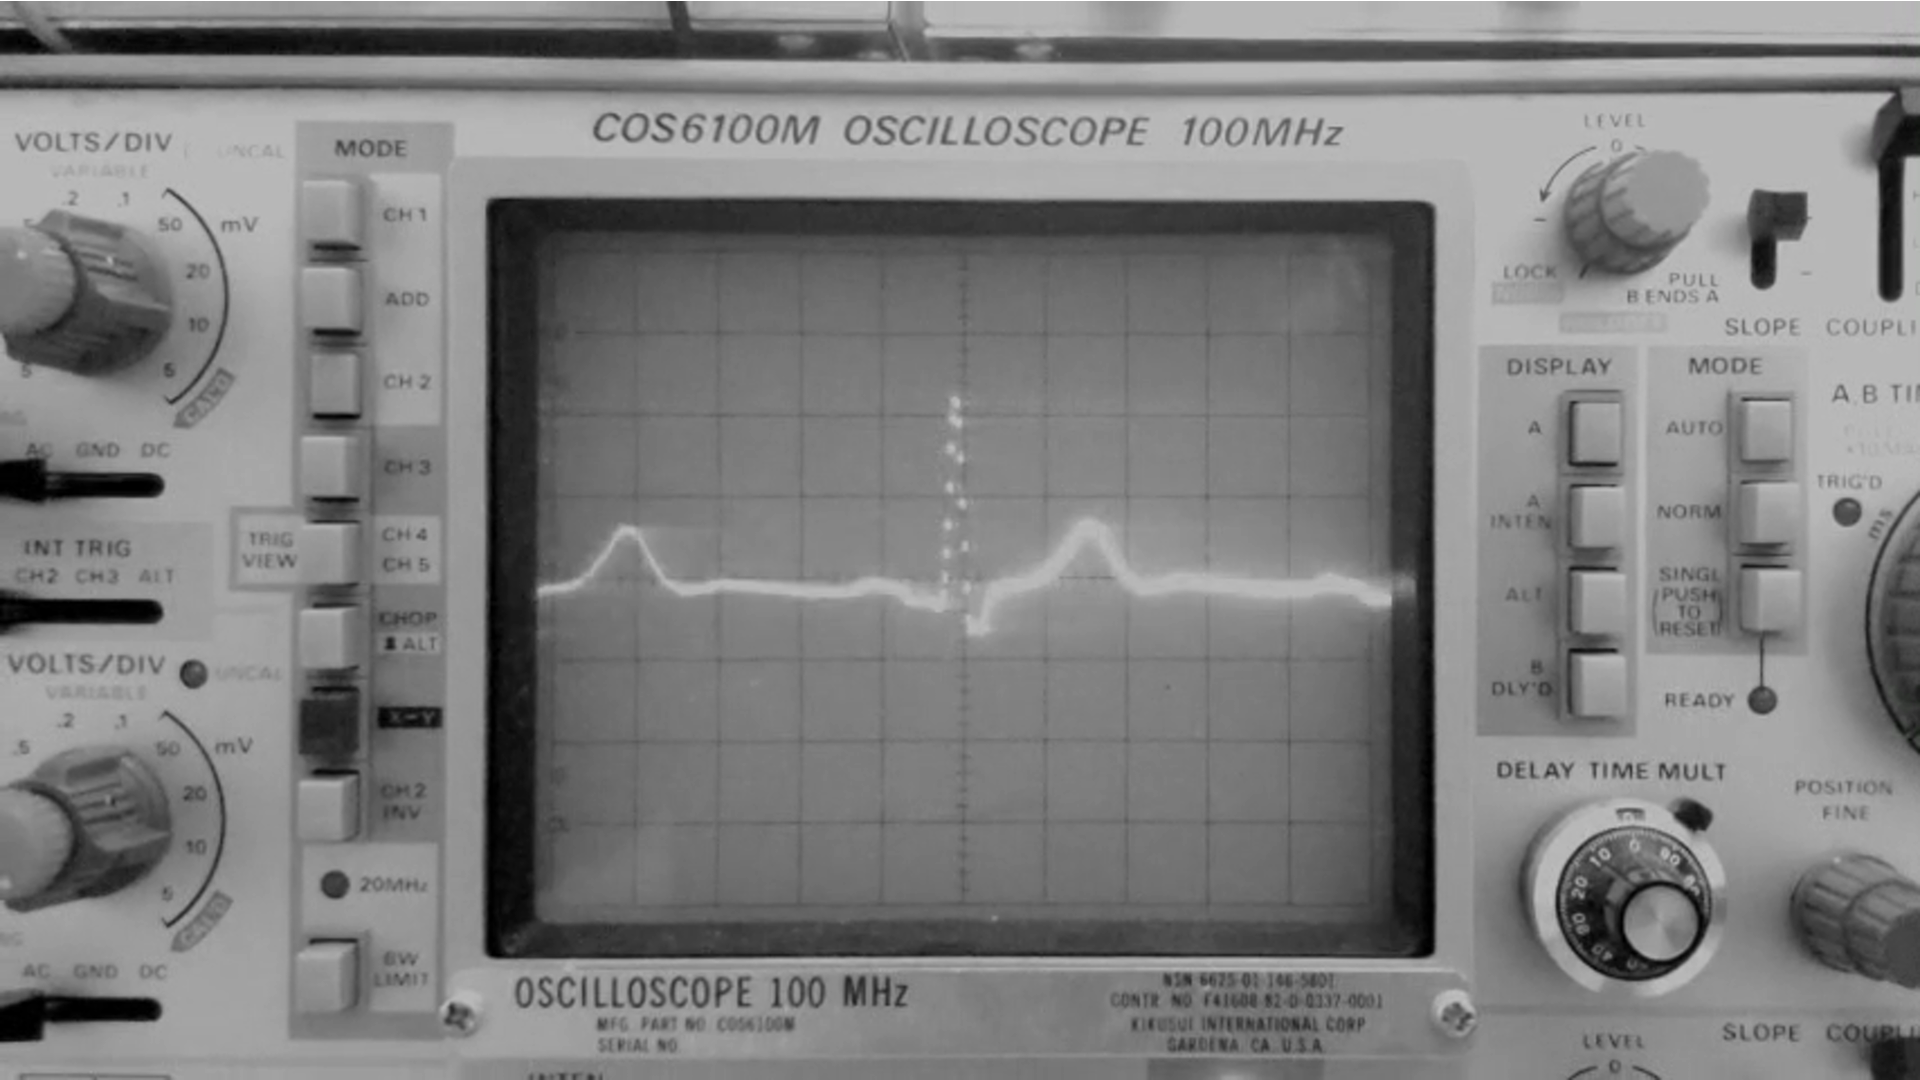
PQRST Complex on Oscilloscope
ecgMonitor 10 Years Journey (Part 2)
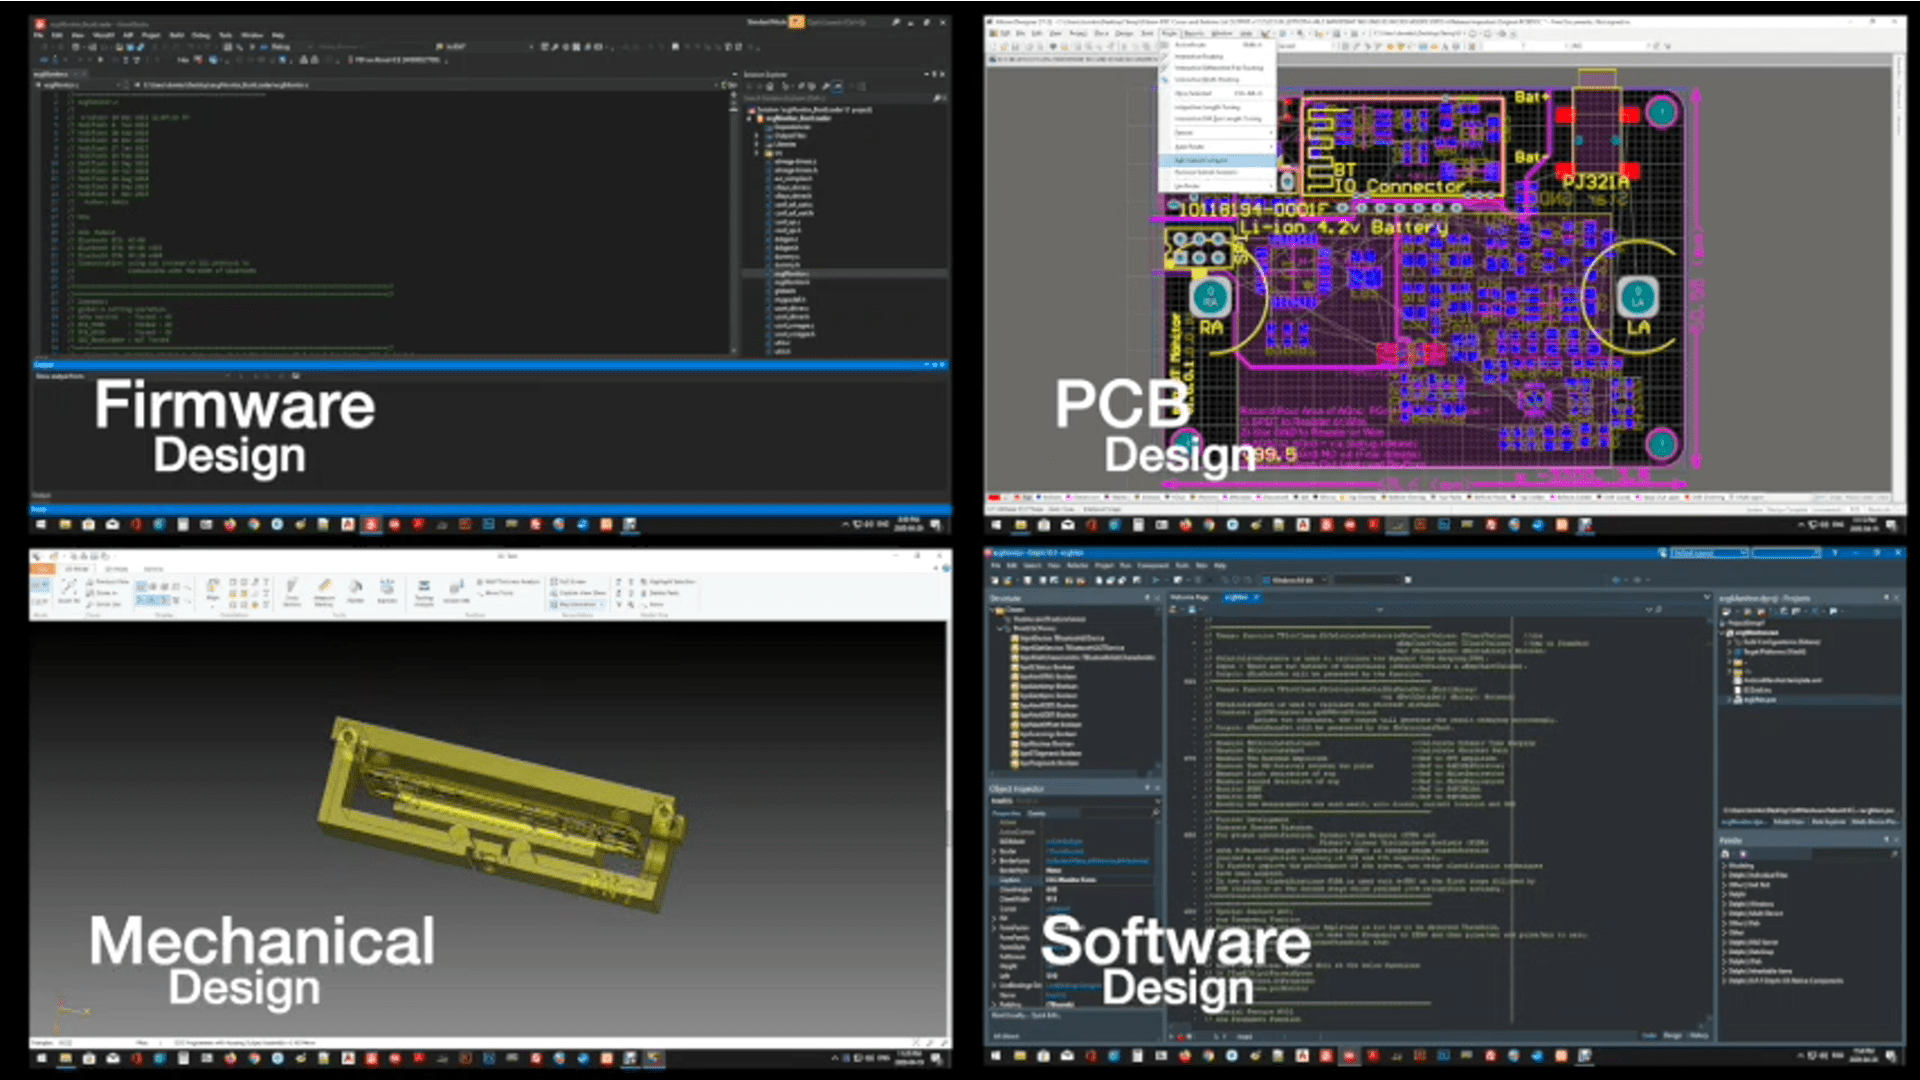
Software Firmware Mechanical PCB Design
June 2019
ecgMonitor 10 Years Journey (Part 1)
PQRST Complex
ecgMonitor 10 Years Journey (Part 1)
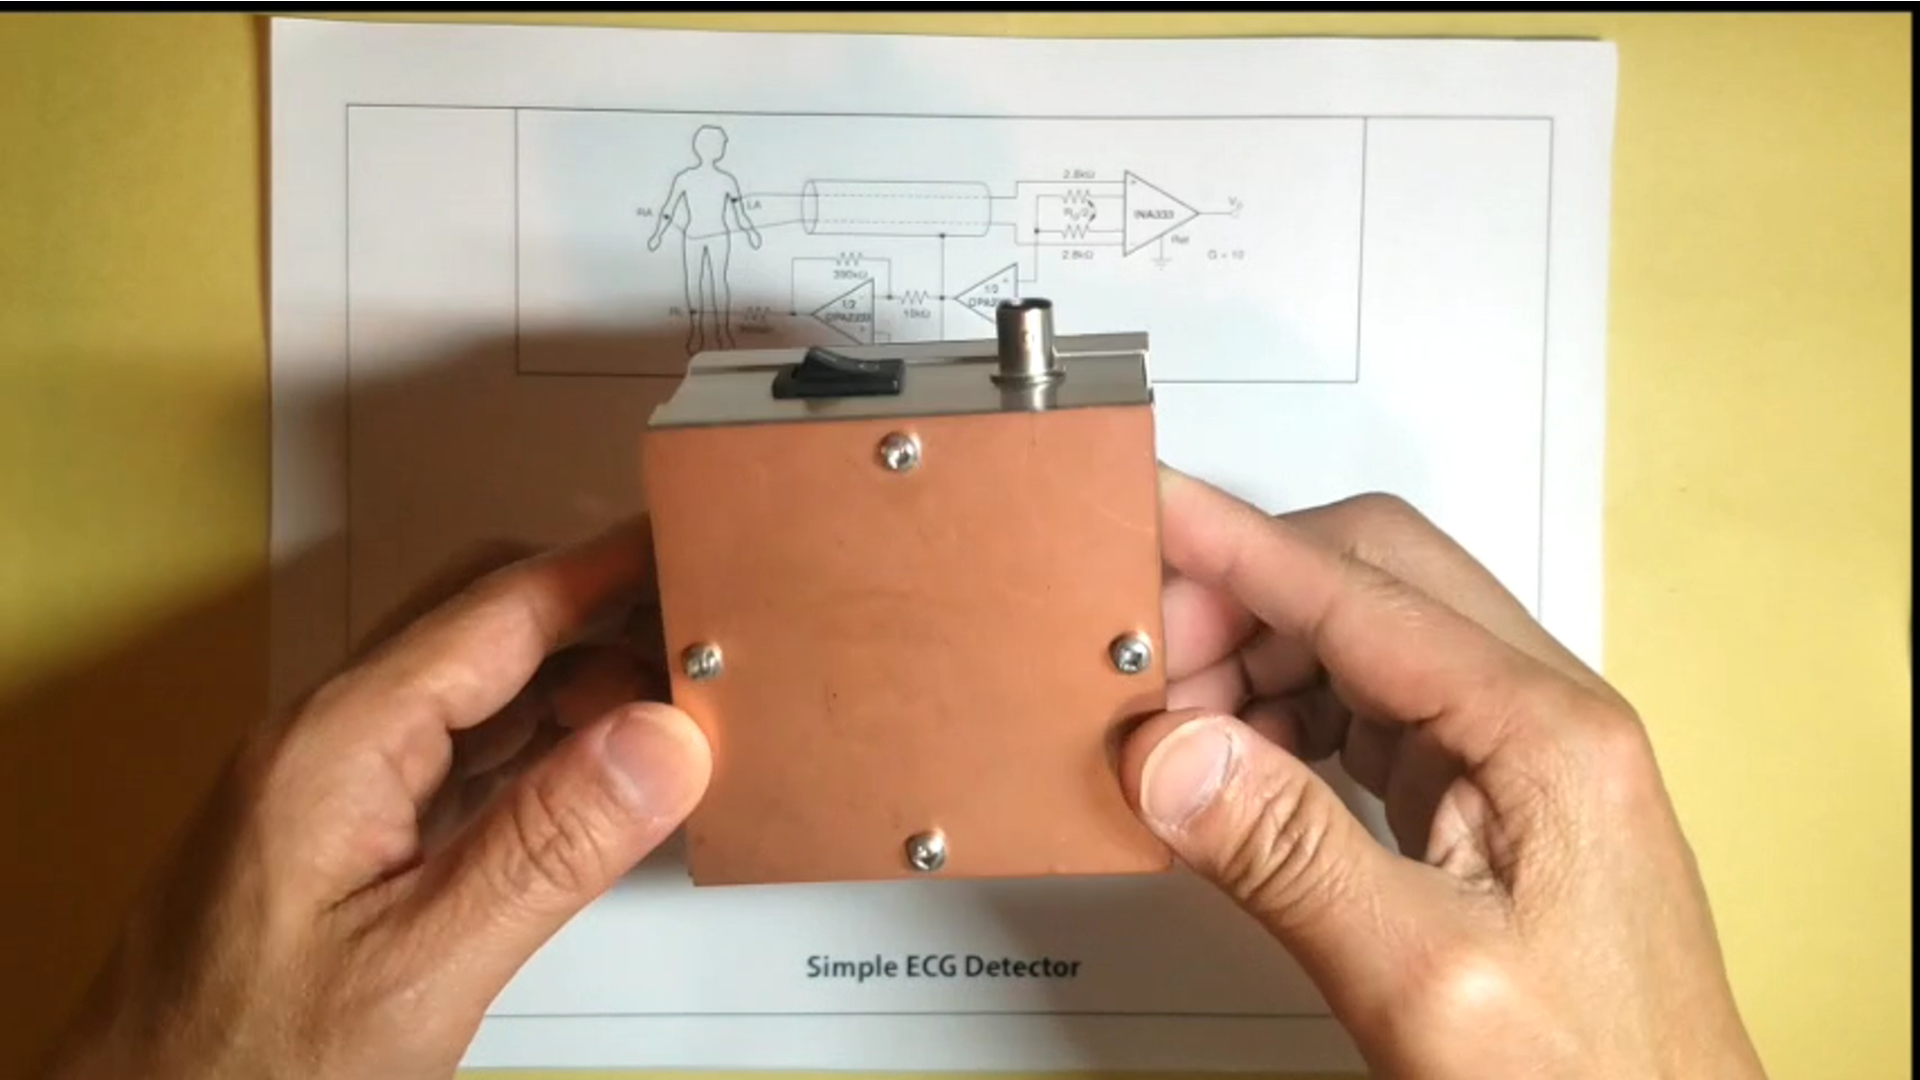
Simple ECG Detector
Schematic or Circuit from www.TI.com
April 2018
Is Your Heart Healthy?
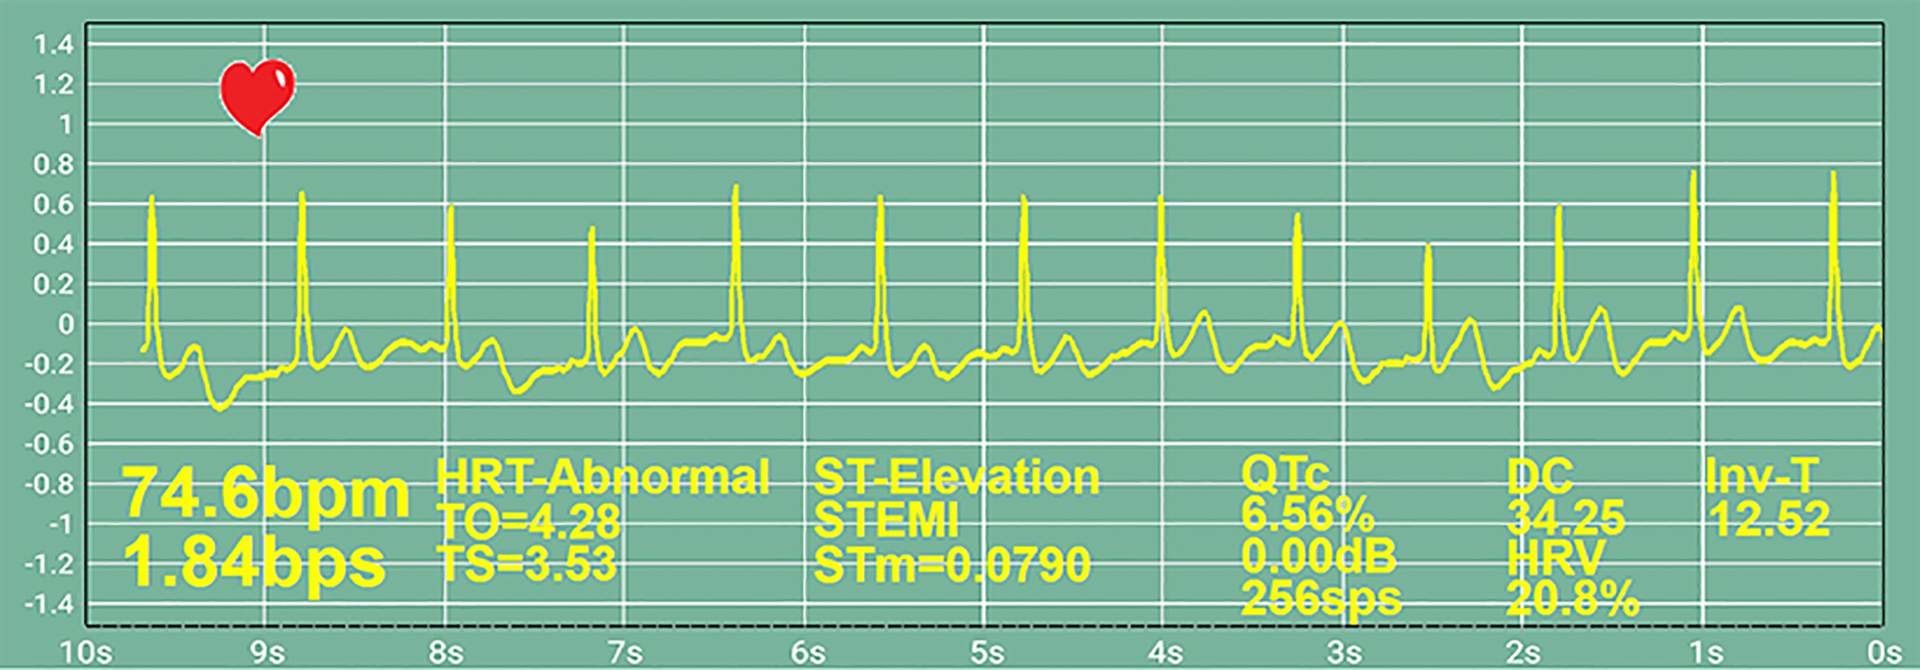
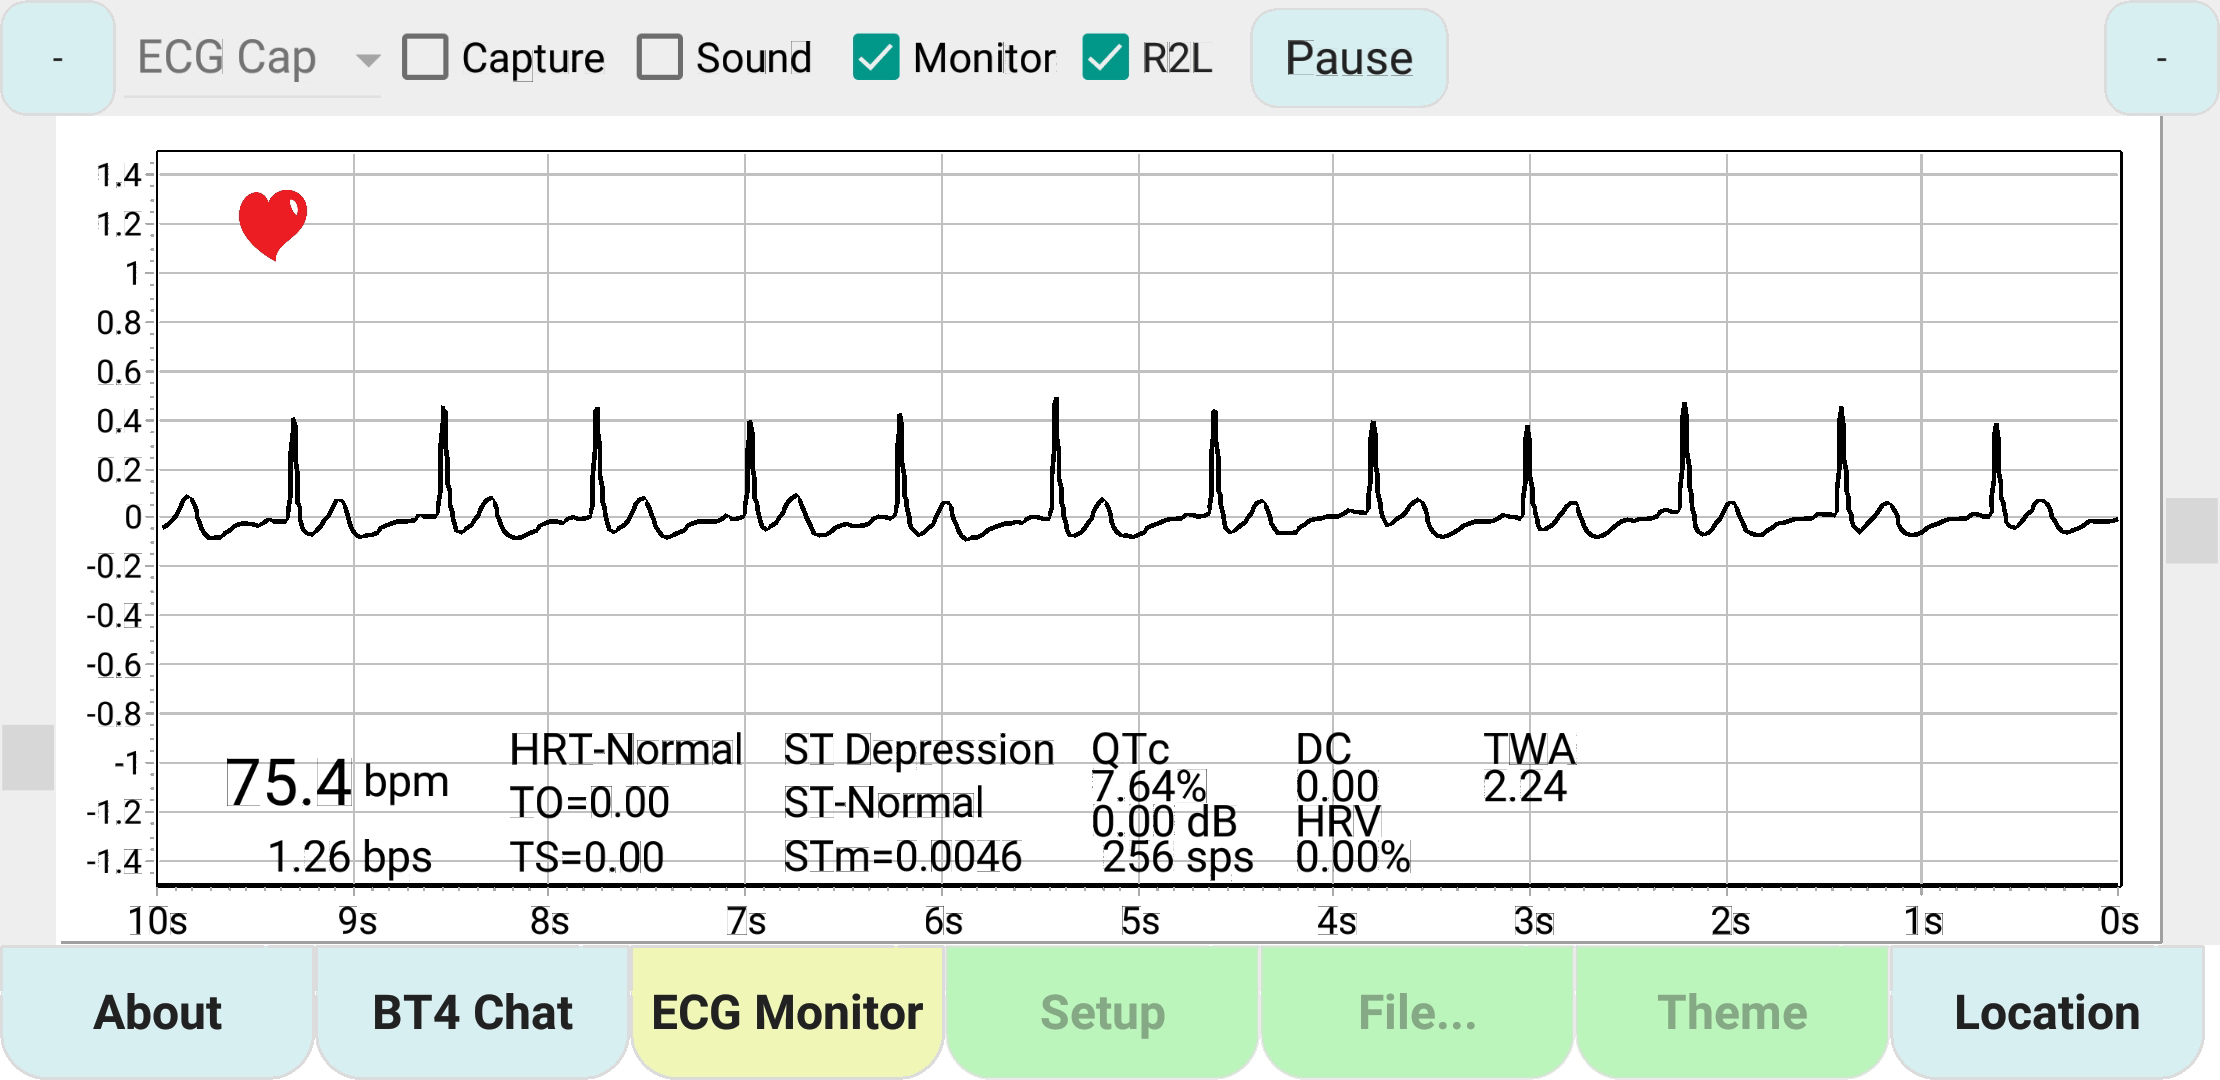
Real Time ECG Chart – bpm, bps, HRT, DC, ST, QT, HRV & TWA Analysis
Read Heart Beat in bpm and bps
T-Wave Alternans (TWA)
Heart Rate Variability (HRV)
Heart Rate Turbulence (HRT)
Deceleration Capacity (DC)
ST Analysis QT Analysis
Abnormal Signal Monitor
Real Time ECG – PQRST Wave Analysis – Medical Grade Wearable Equipment
ecgMonitor Design for Both Apple & Android
– Free Apps from Apple Store & Google Market
– Free Life Time Upgrade
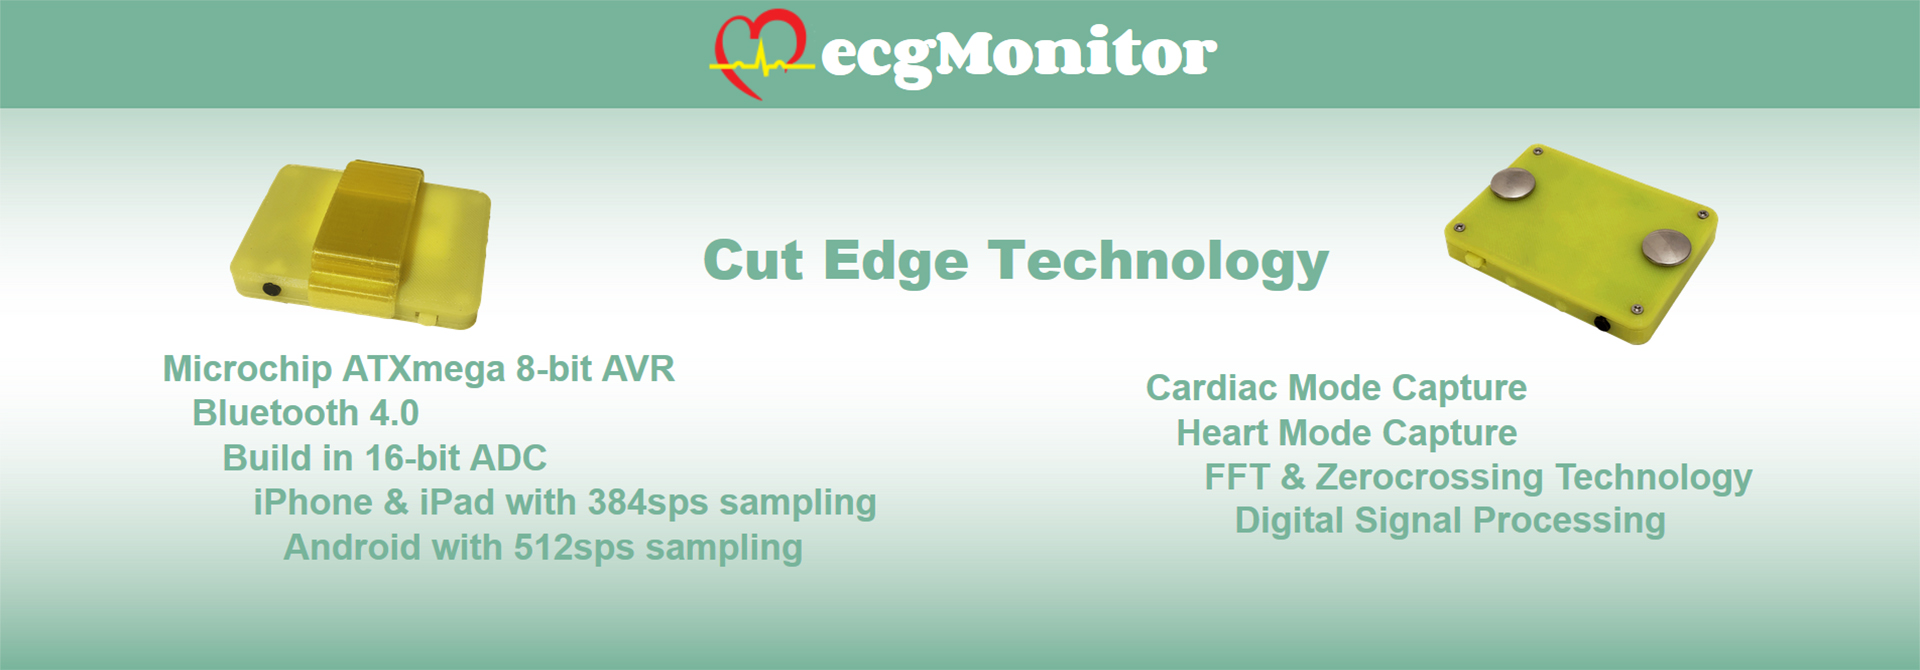
Cut Edge Technology
– Cardiac Mode Capture
– Heart Mode Capture
– FFT & Zerocrossing Technology
– Microship ATXmega 8-bit AVR
– Bluetooth 4.0
– Build in 16-bit ADC
– iPhone & iPad with 384sps sampling
– Android with 512sps sampling
– Digital Signal Processing
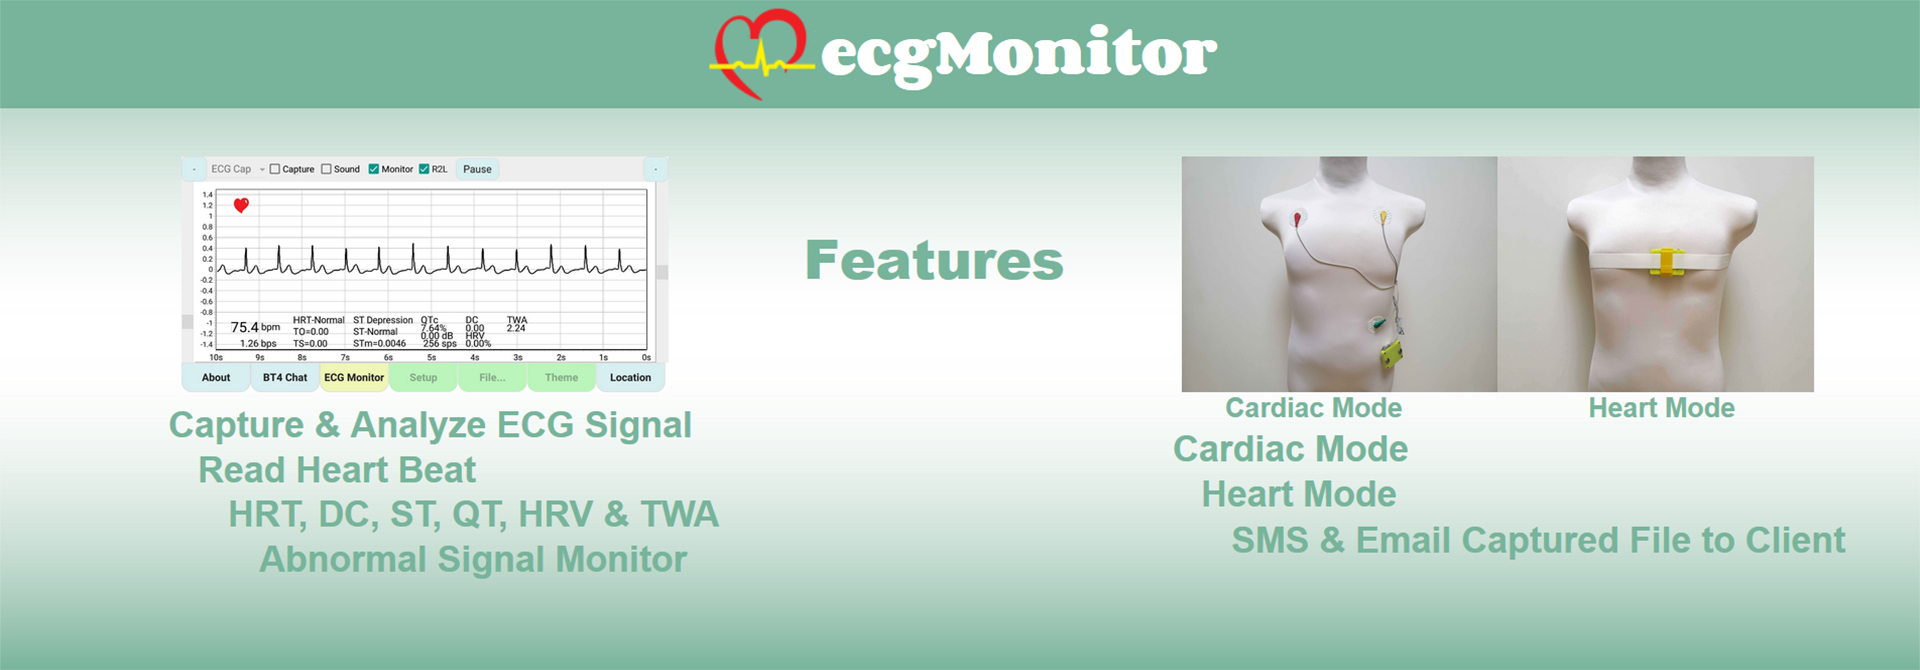
Features – ‘Cardiac Mode’ & ‘Heart Mode’
– Capture & Analyze ECG Signal
– Read Heart Beat
– HRT, DC, ST, QT, HRV & TWA Analysis
– Abnormal Signal Monitor
– SMS & Email Capture File to Client
PQRST.CA
March 2018
Product Launch
February 2018
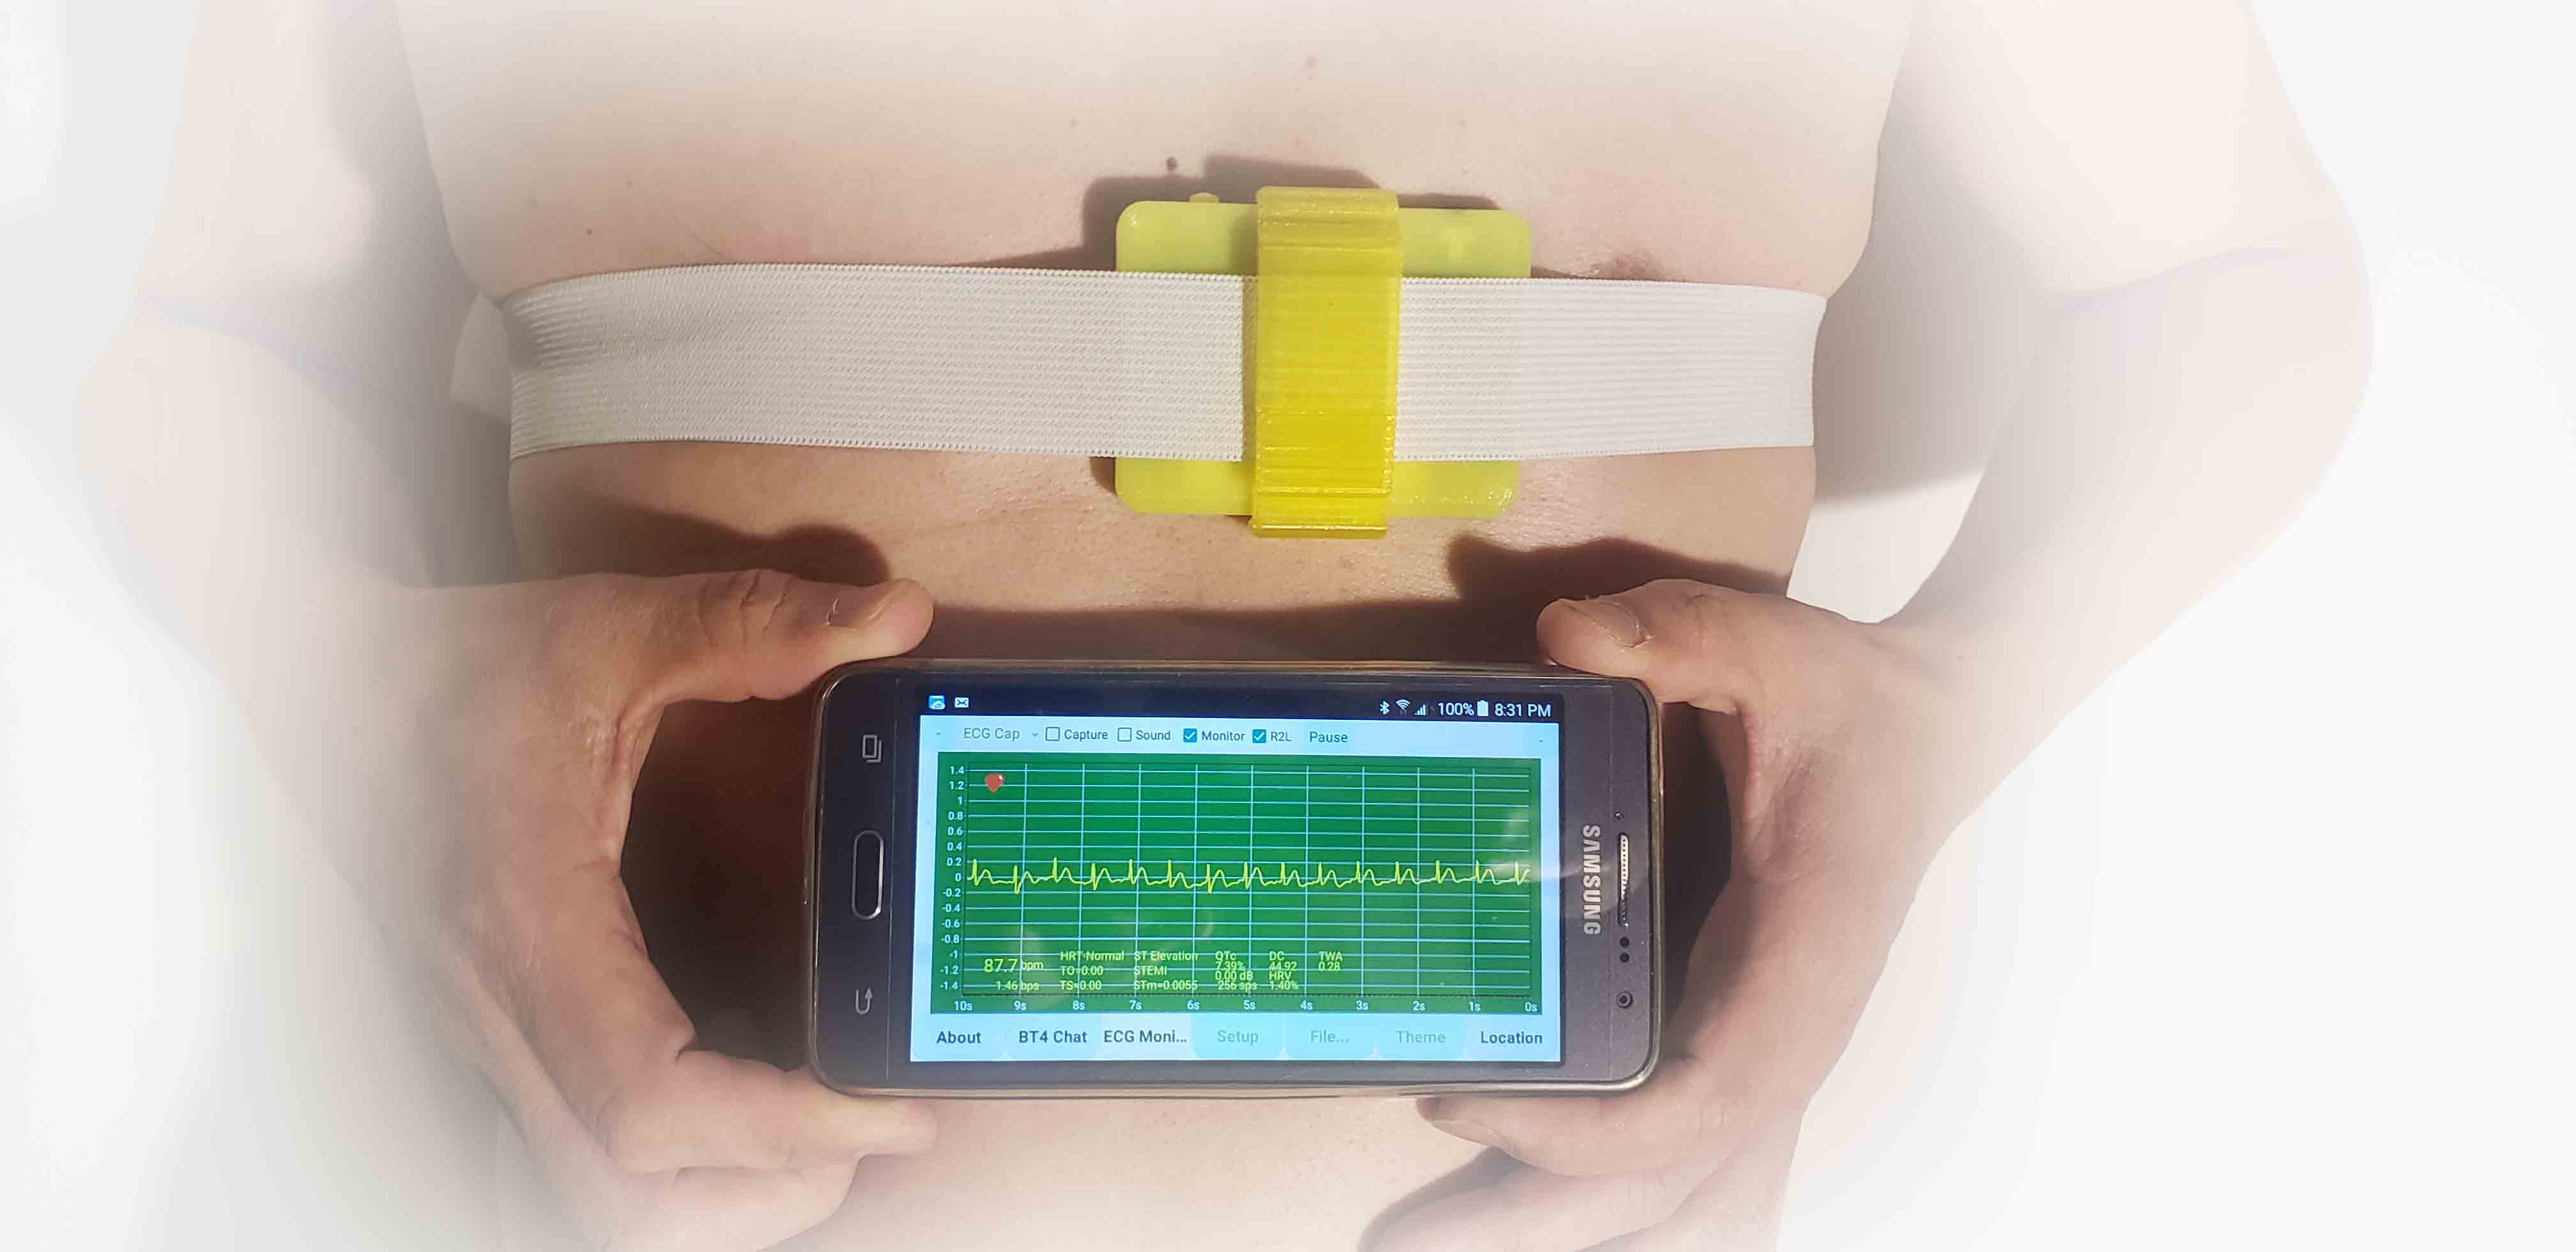
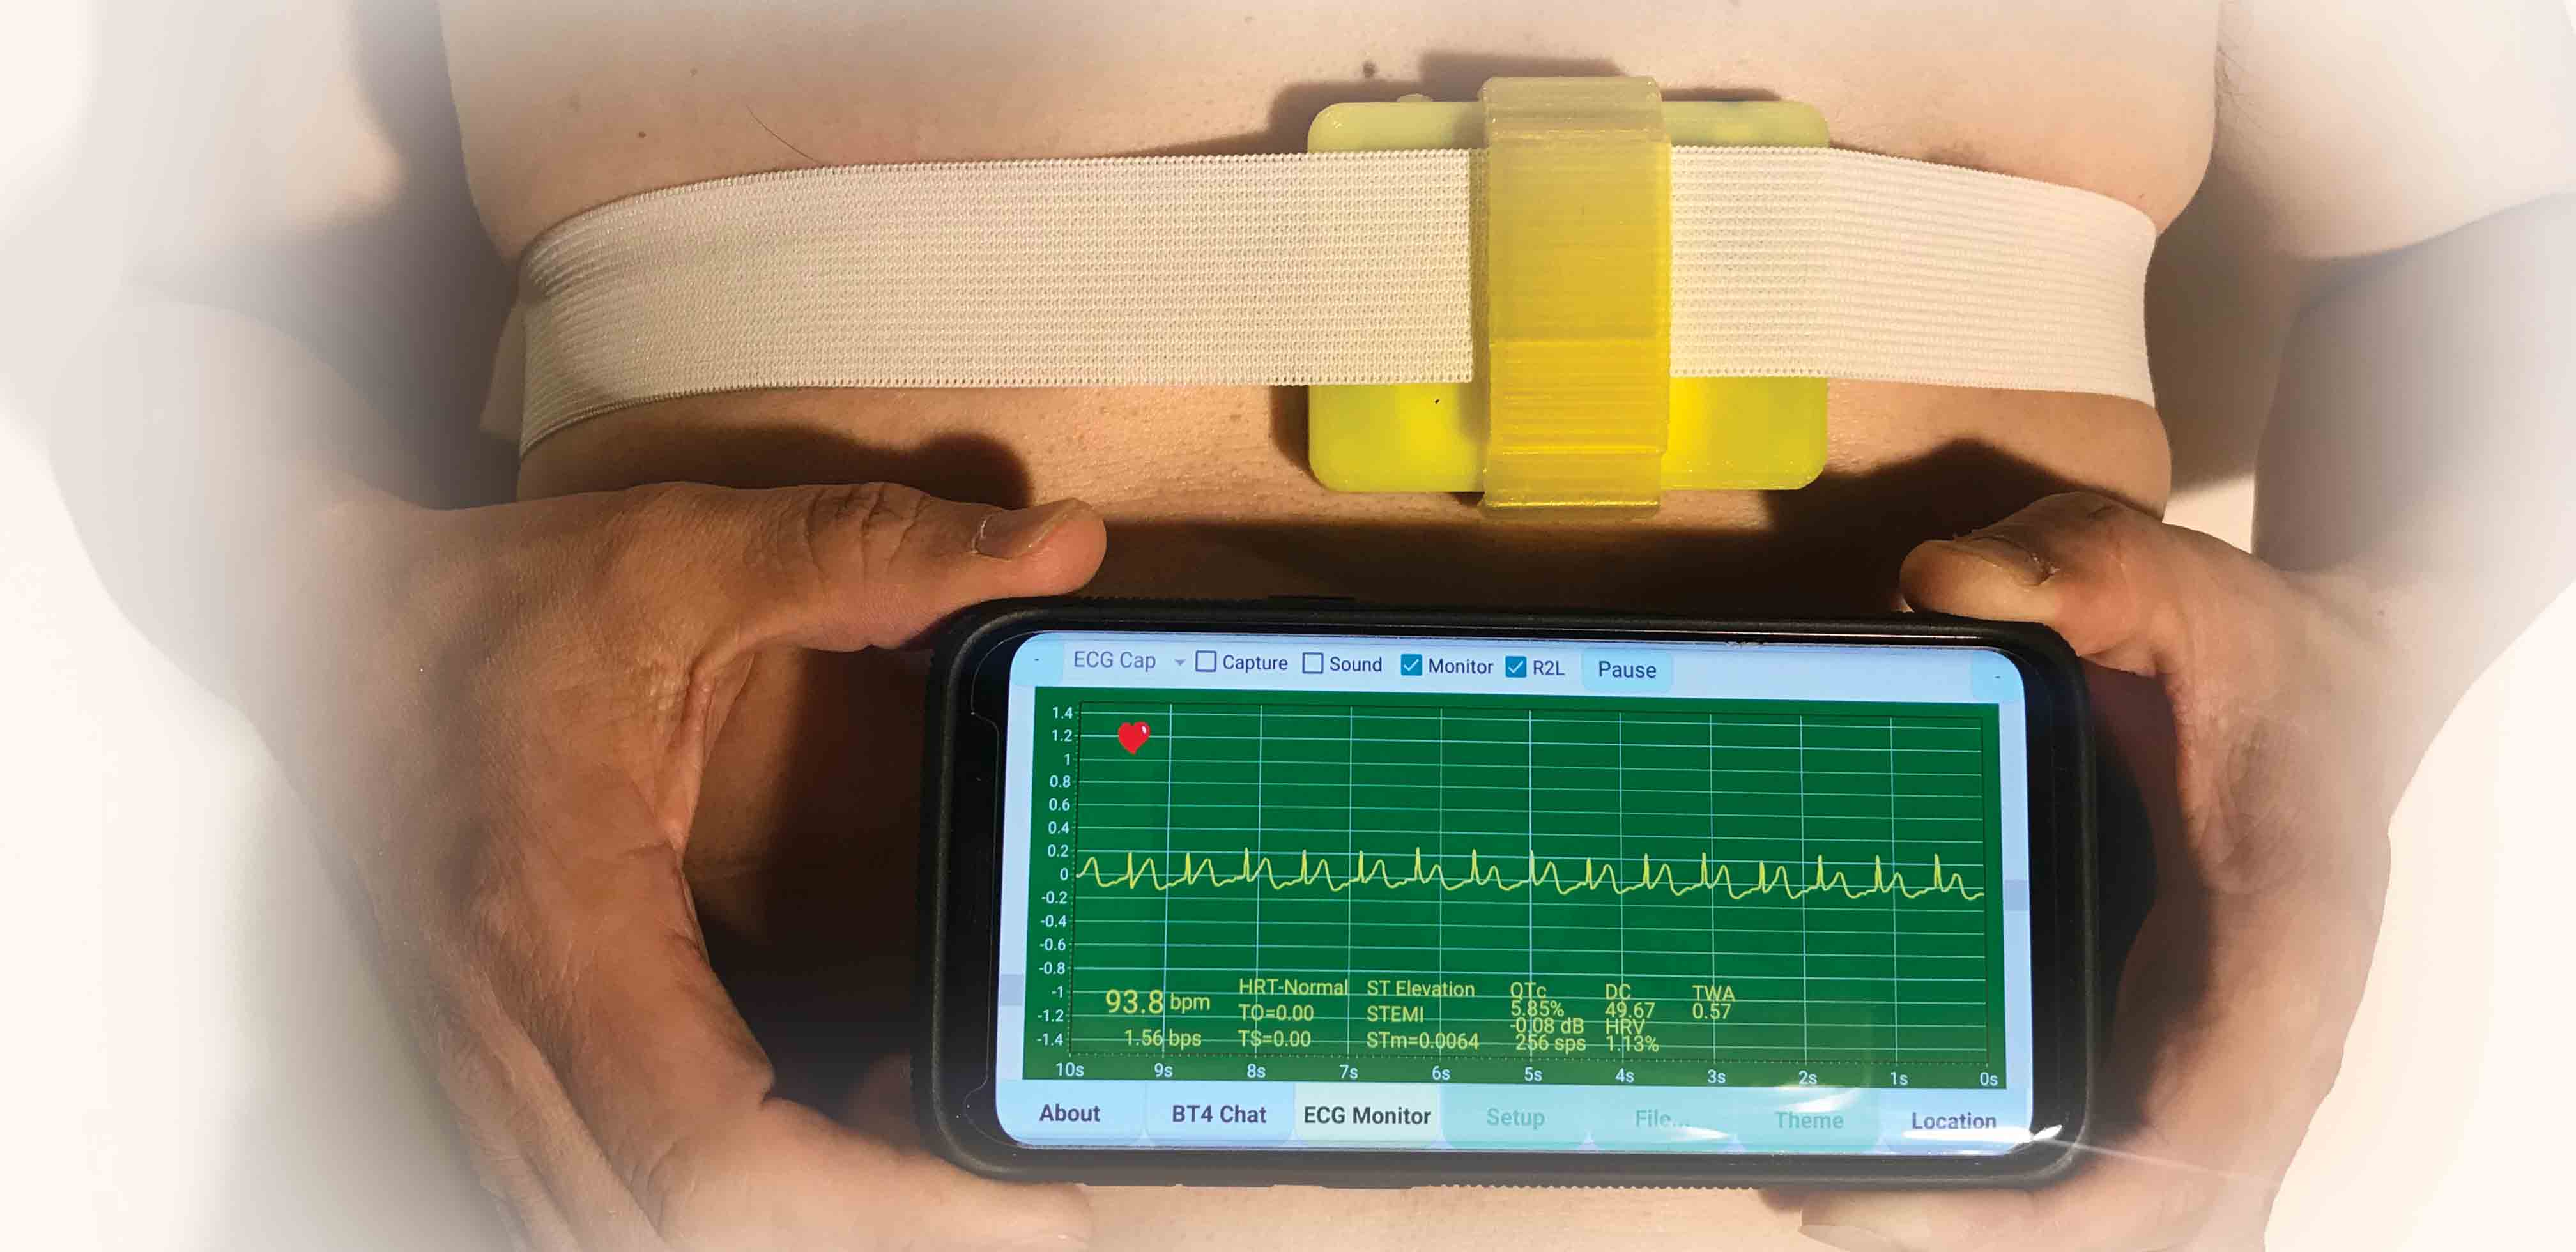
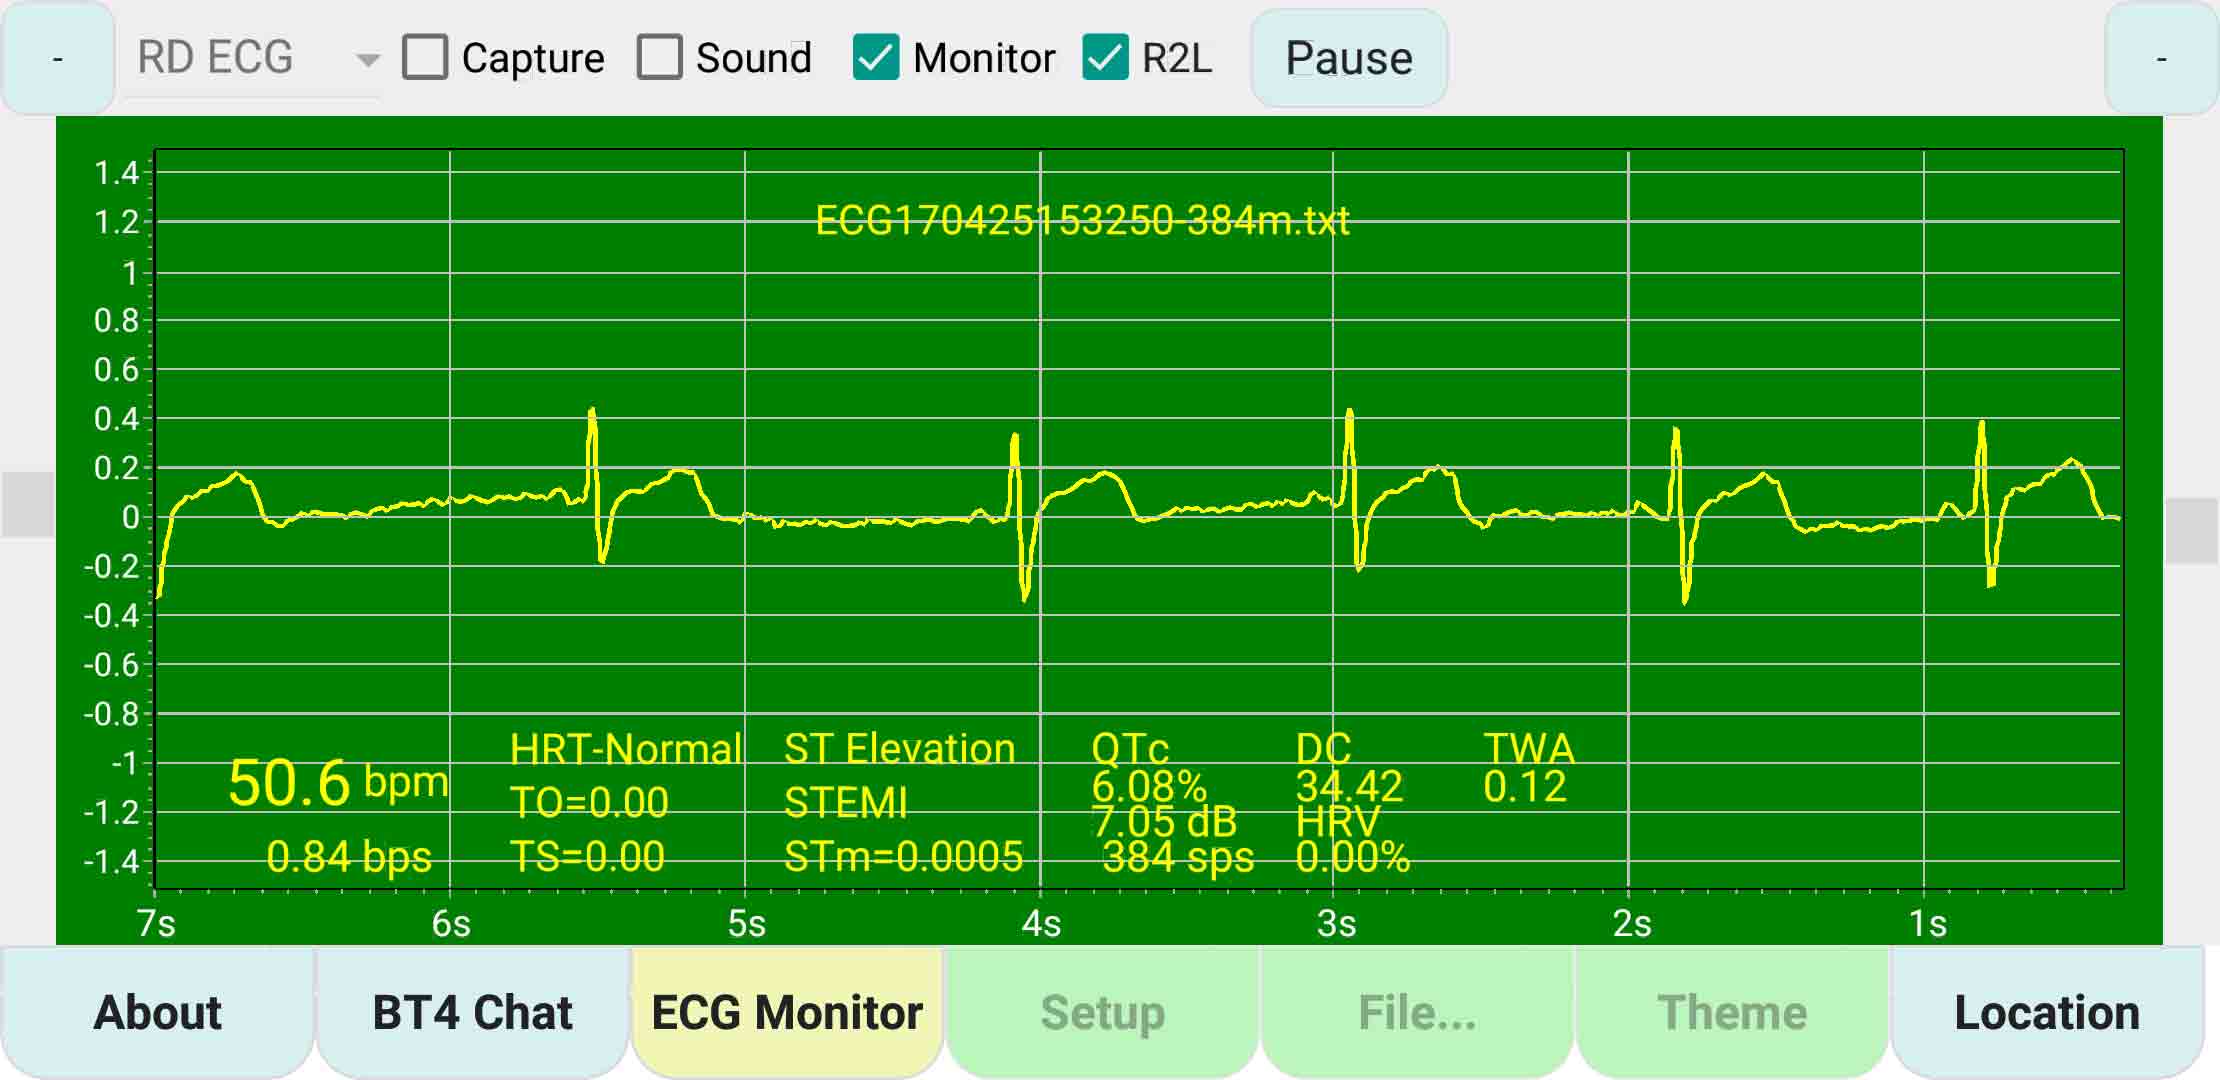
Real Time ECG Capture by Apple iPhone SE / IOS
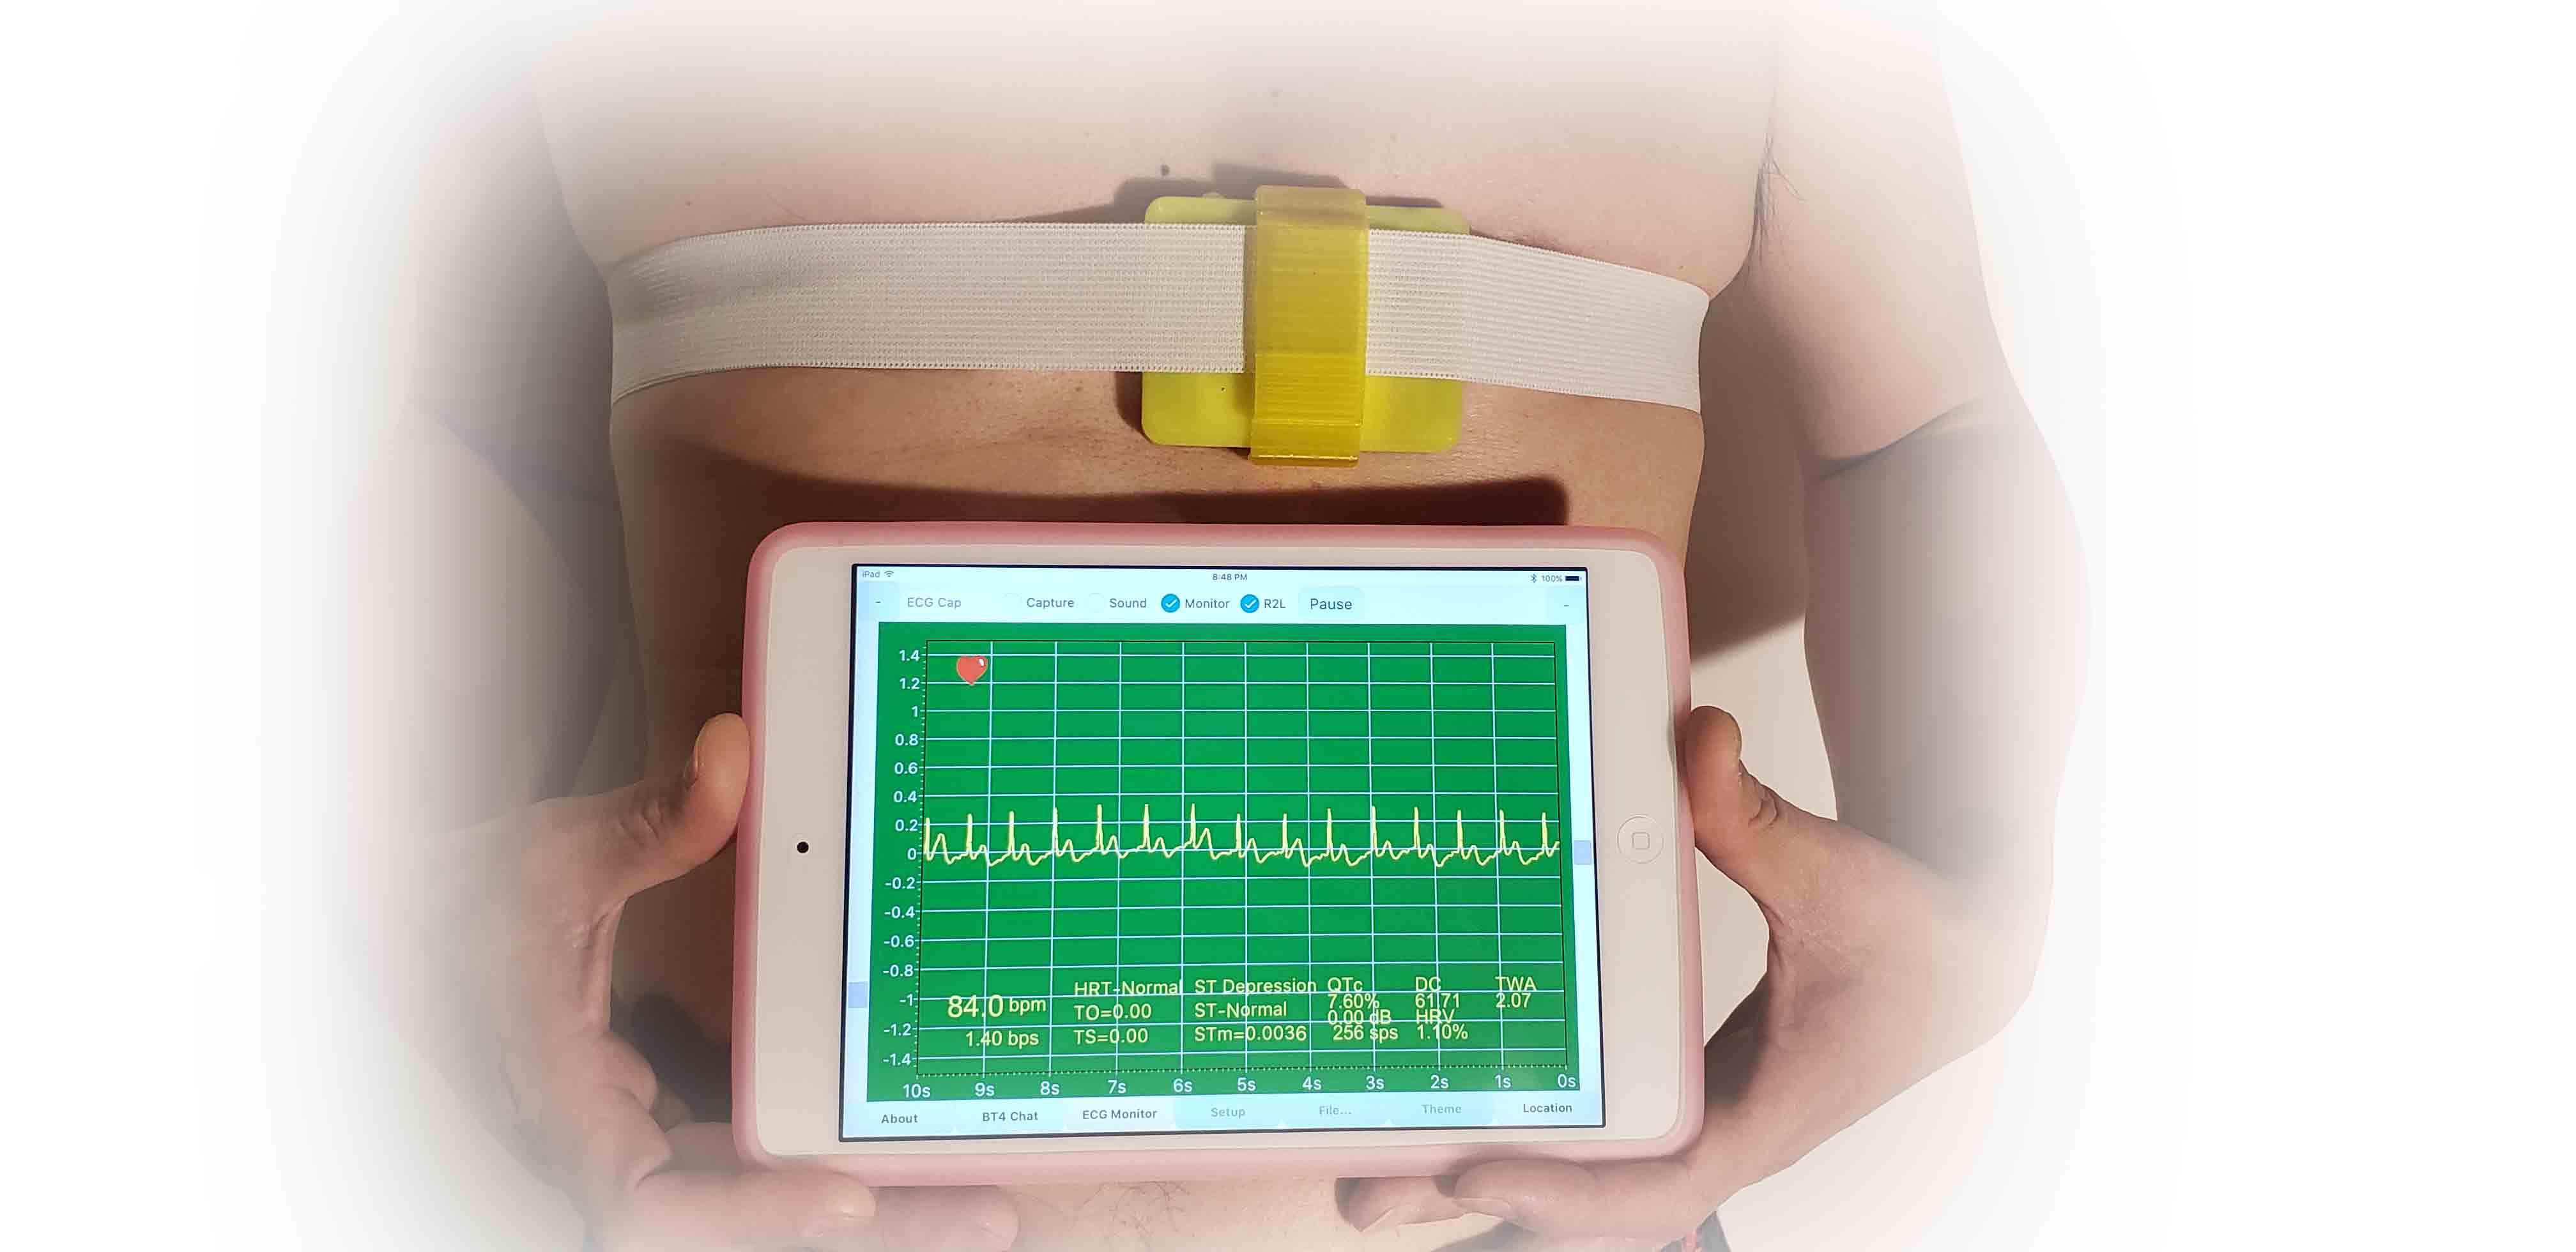
Real Time ECG Capture by Apple Mini / IOS
Real Time ECG Capture by Samsung Grand Prime / Android
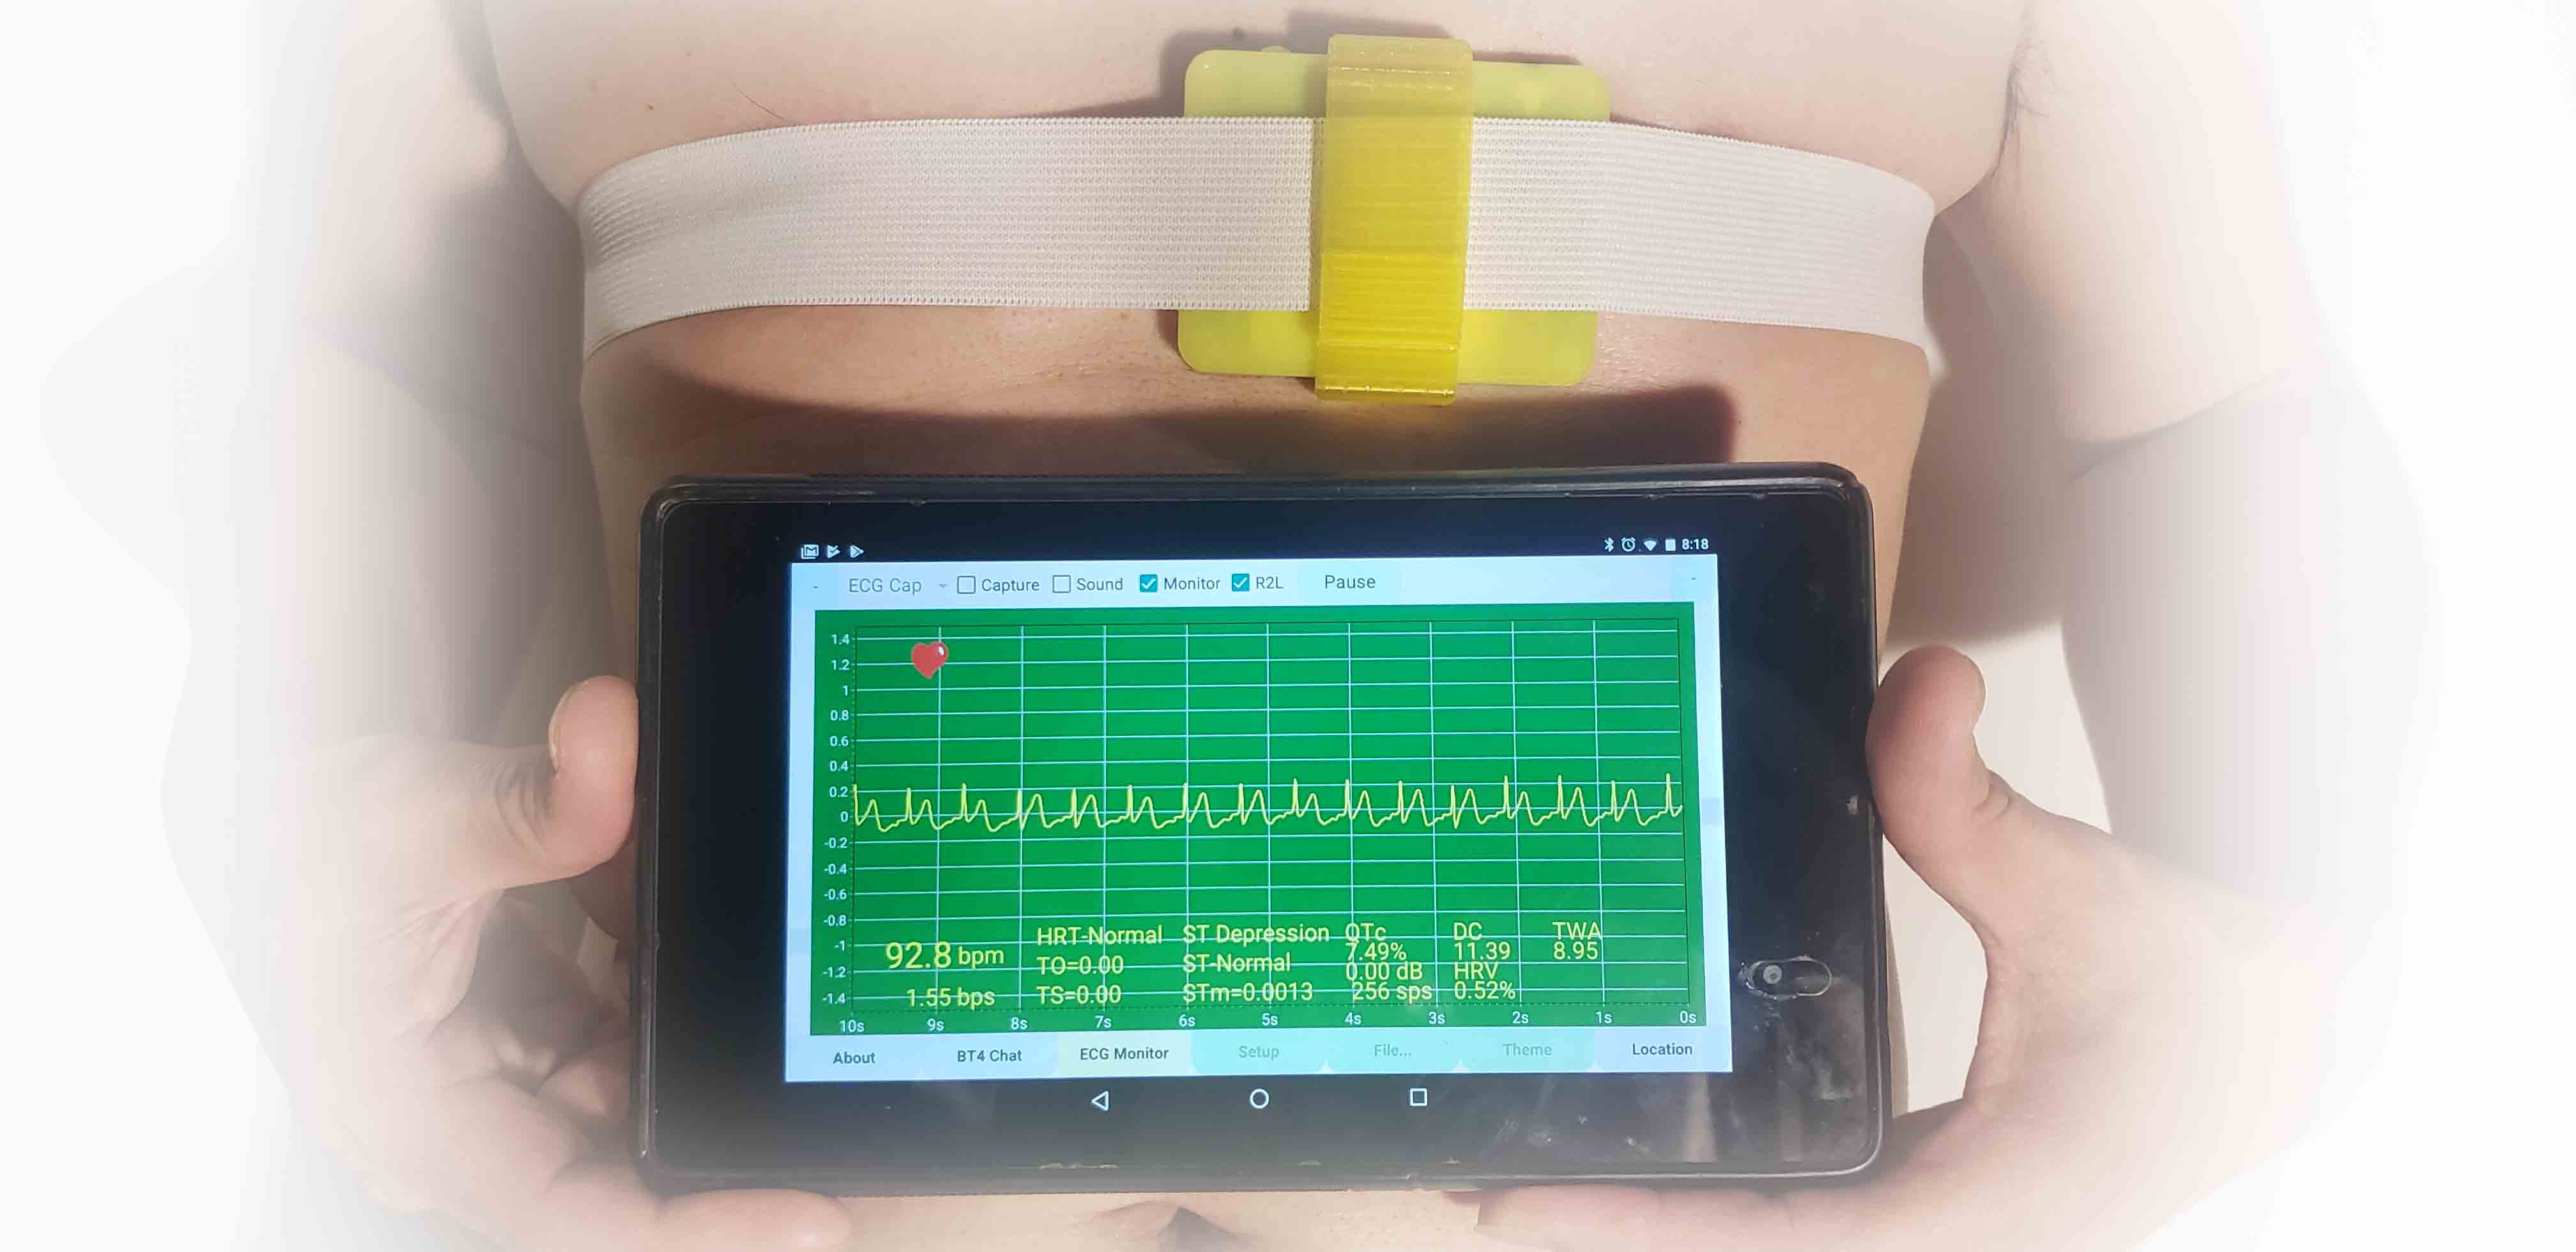
Real Time ECG Capture by Nexus 7 Tablet / Android
Real Time ECG Capture by Samsung S9 / Android
January 2018
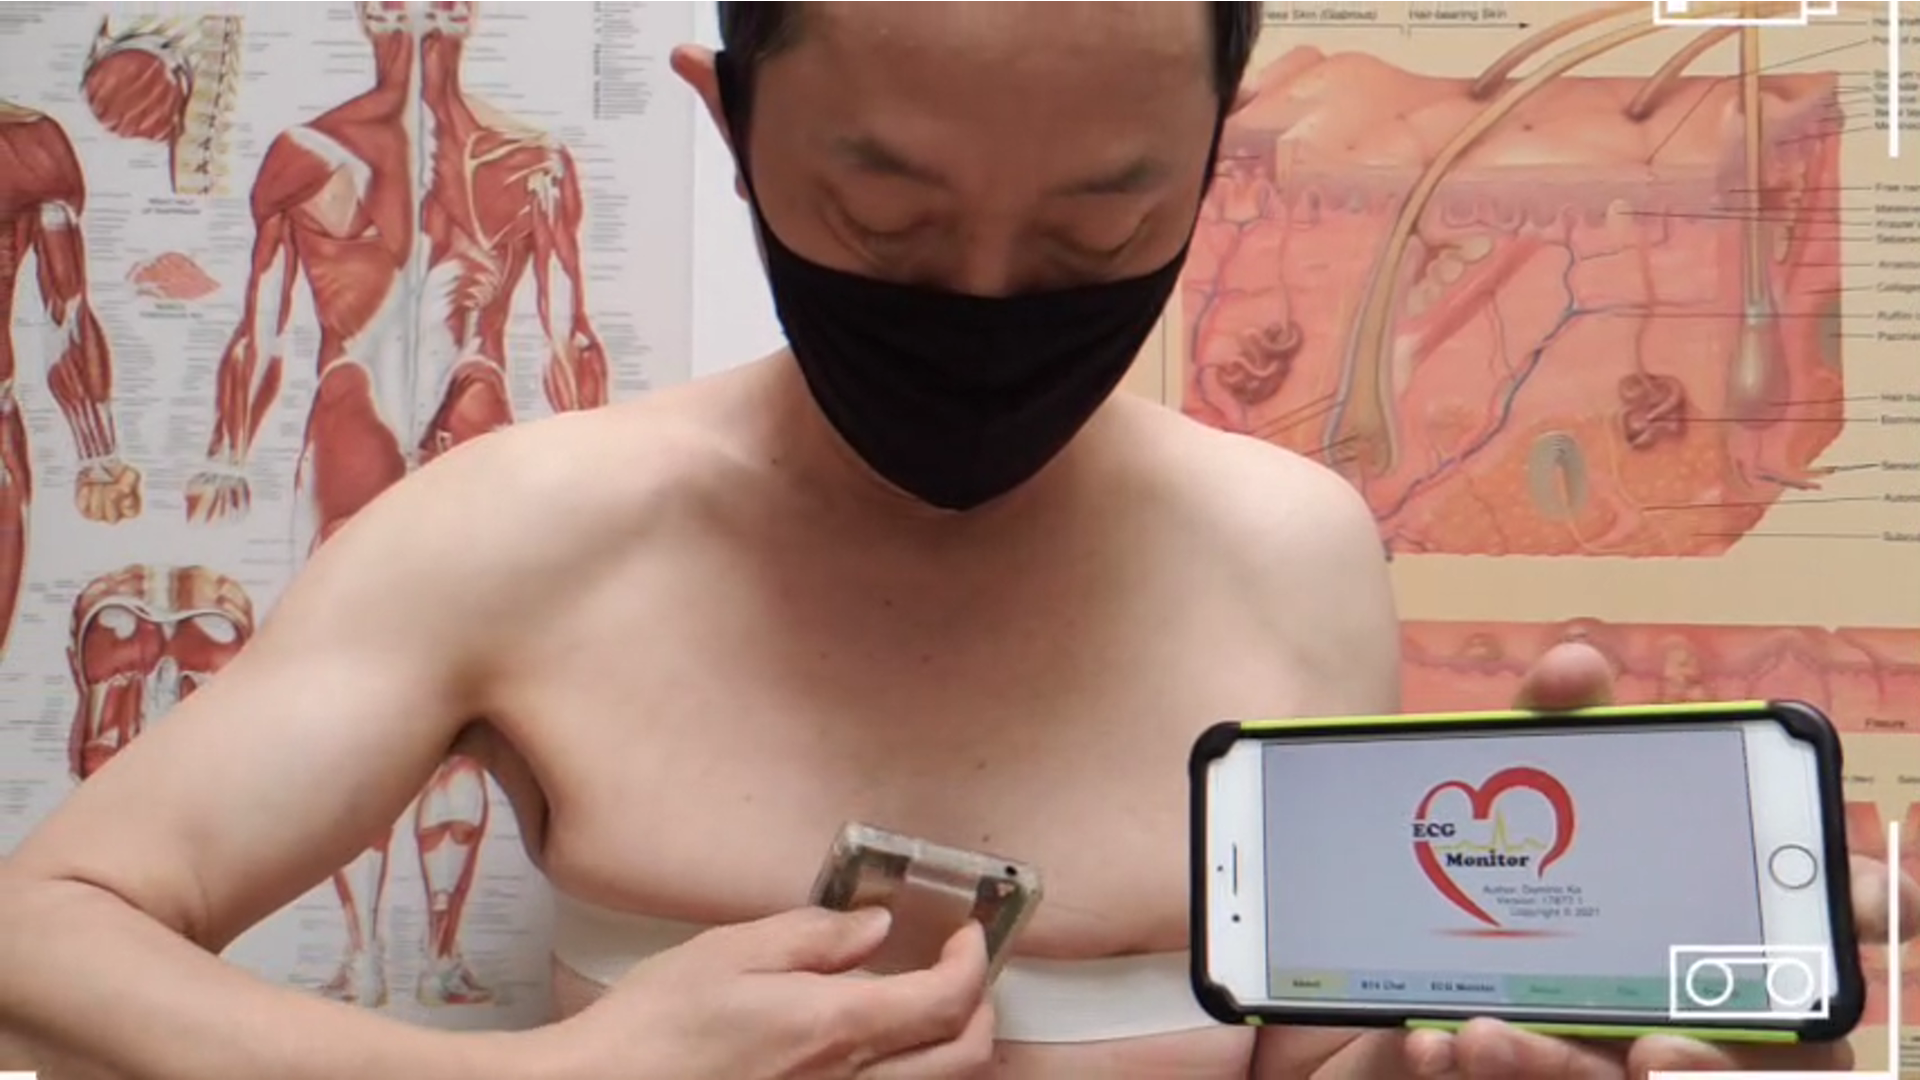
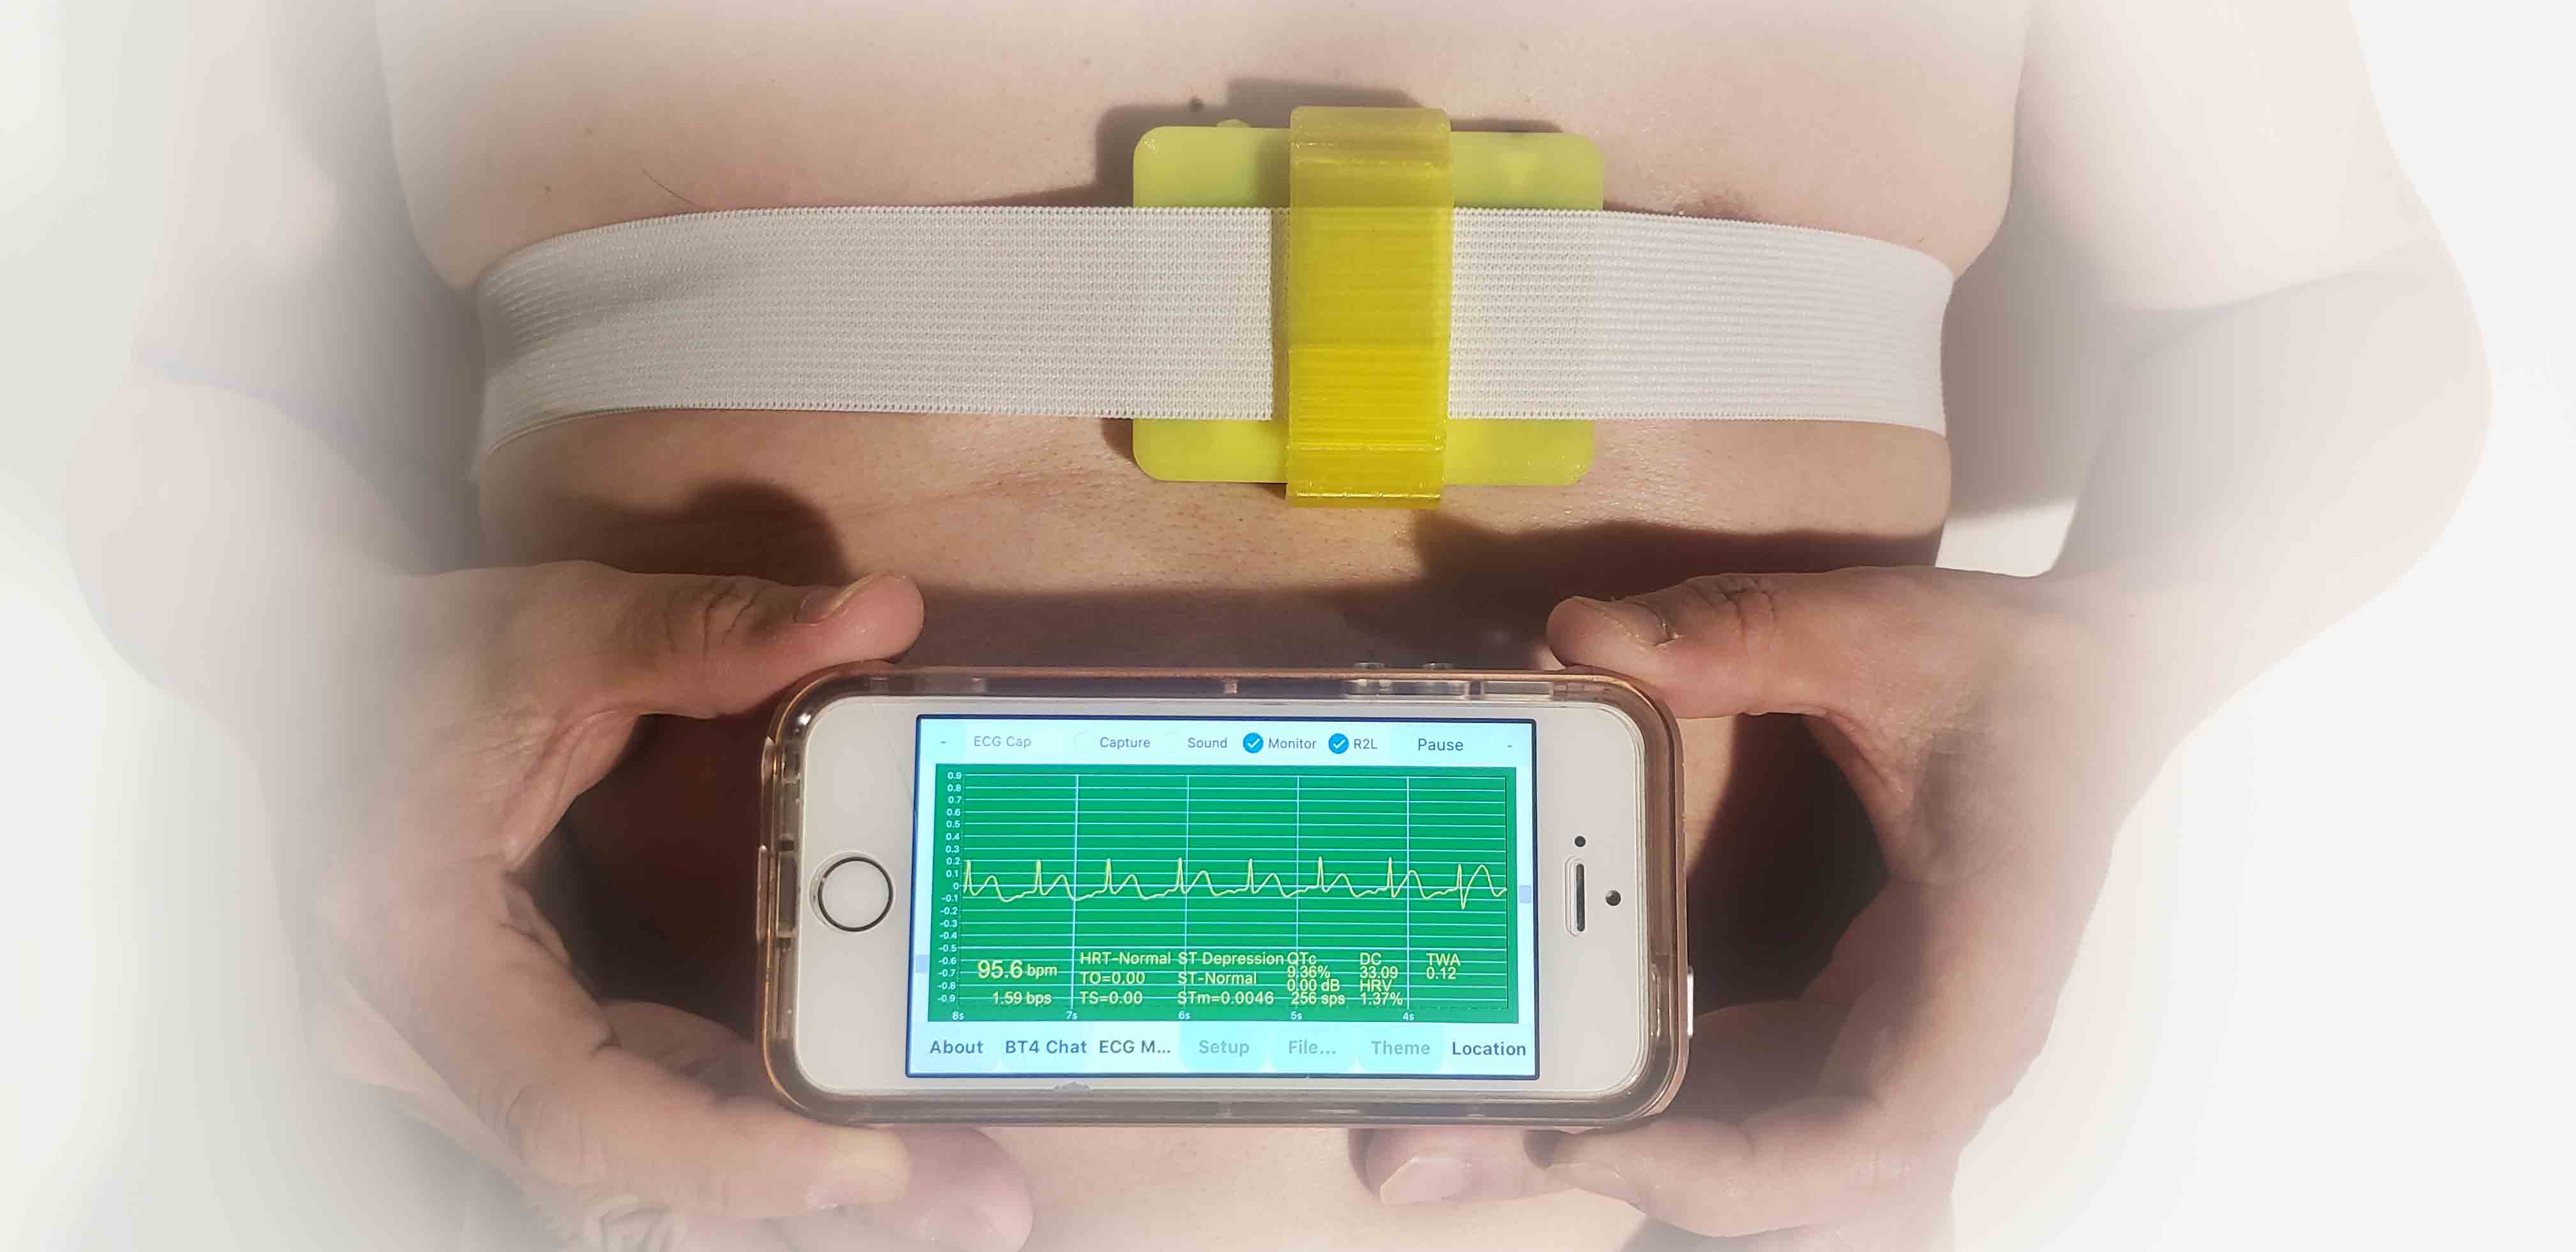
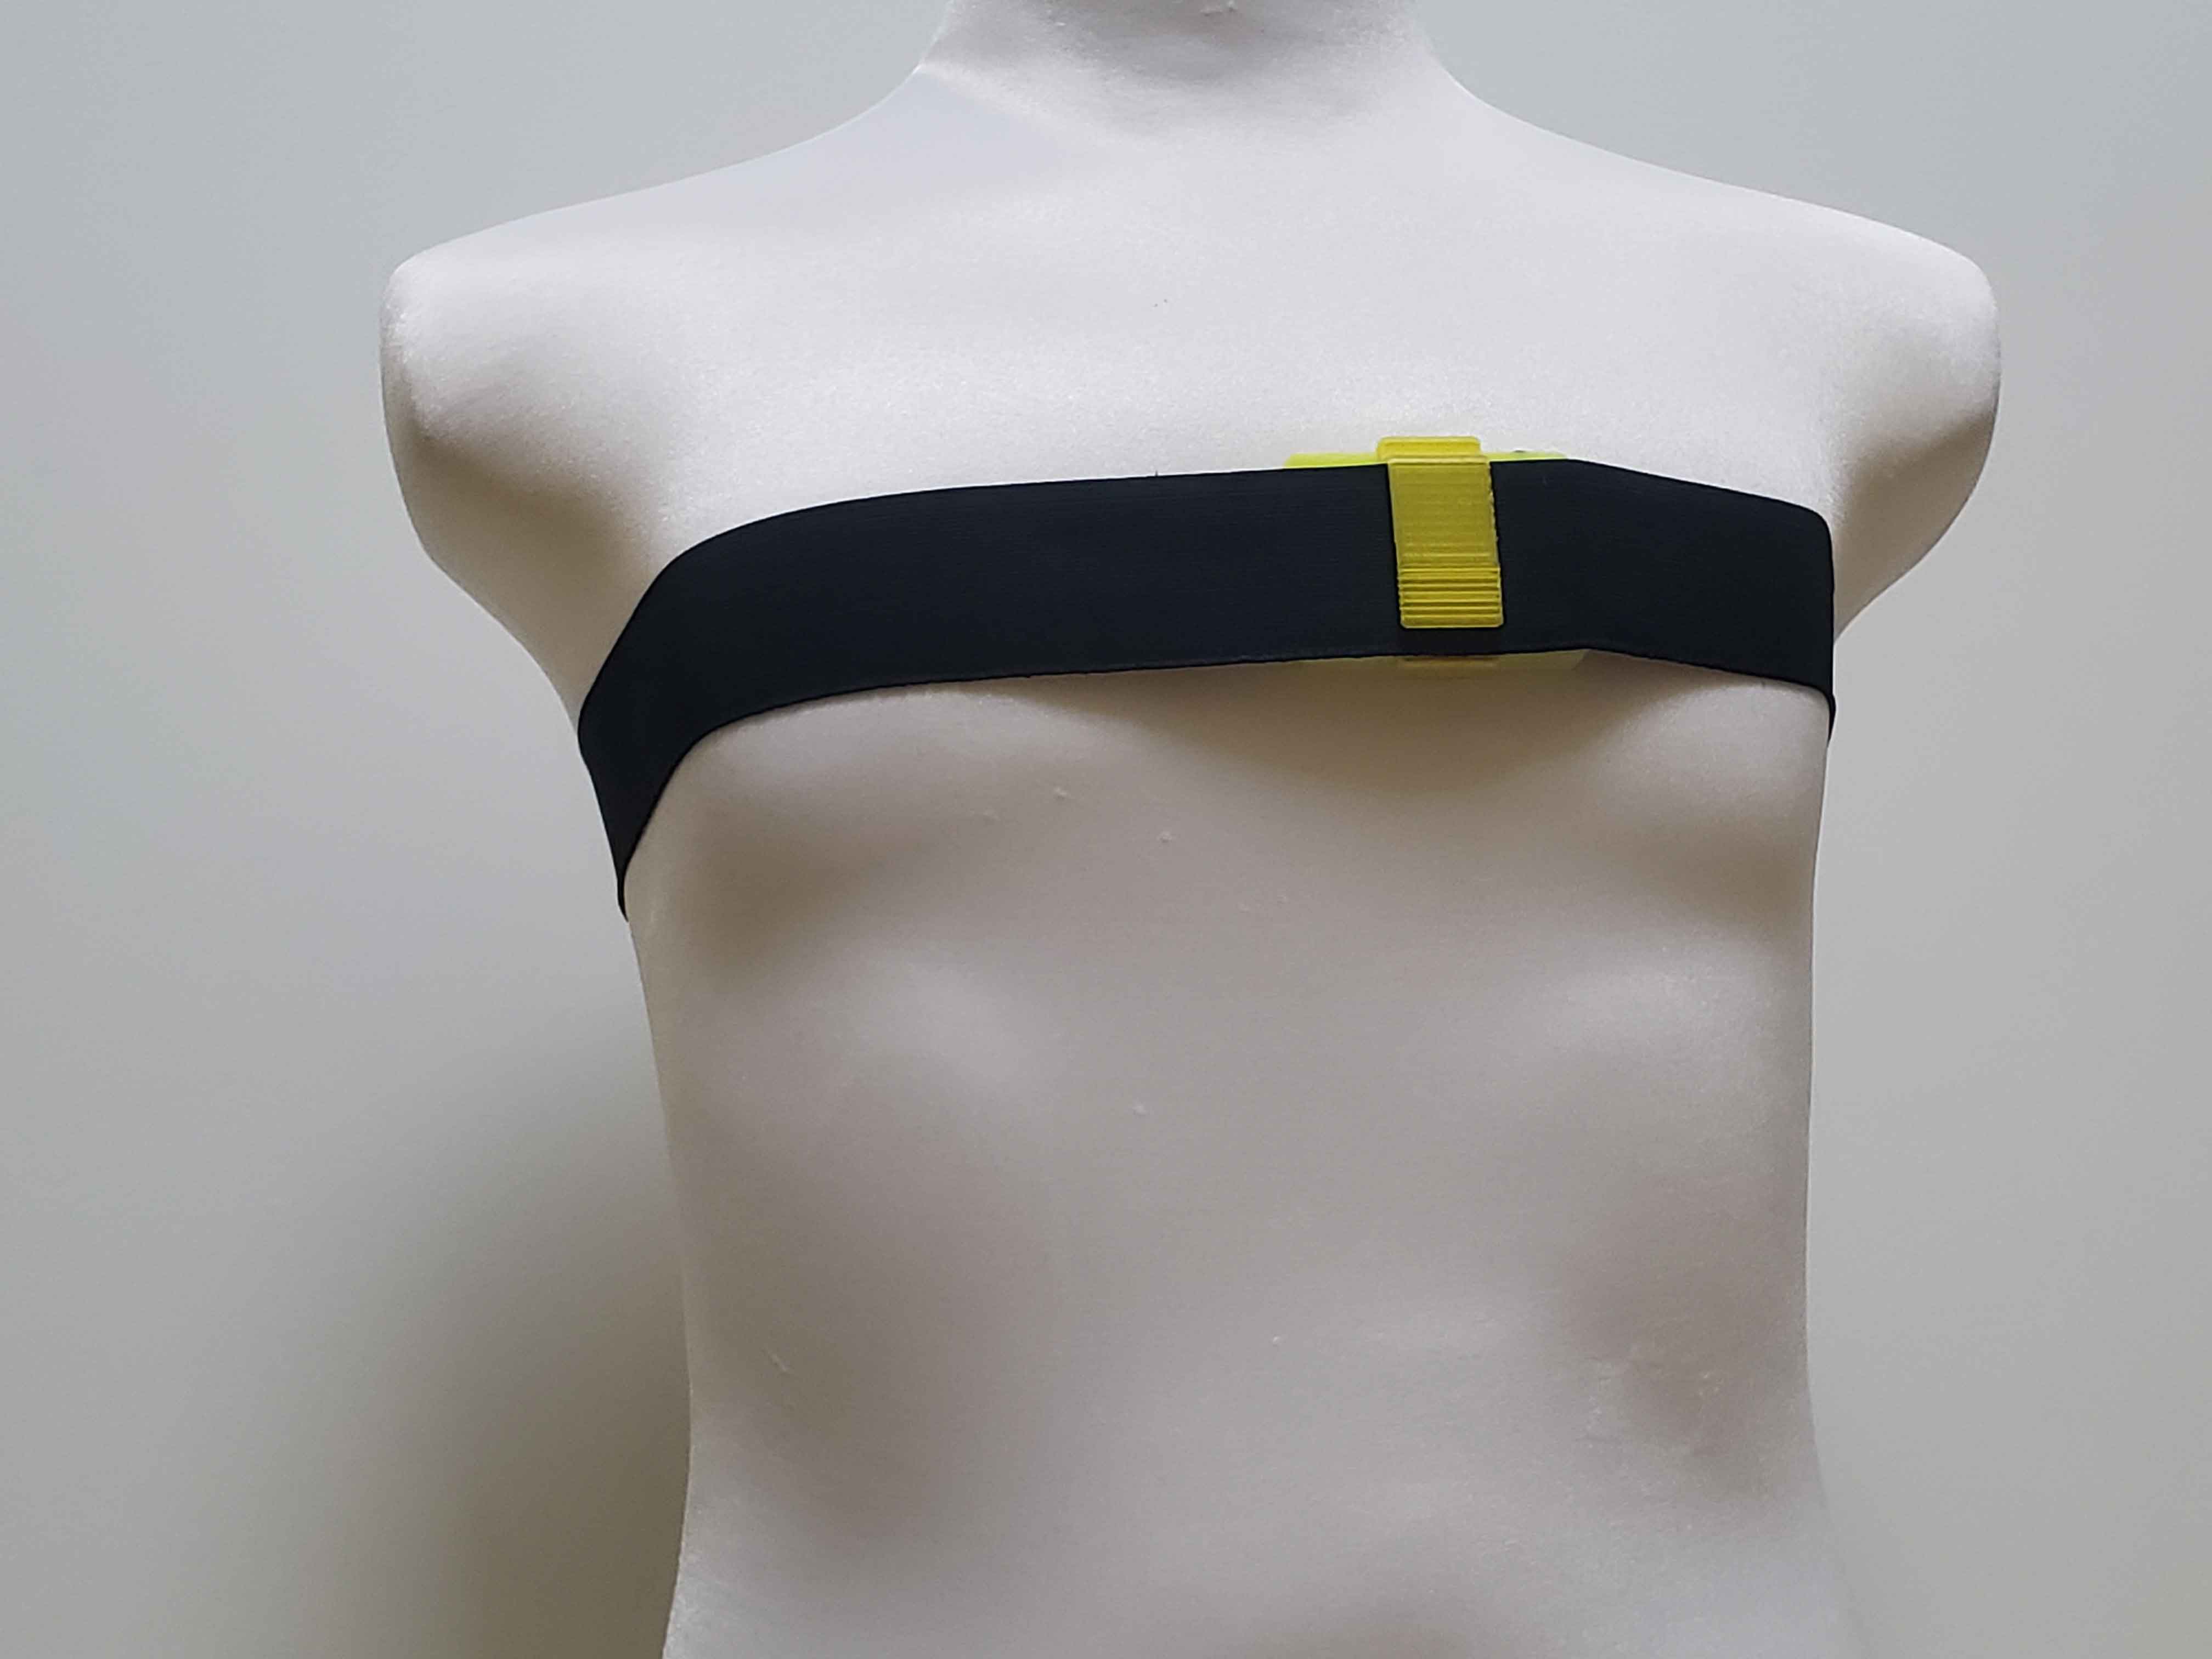
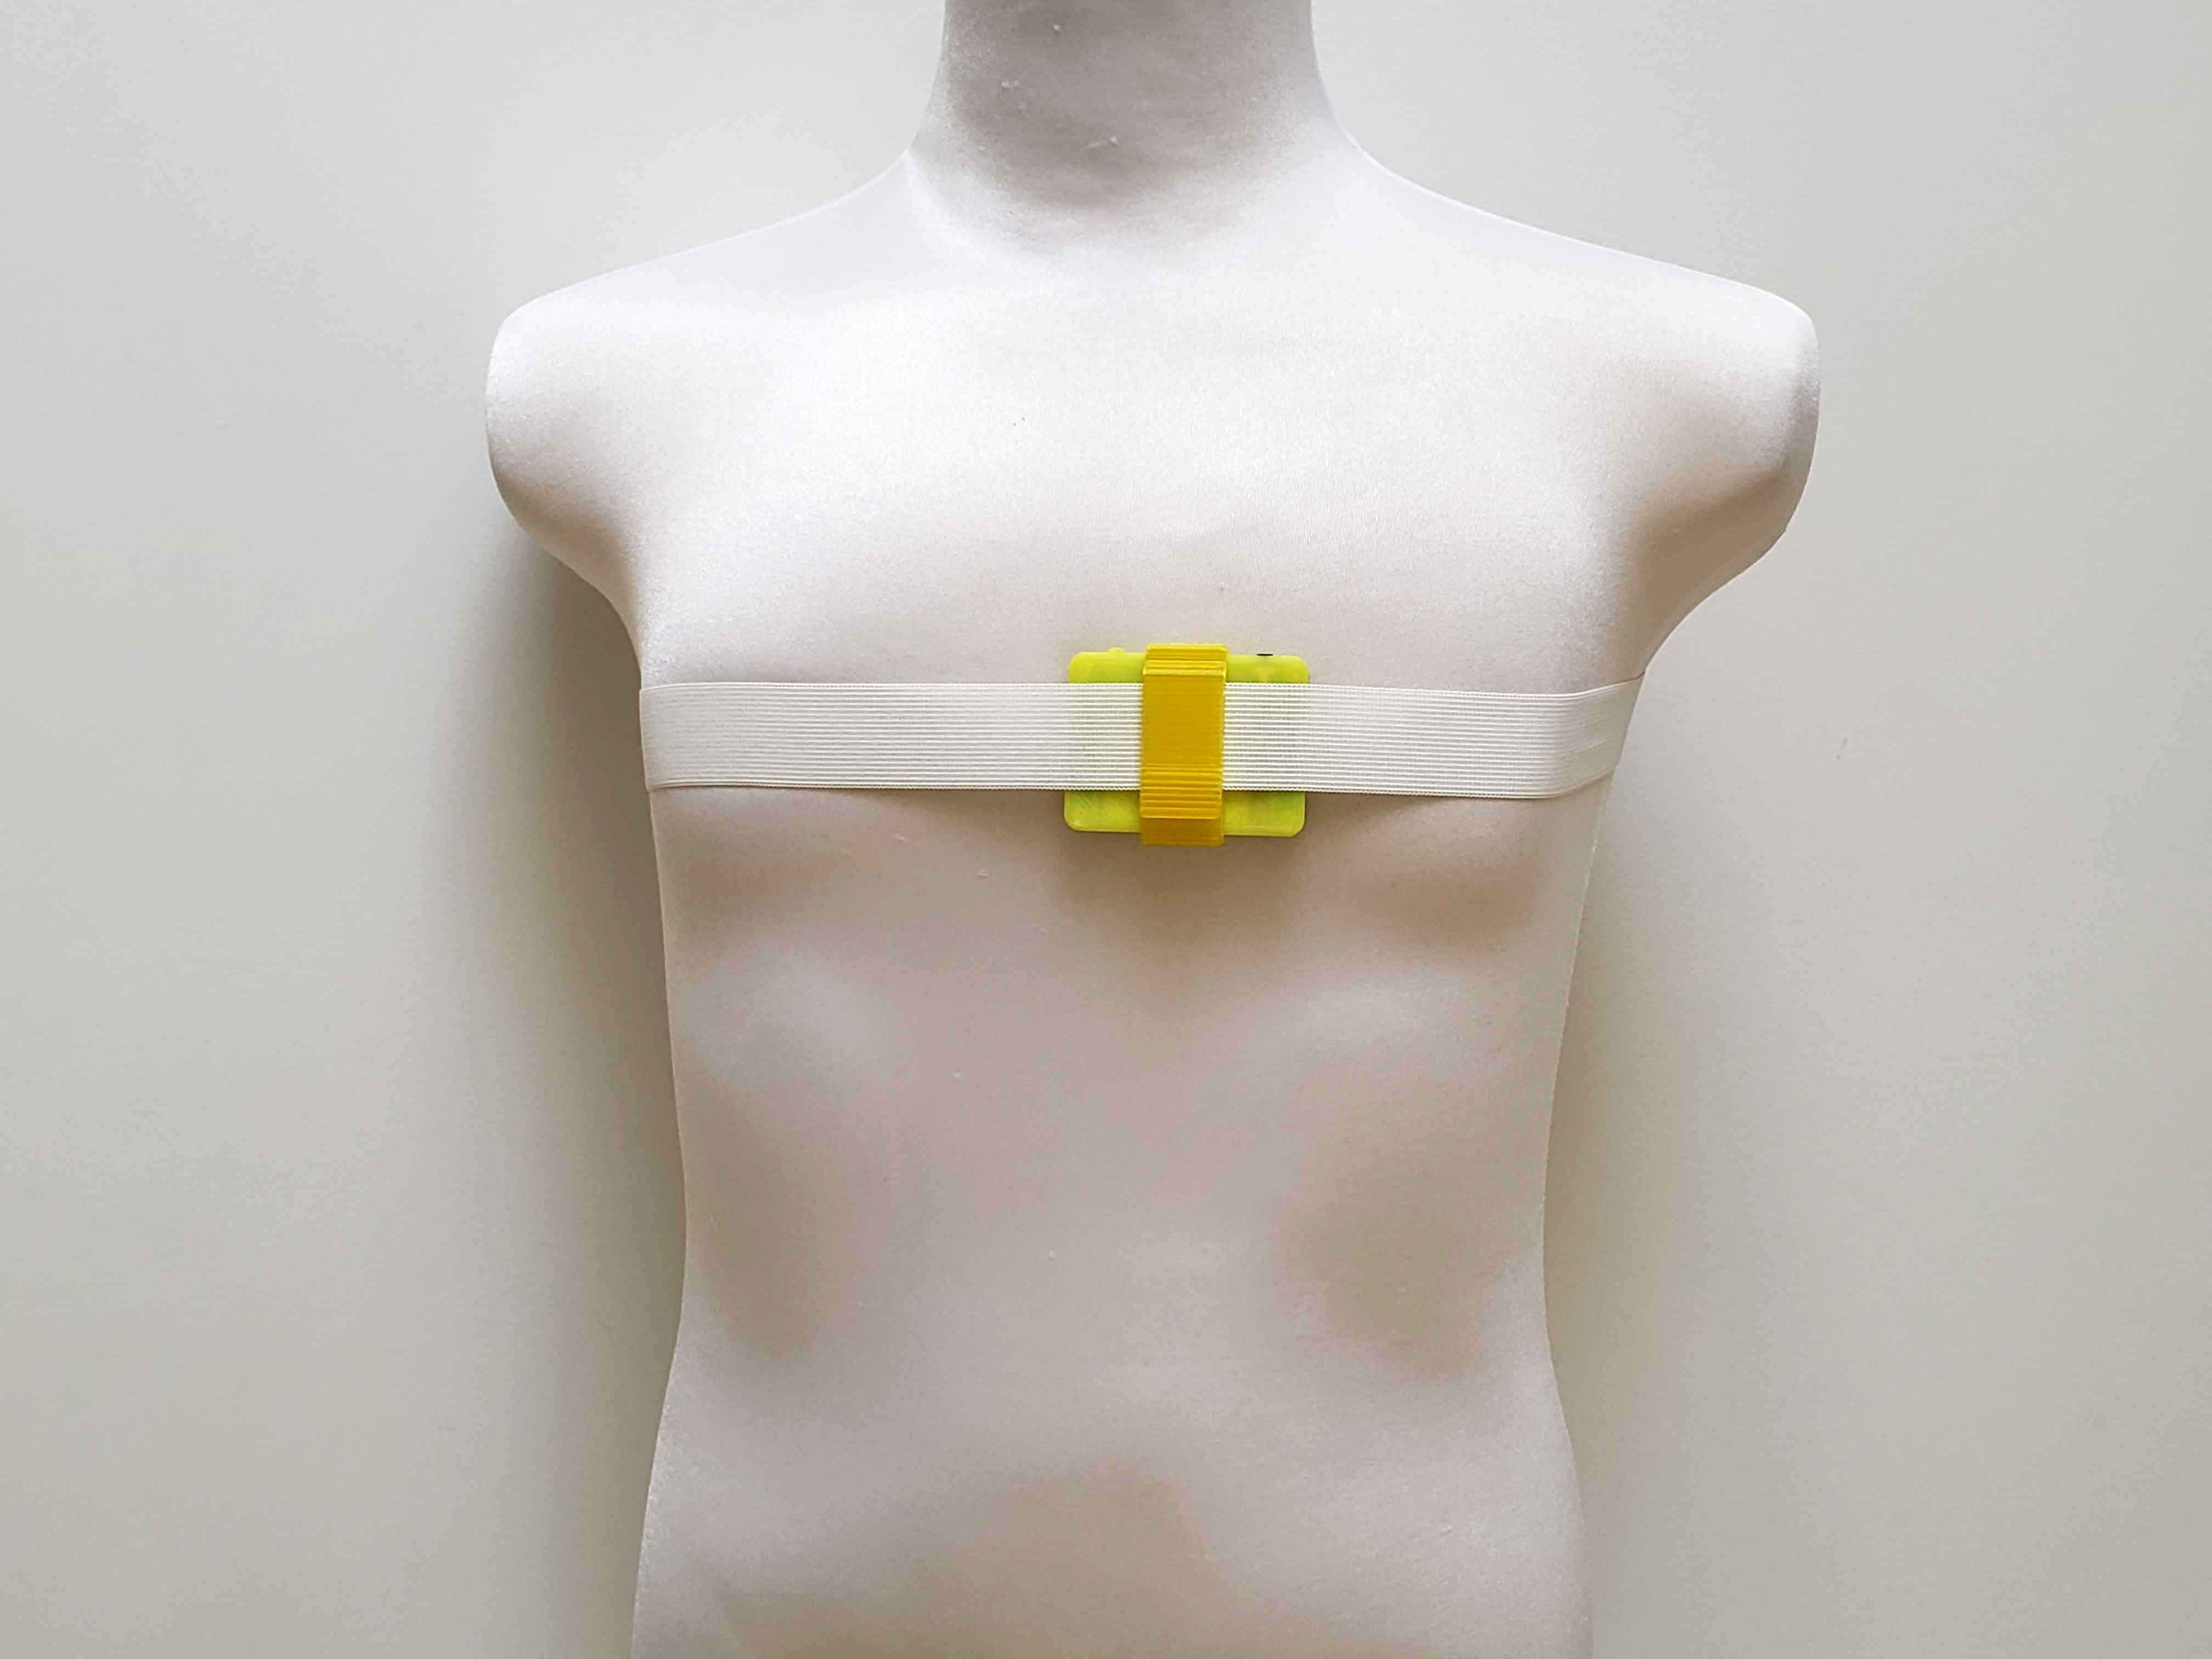
ecg Capture in ‘Heart Mode’ with Black Elastic Belt – Demo
ecgMonitor is placed next to your heart.
ecg Capture in ‘Heart Mode’ with White Elastic Belt
ecgMonitor is placed next to your heart.
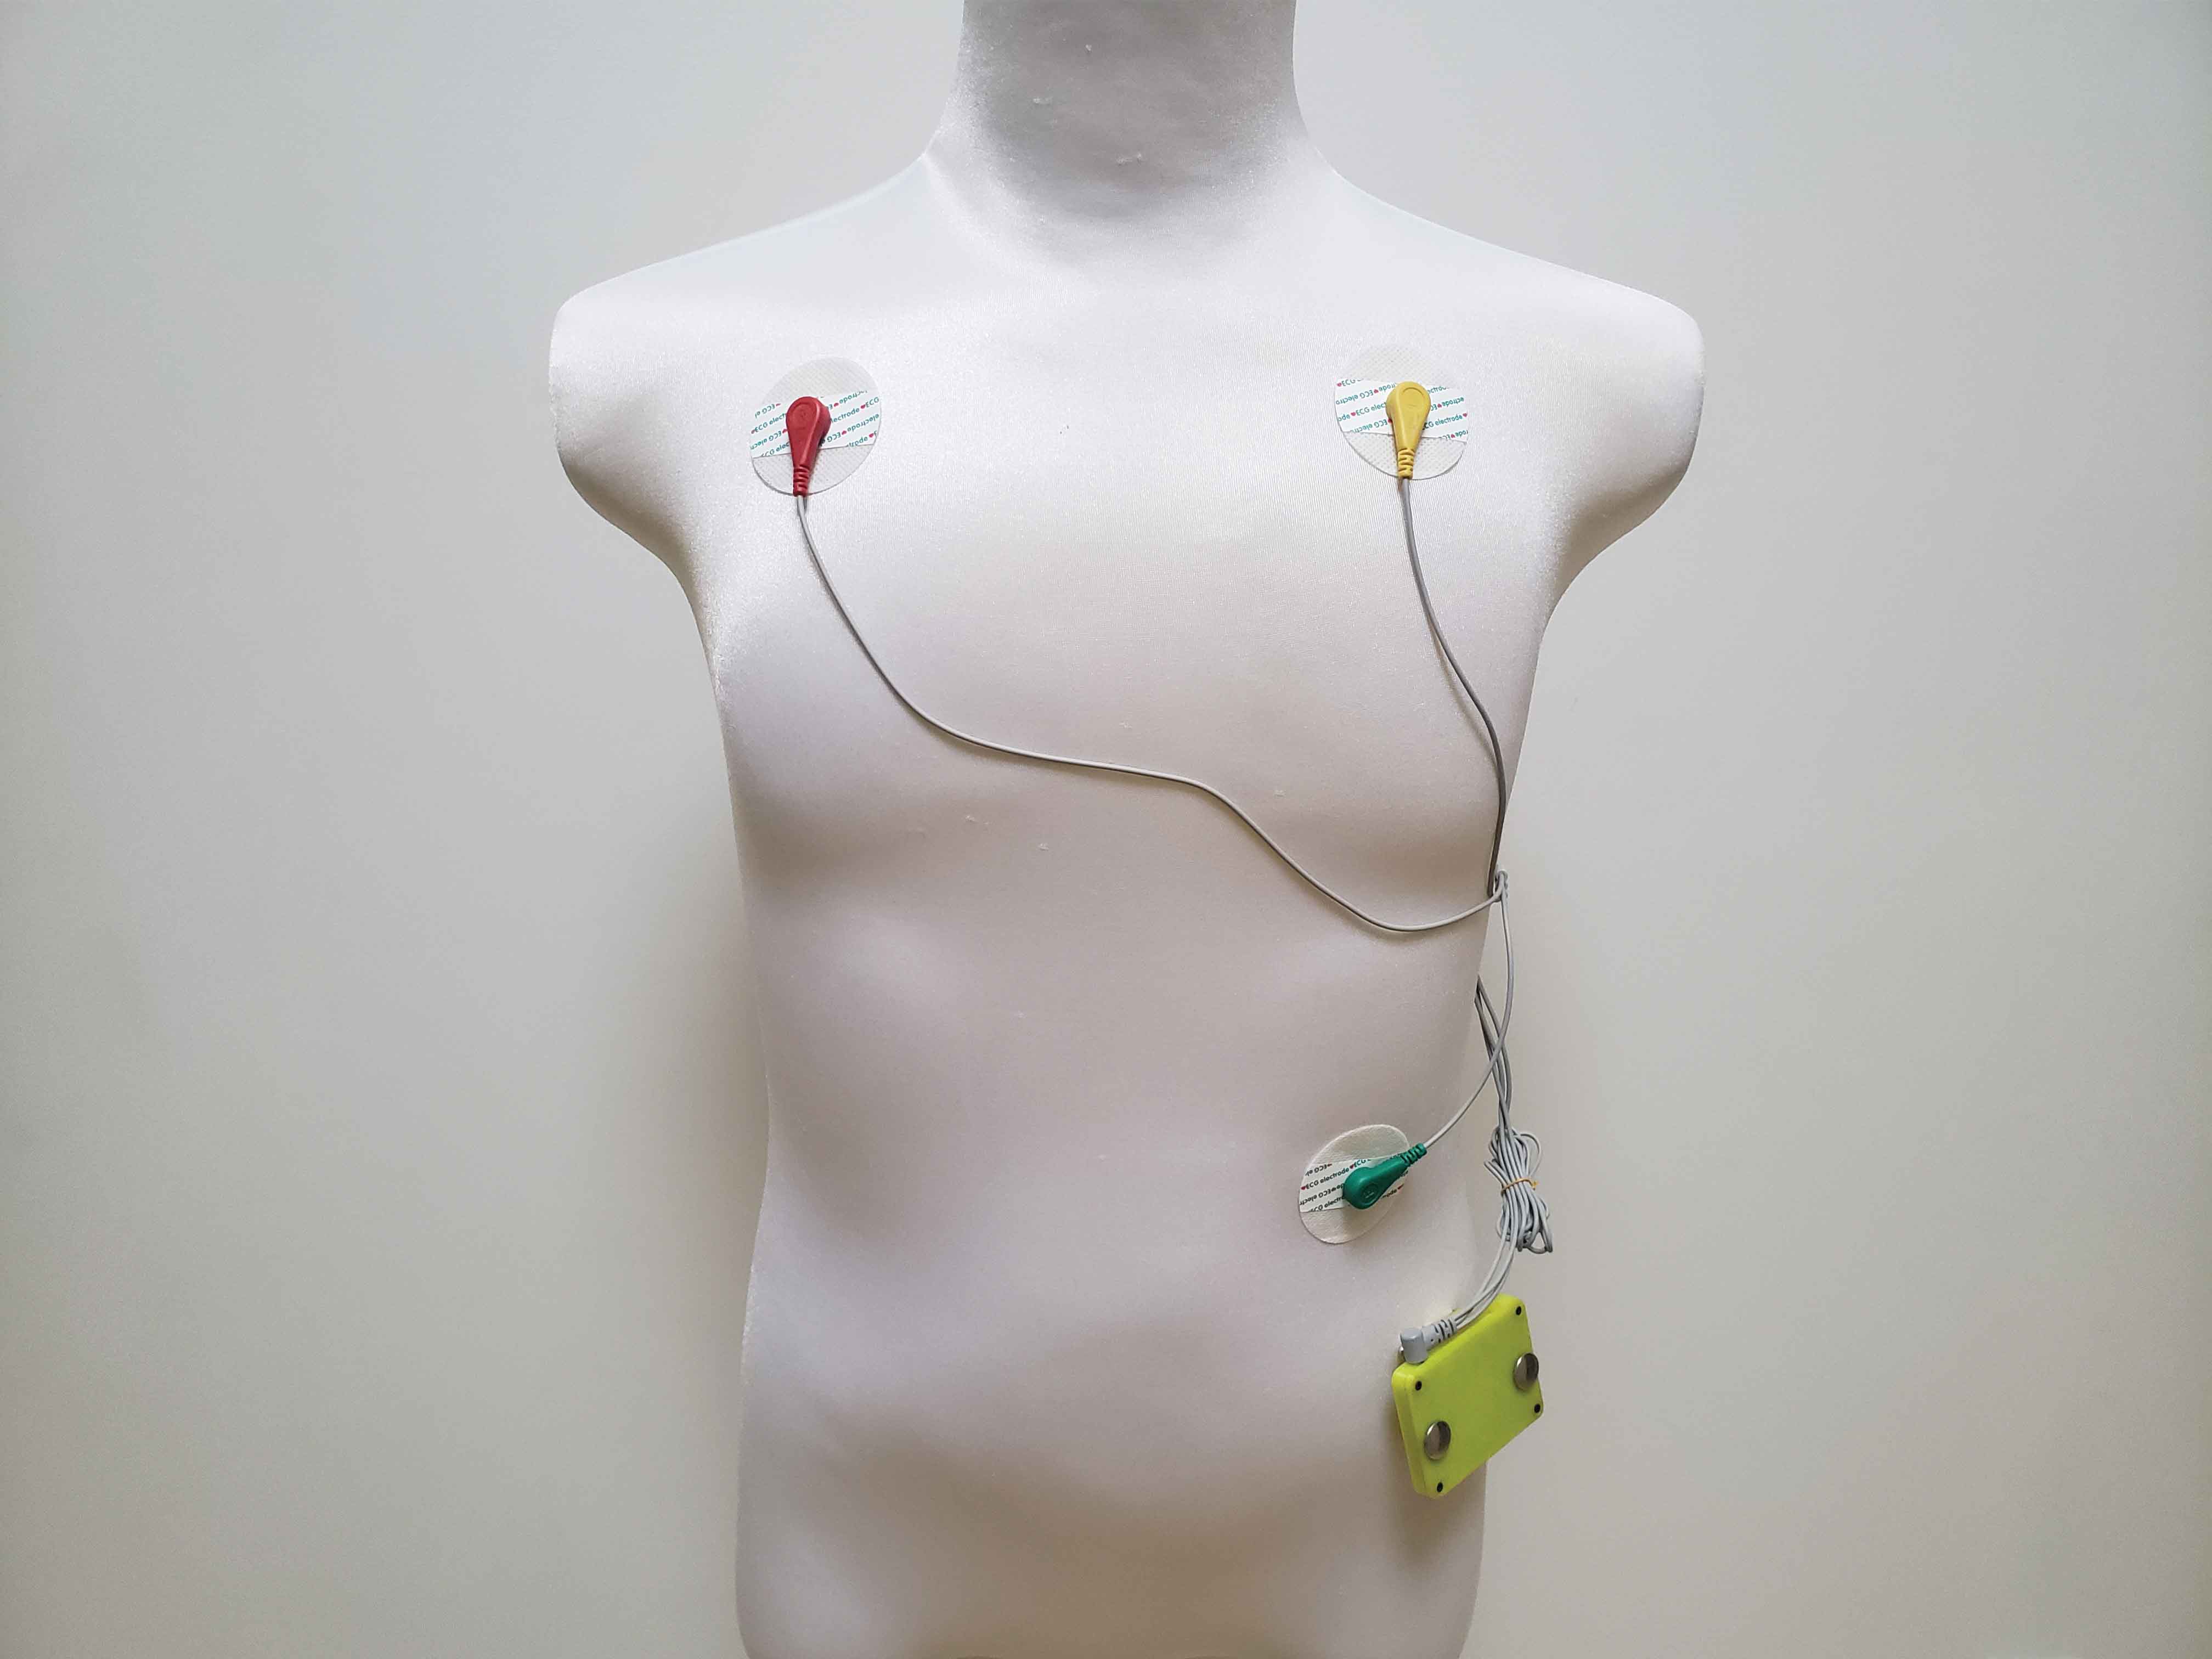
ecg Capture in ‘Cardiac Mode’
Three leads electrode are connected to right, left arm and right leg.
Pilot run & Final Test
3 Years Project Development
– Software Development
– Hardware Development
– Firmware Development
– Mechanical Design
– R & D
– Evaluation
– Implementation
– Test Run
December 2017
ECG Real Time Capture Demo – Client with high HRV
Client with high HRV – Heart Rate Variability
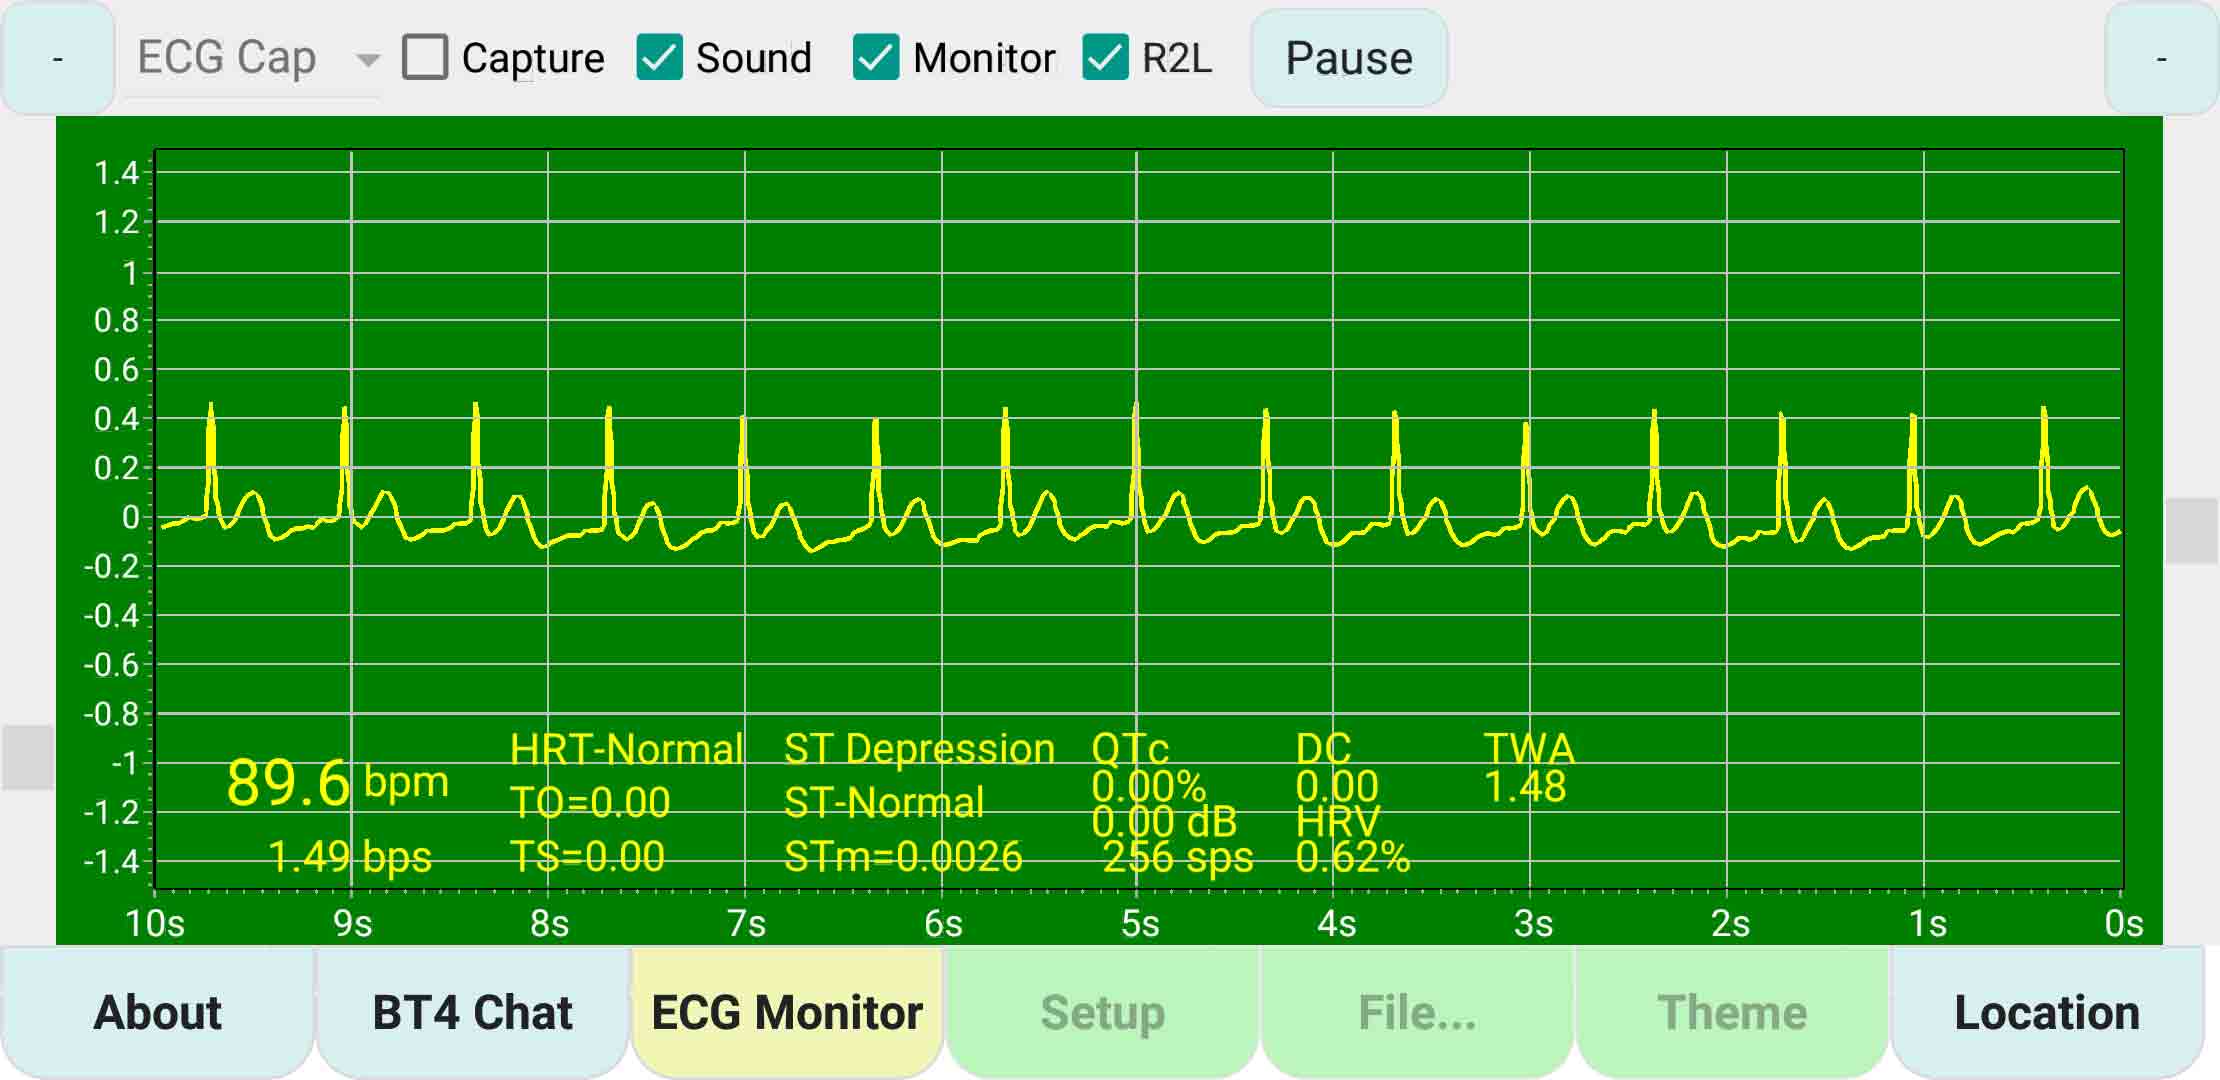
ECG Real Time Capture Demo – ‘89.6bpm 256sps’
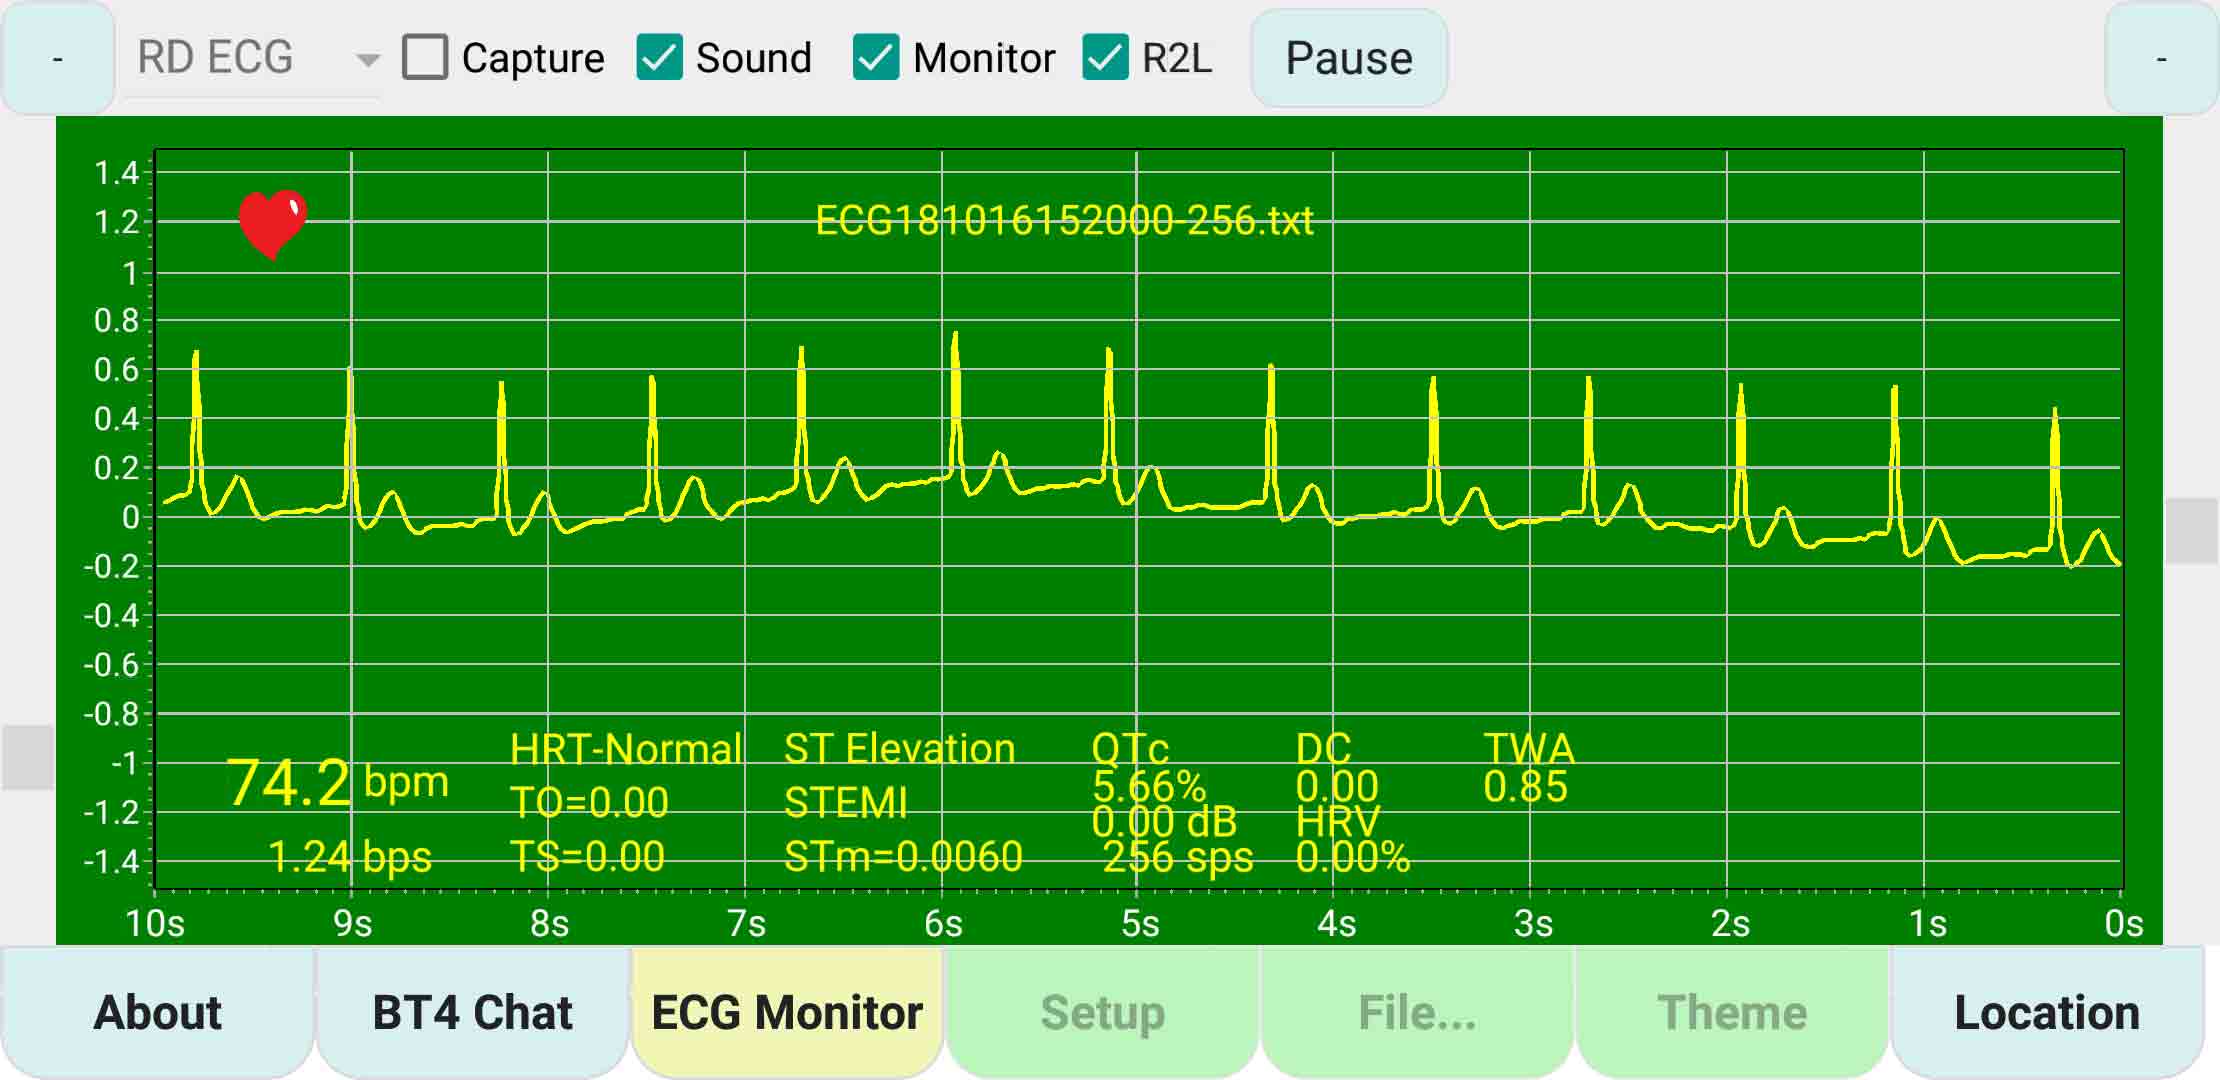
ECG Real Time Capture Demo – ‘Read ECG File in 256sps’
Client with Motion Artifacts
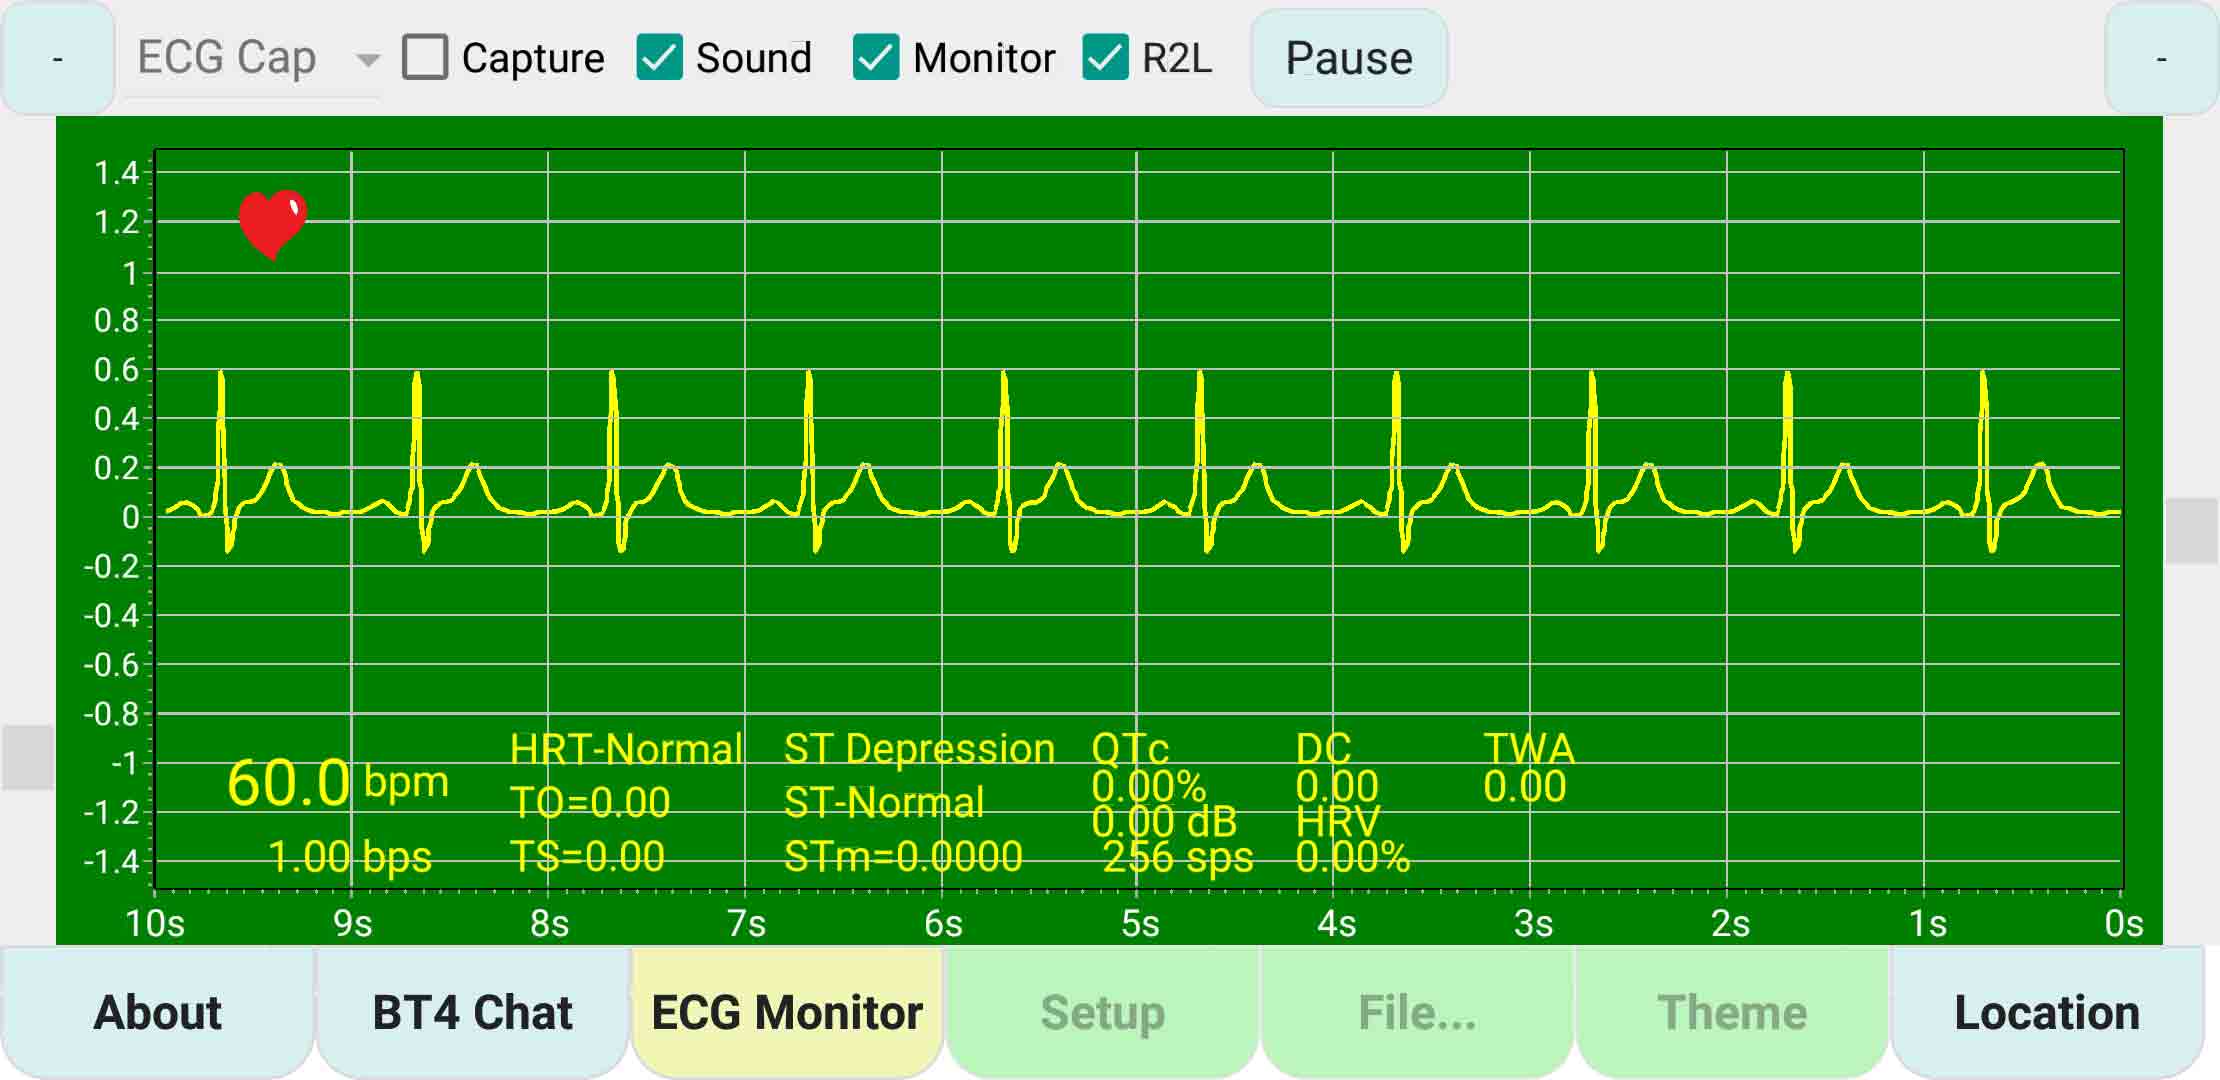
Capture Demo – ‘ECG Human Simulation’
Capture Demo – ‘ECG Human Simulation’
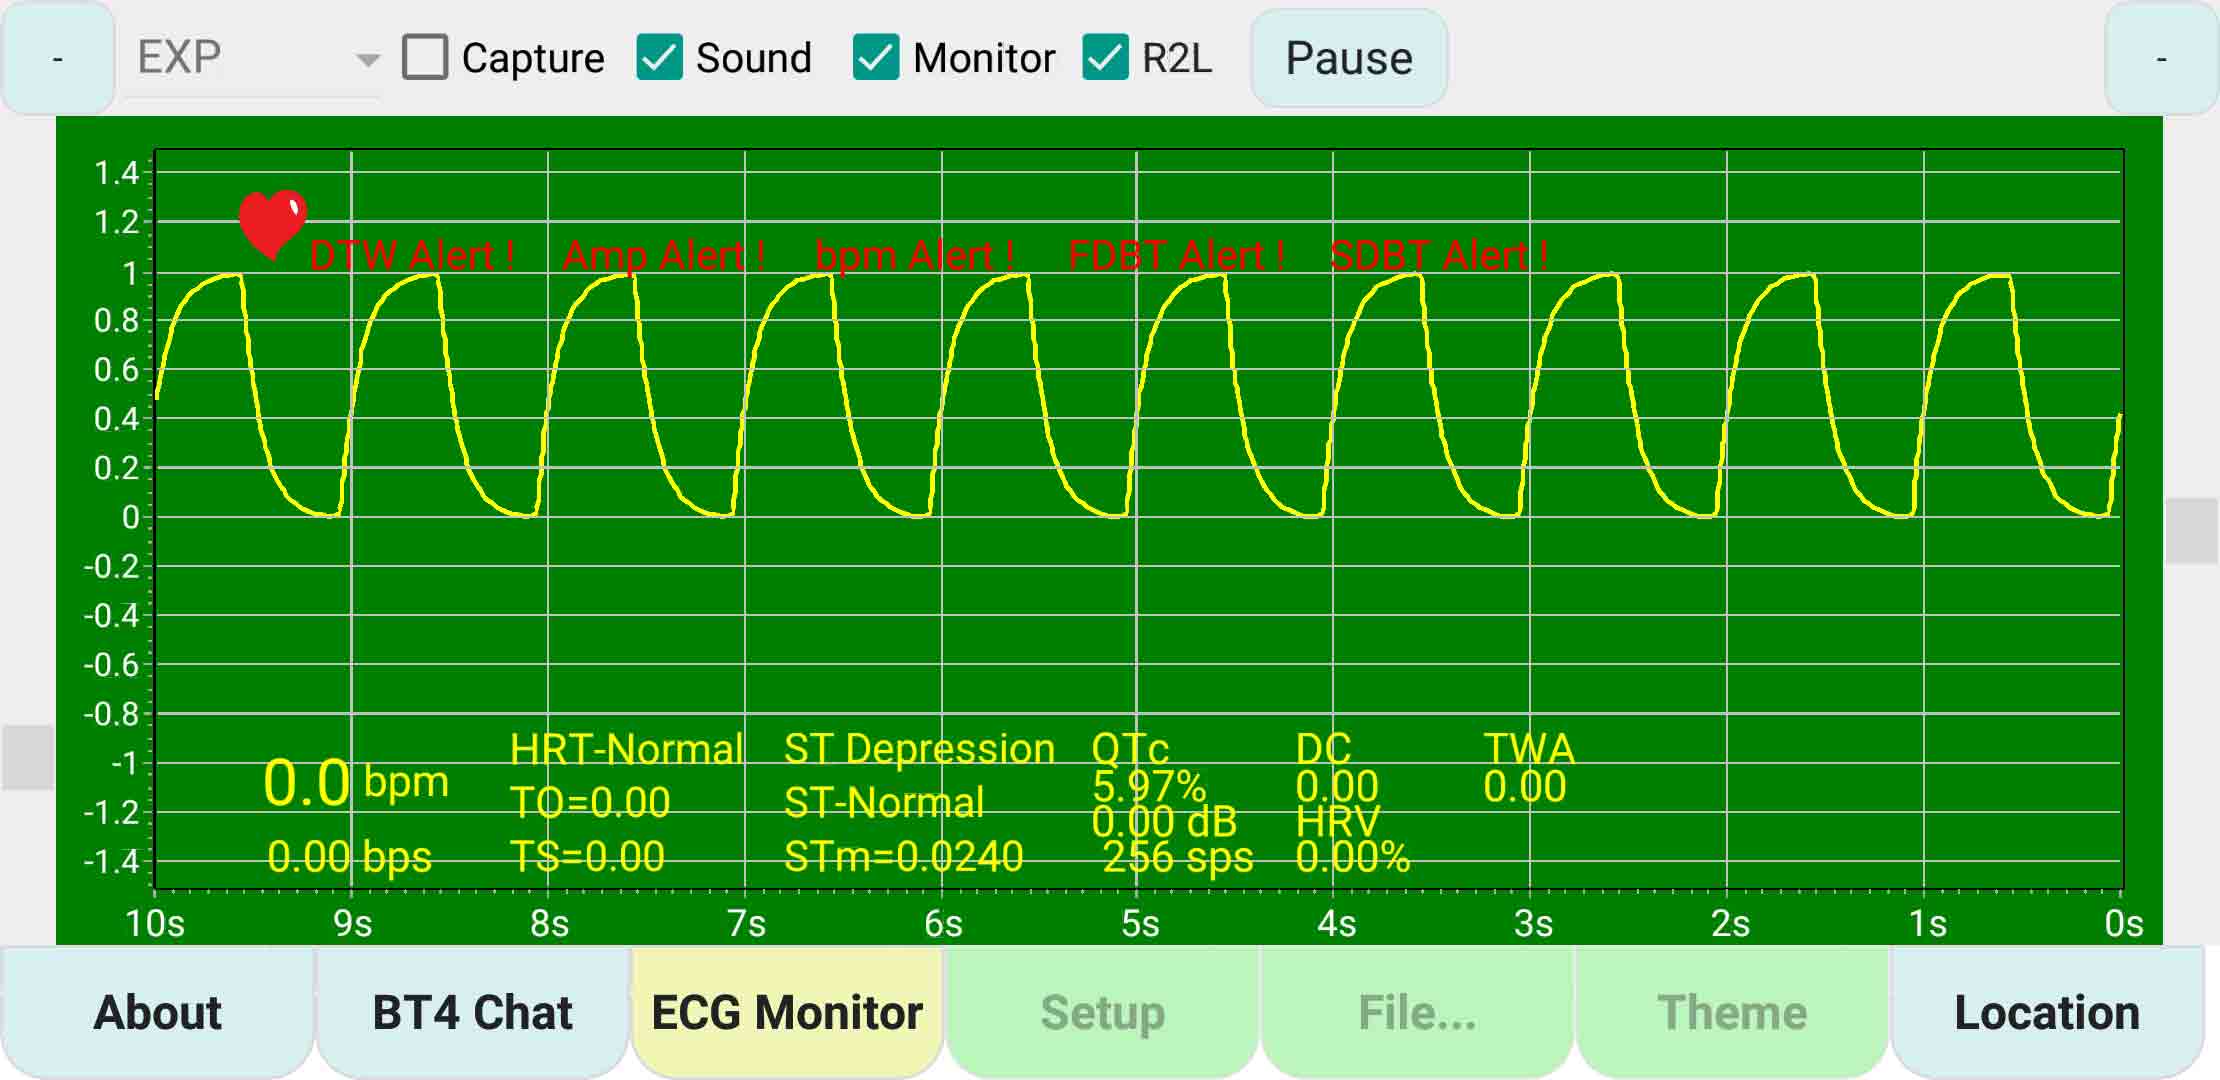
Capture Demo – ‘Exponential Wave’
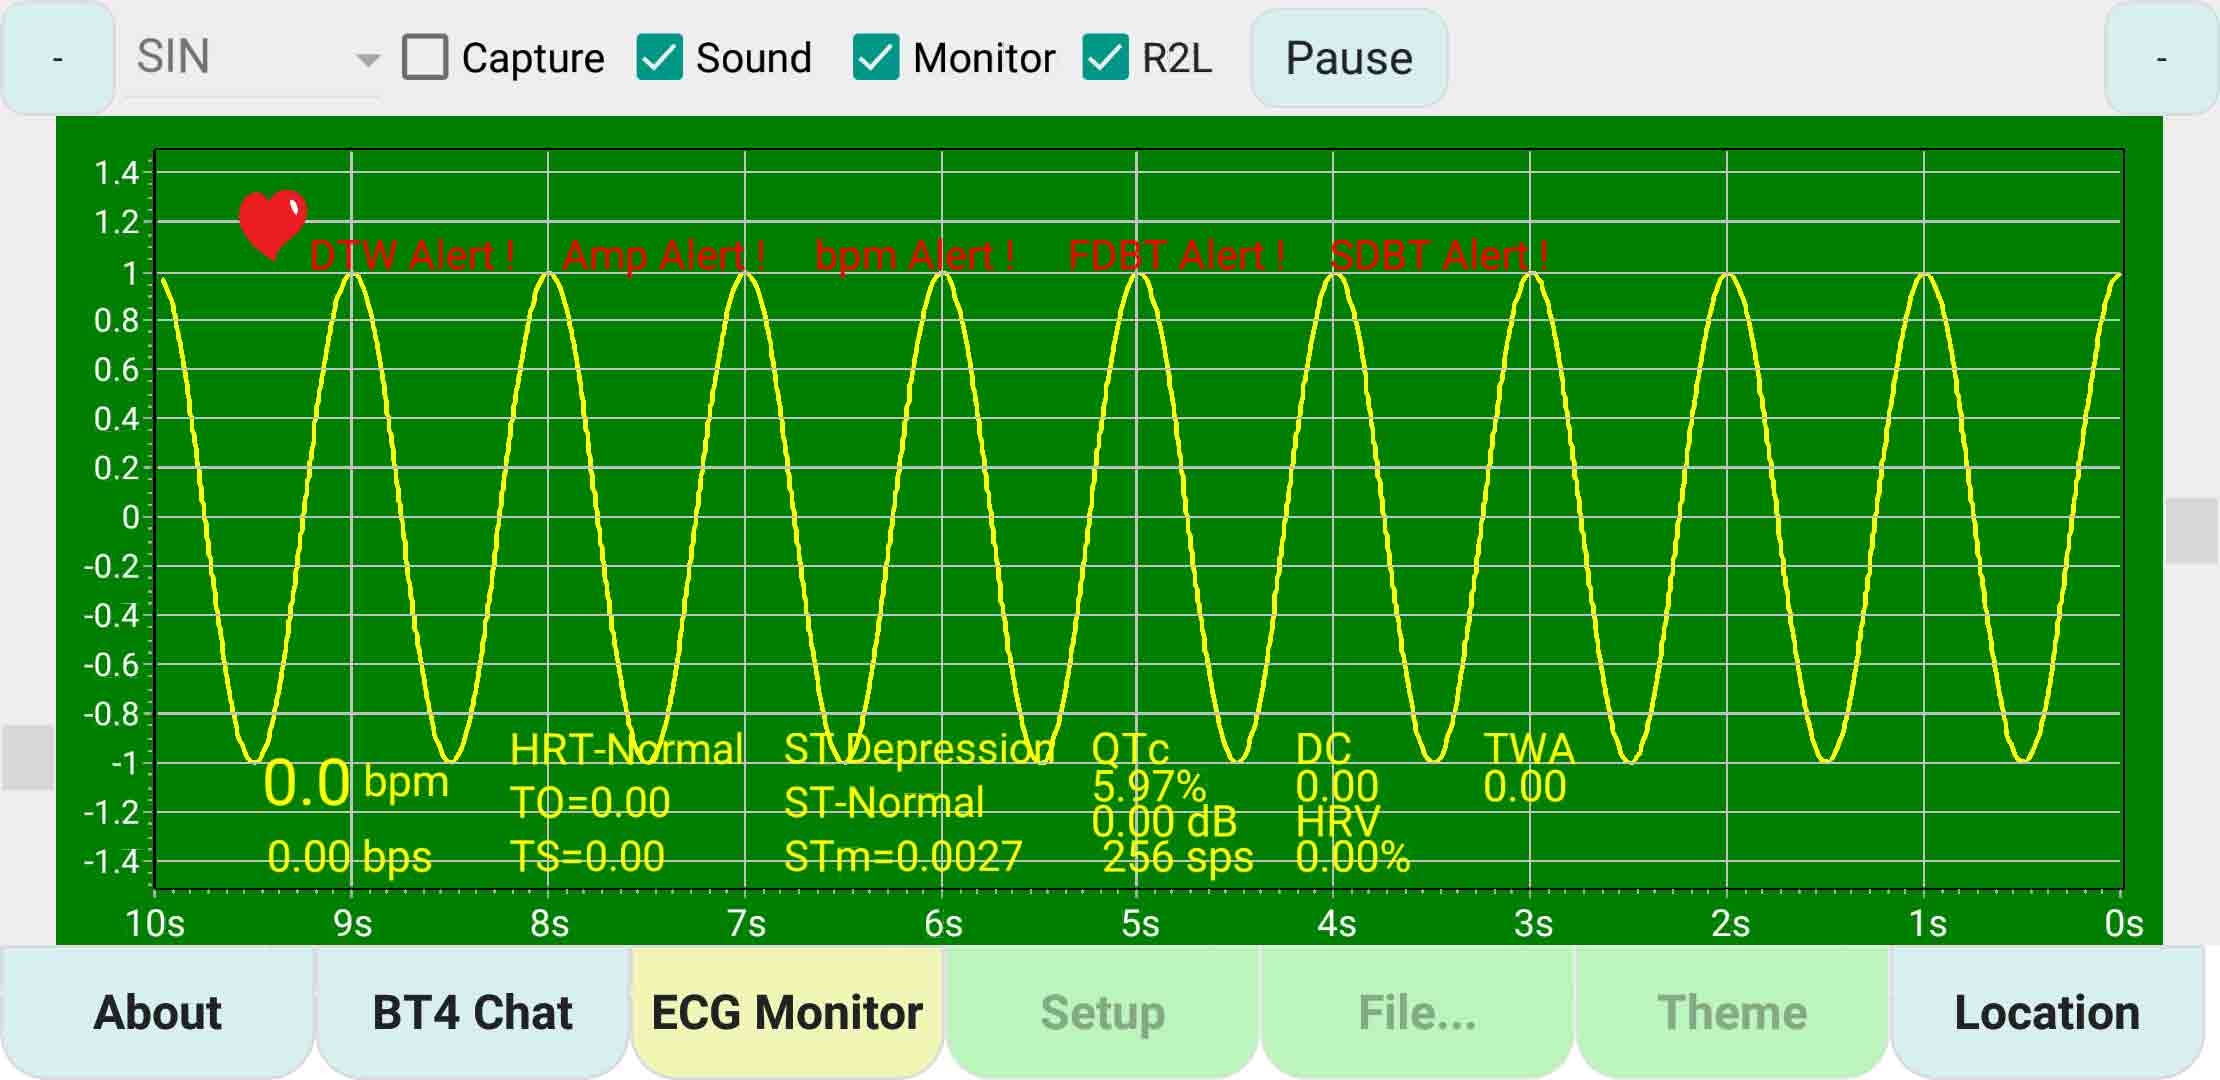
Capture Demo – ‘Sine Wave’
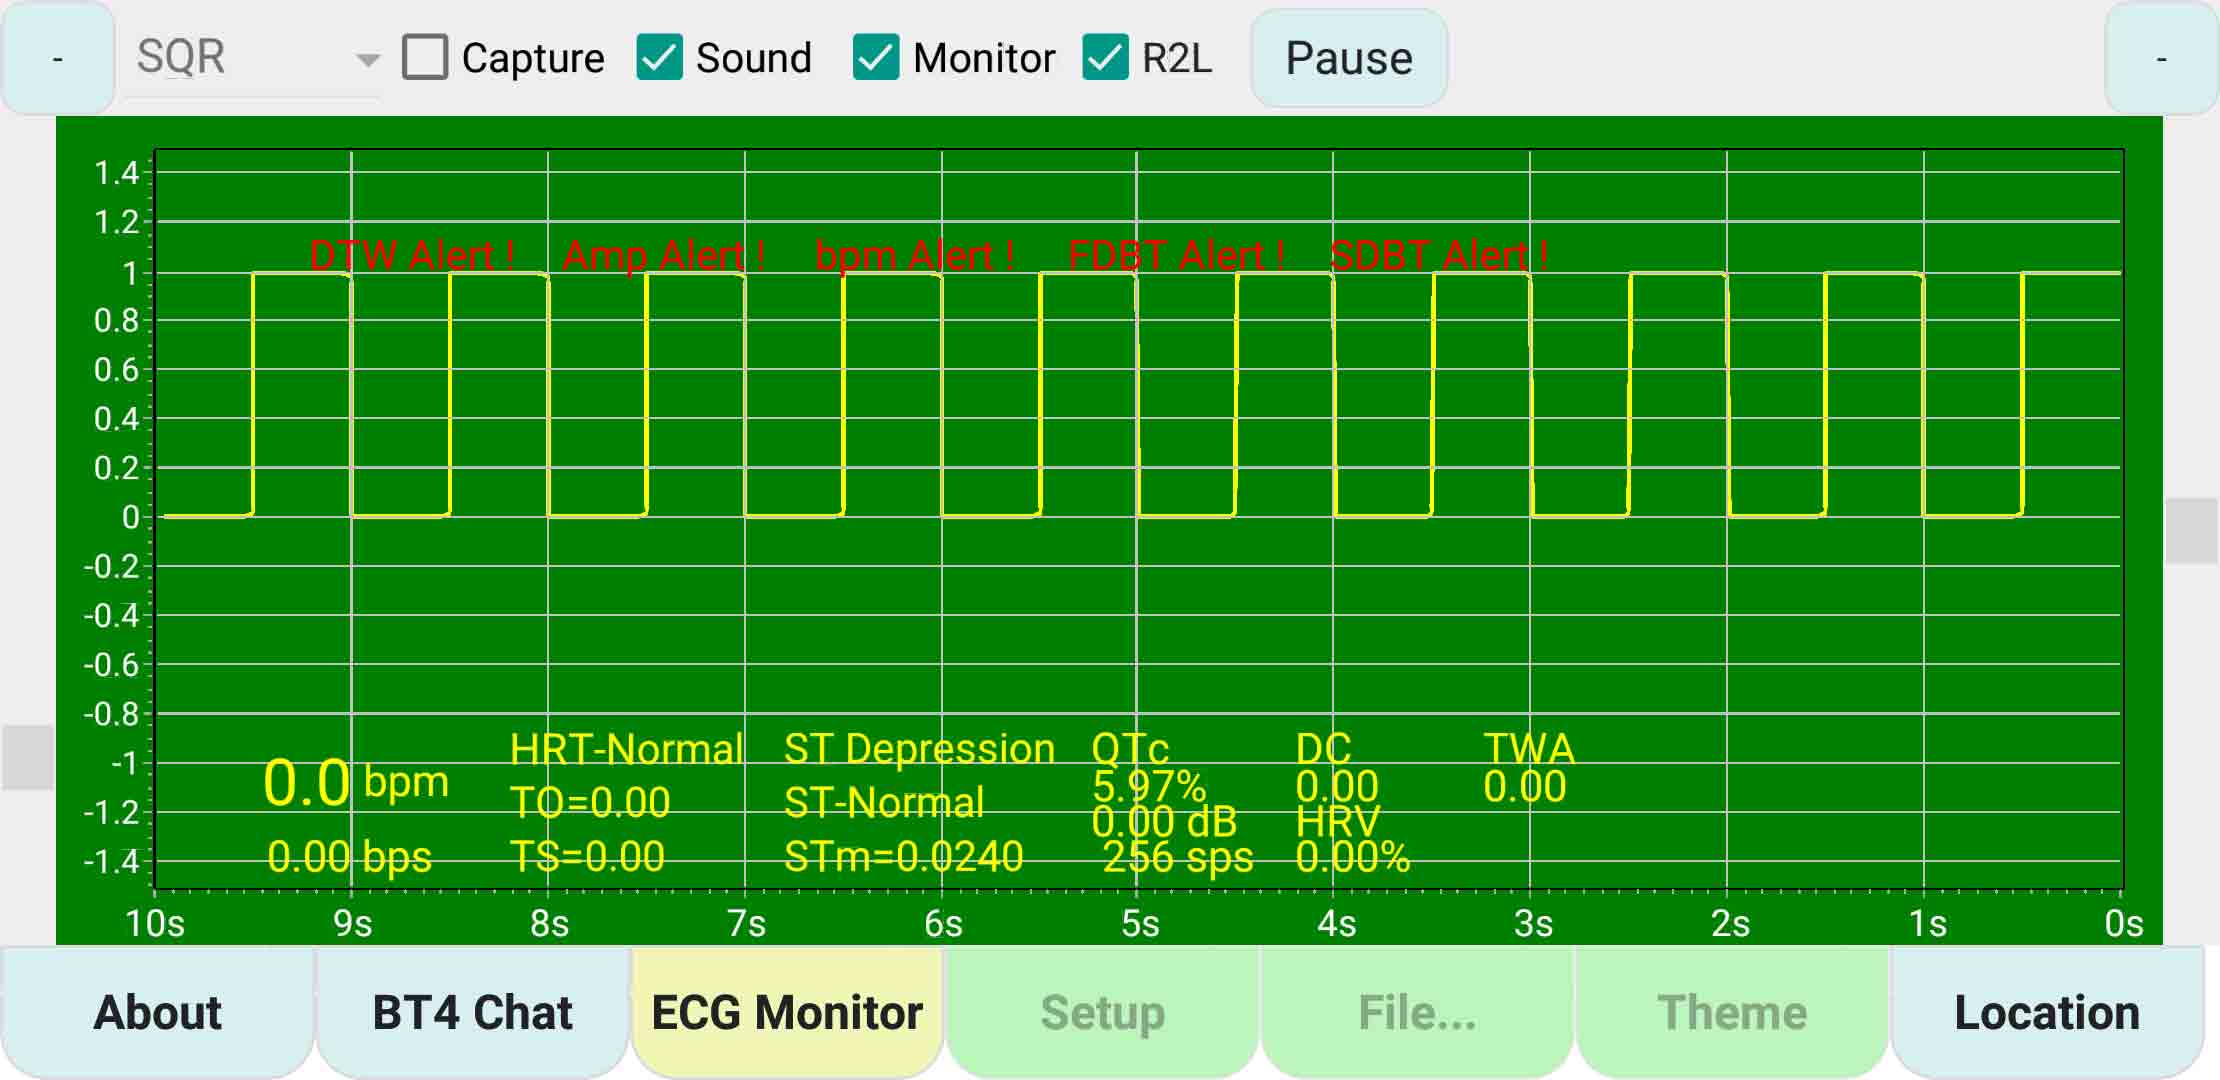
Capture Demo – ‘Square Wave’
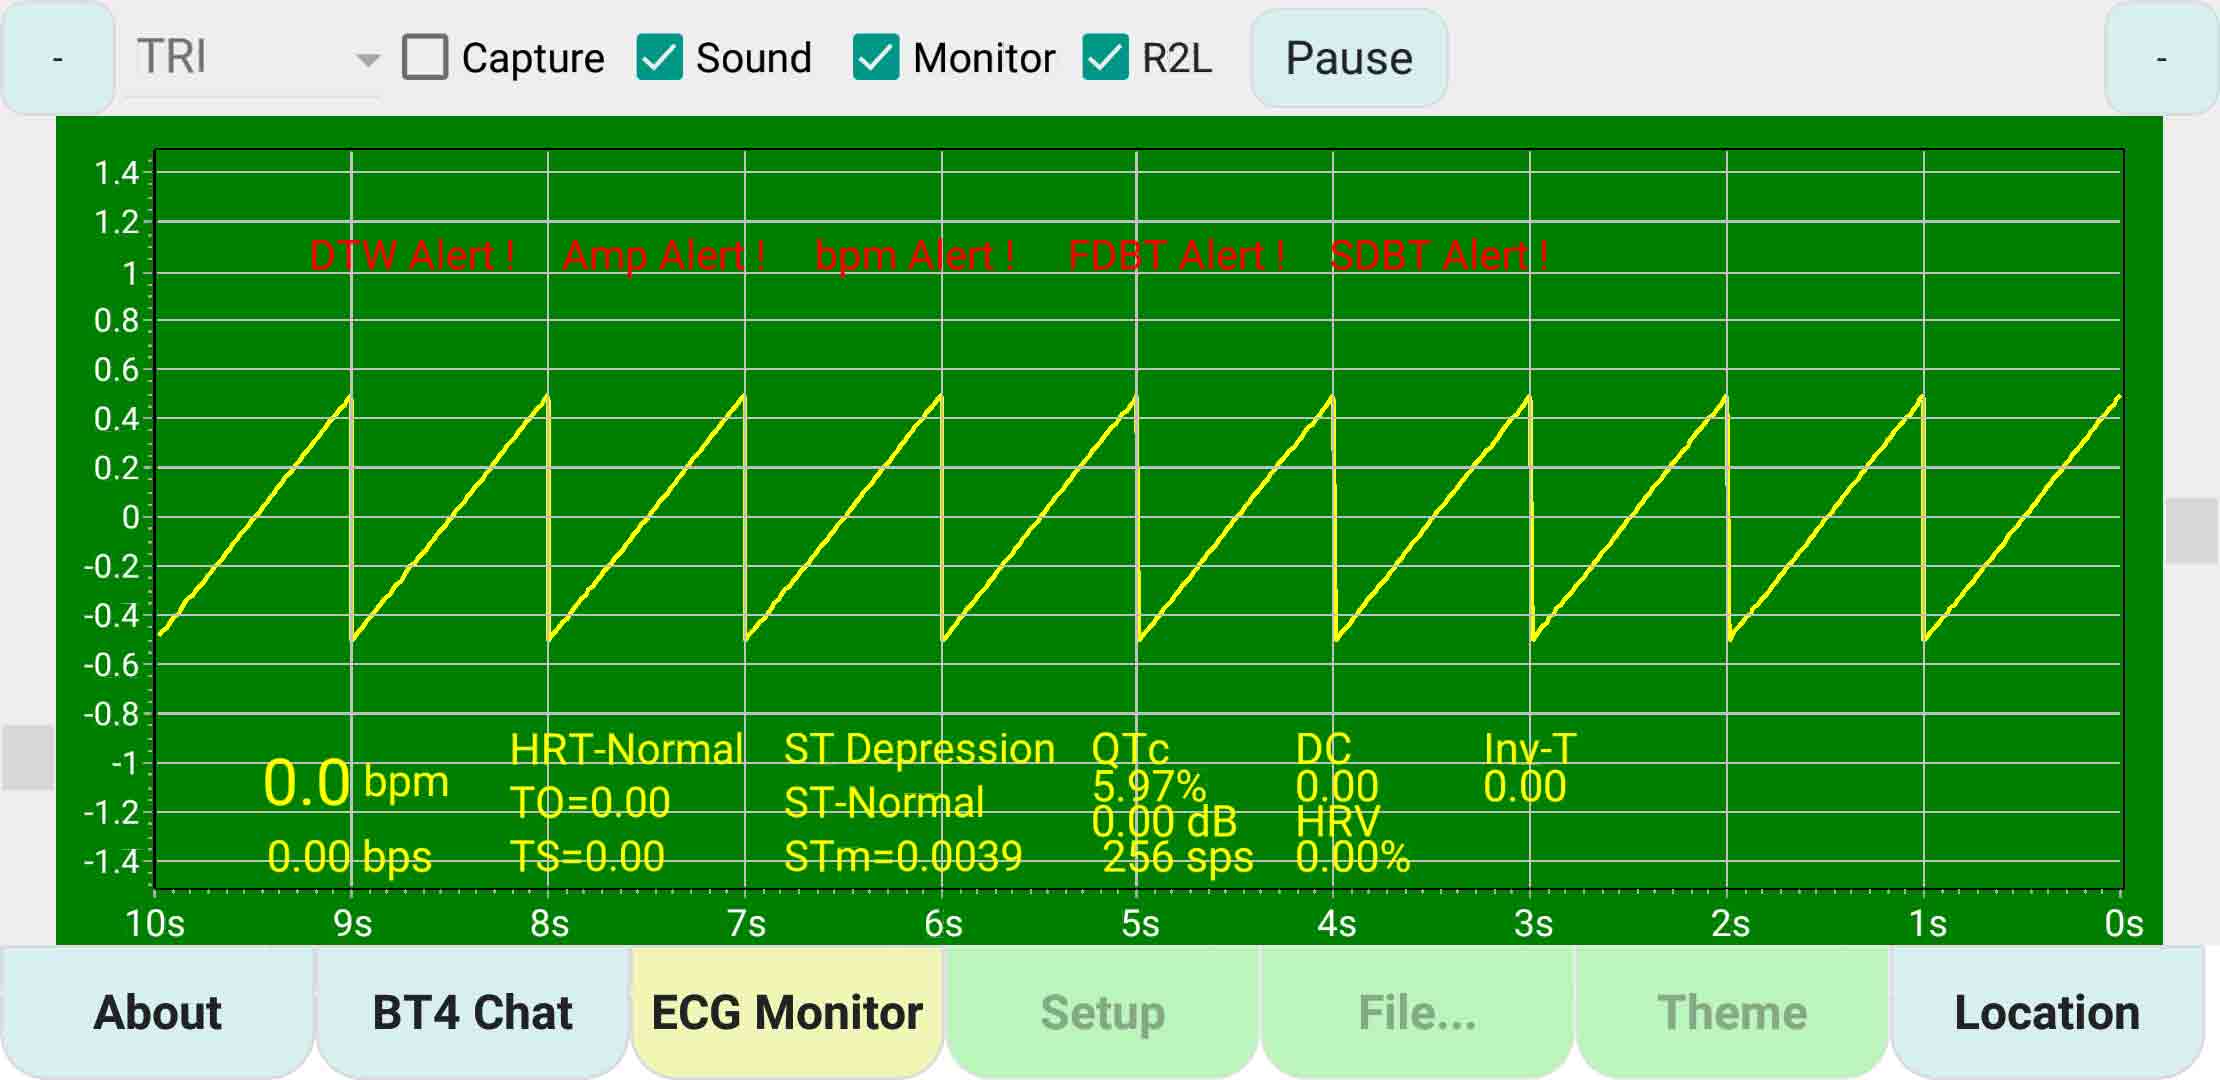
Capture Demo – ‘Saw Tooth Wave’
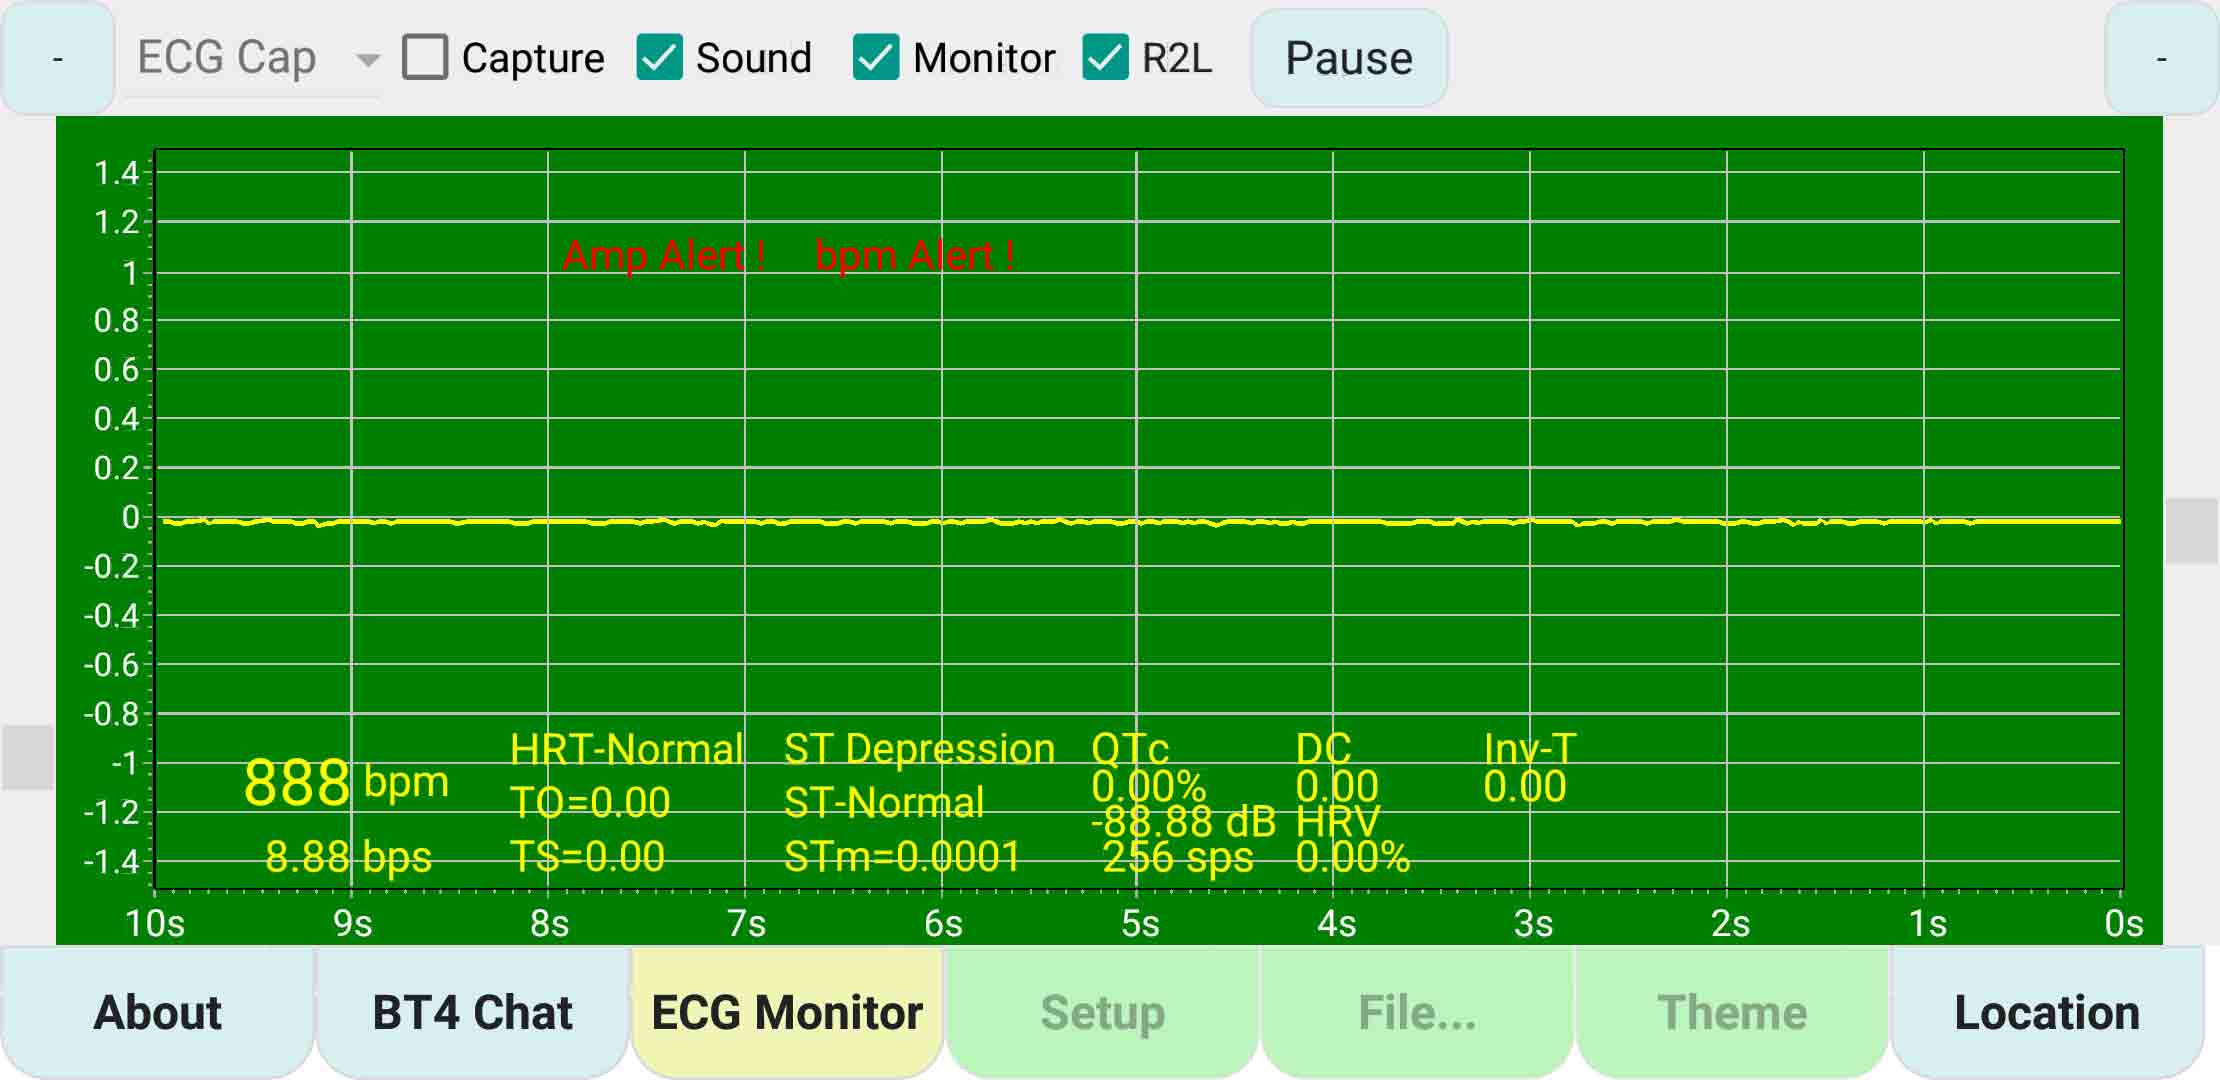
Capture Demo – ‘Grounding Noise’
Capture Demo – ’50Hz/60Hz Noise’
Debugging & Test Run
October 2017
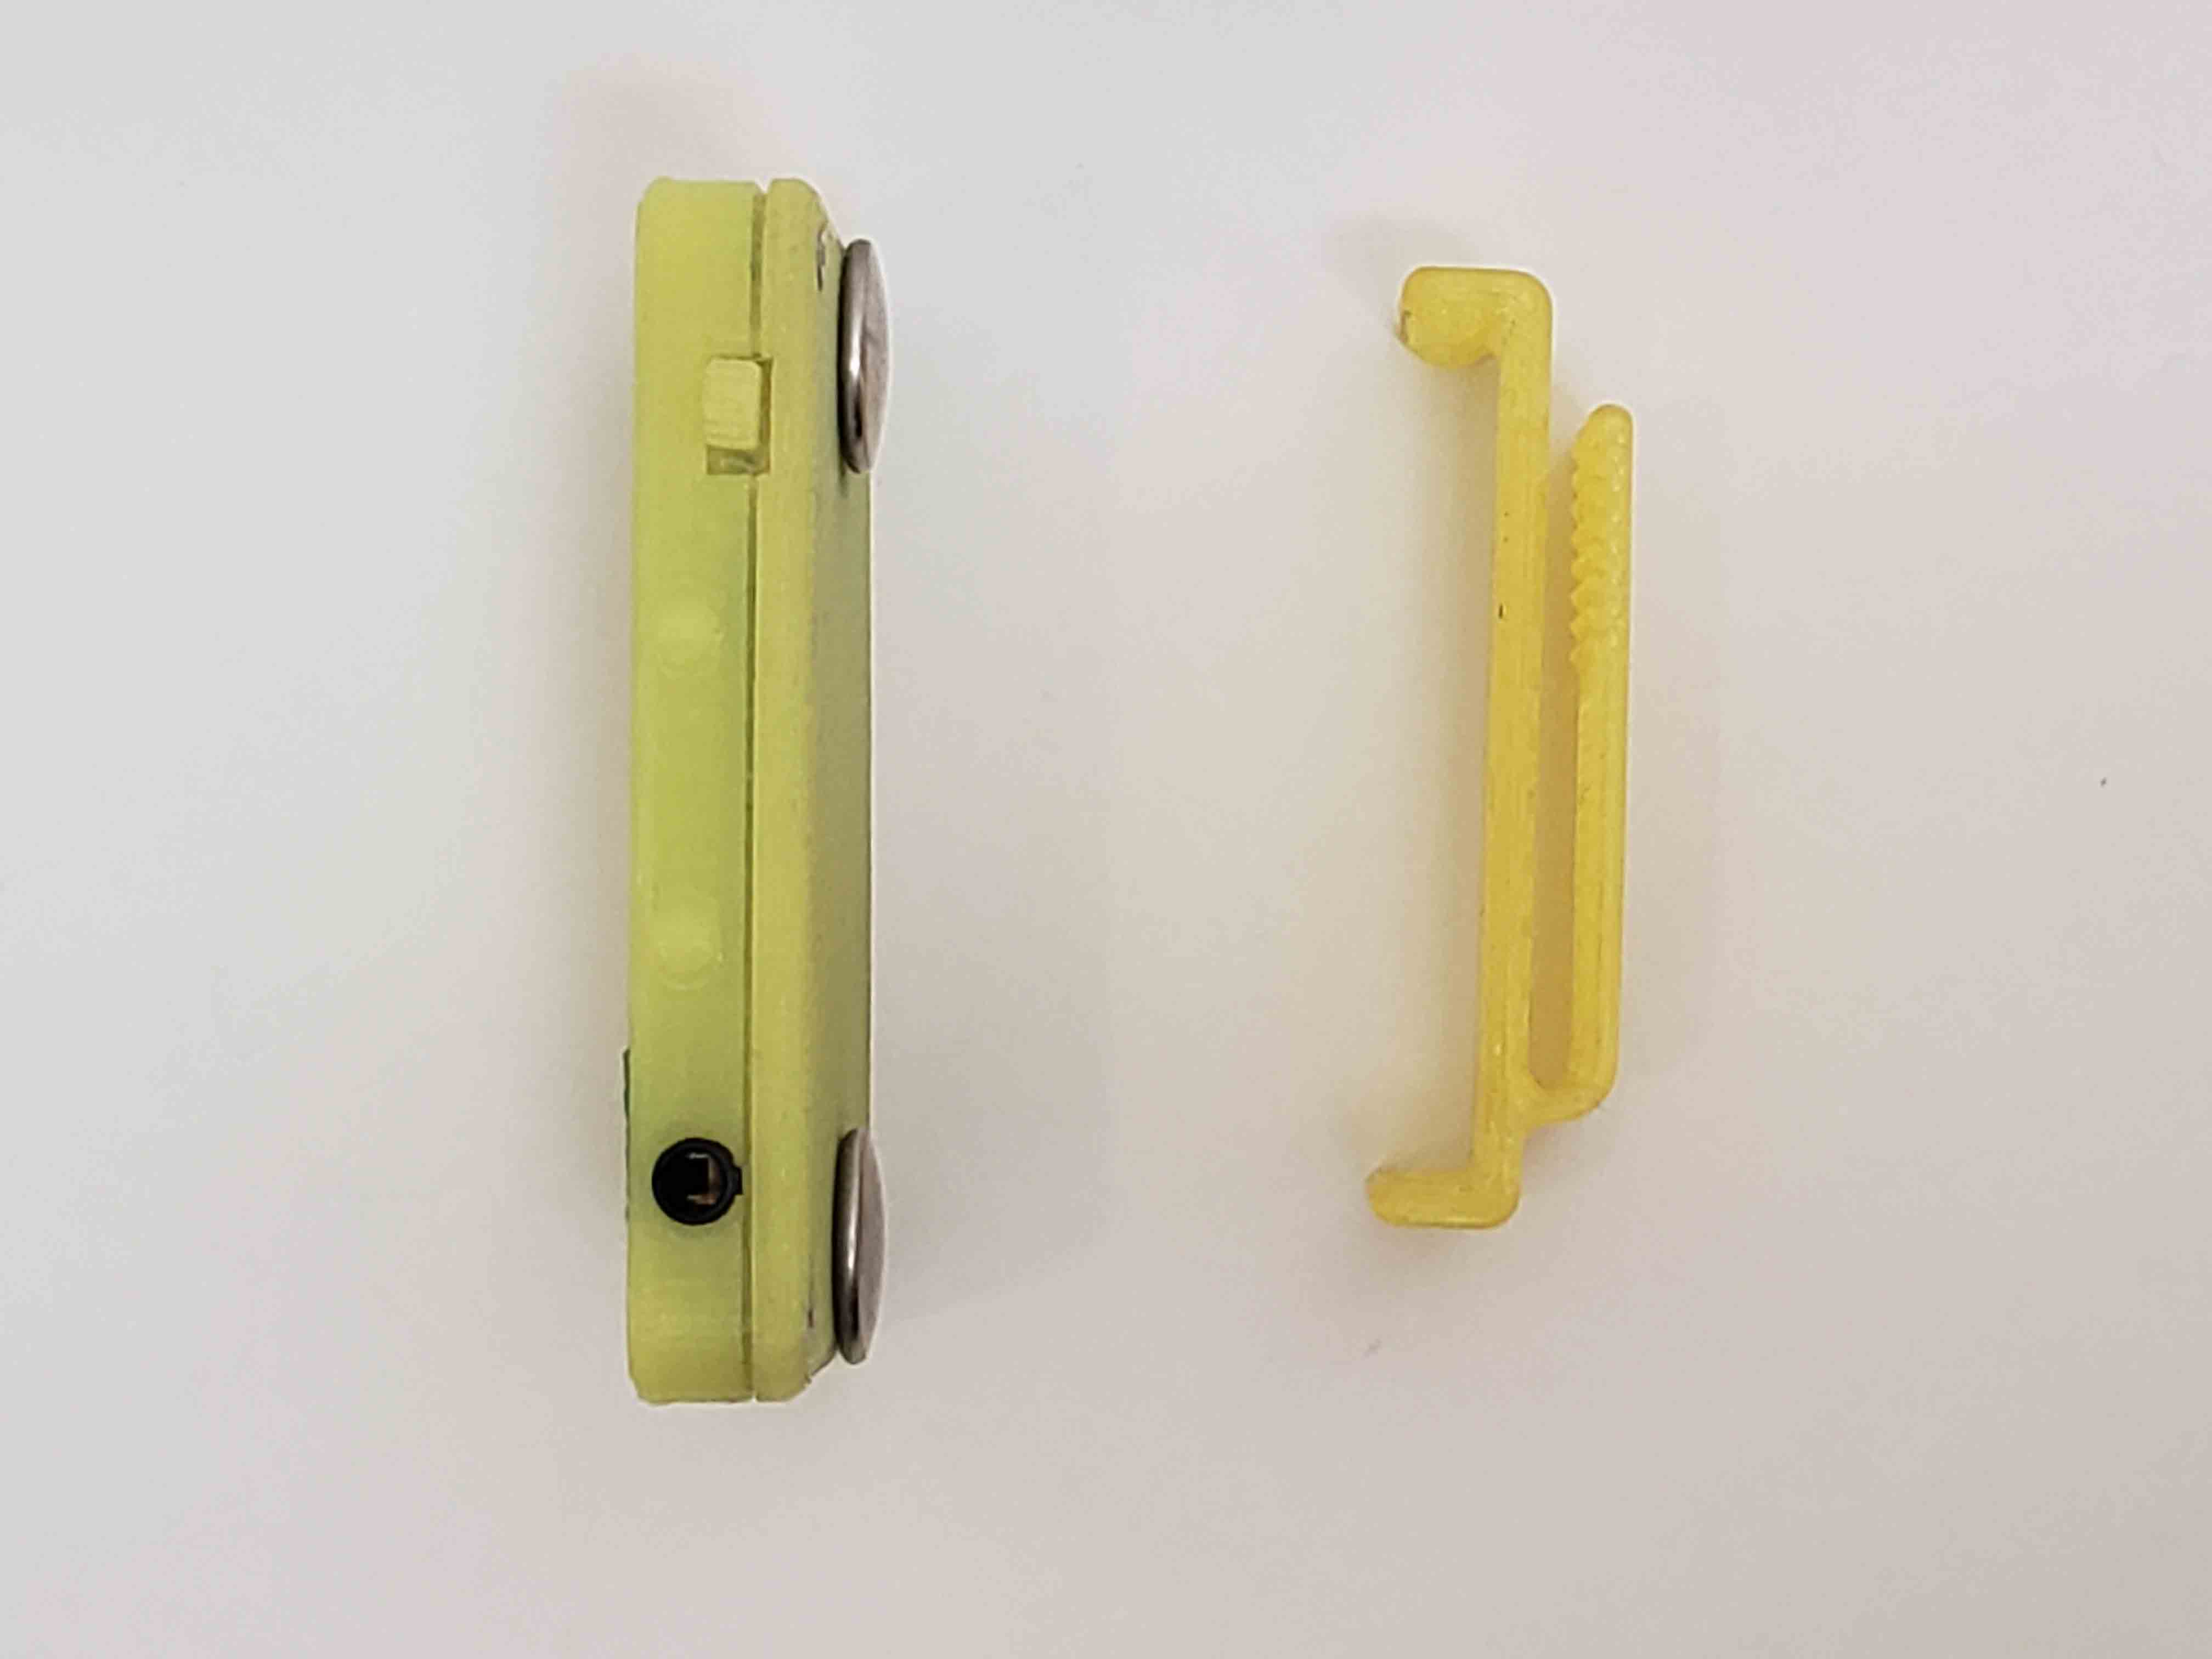
Final Prototype ecgMonitor & Clip
Final Prototype Assembly
September 2017
Final Prototype Assembly
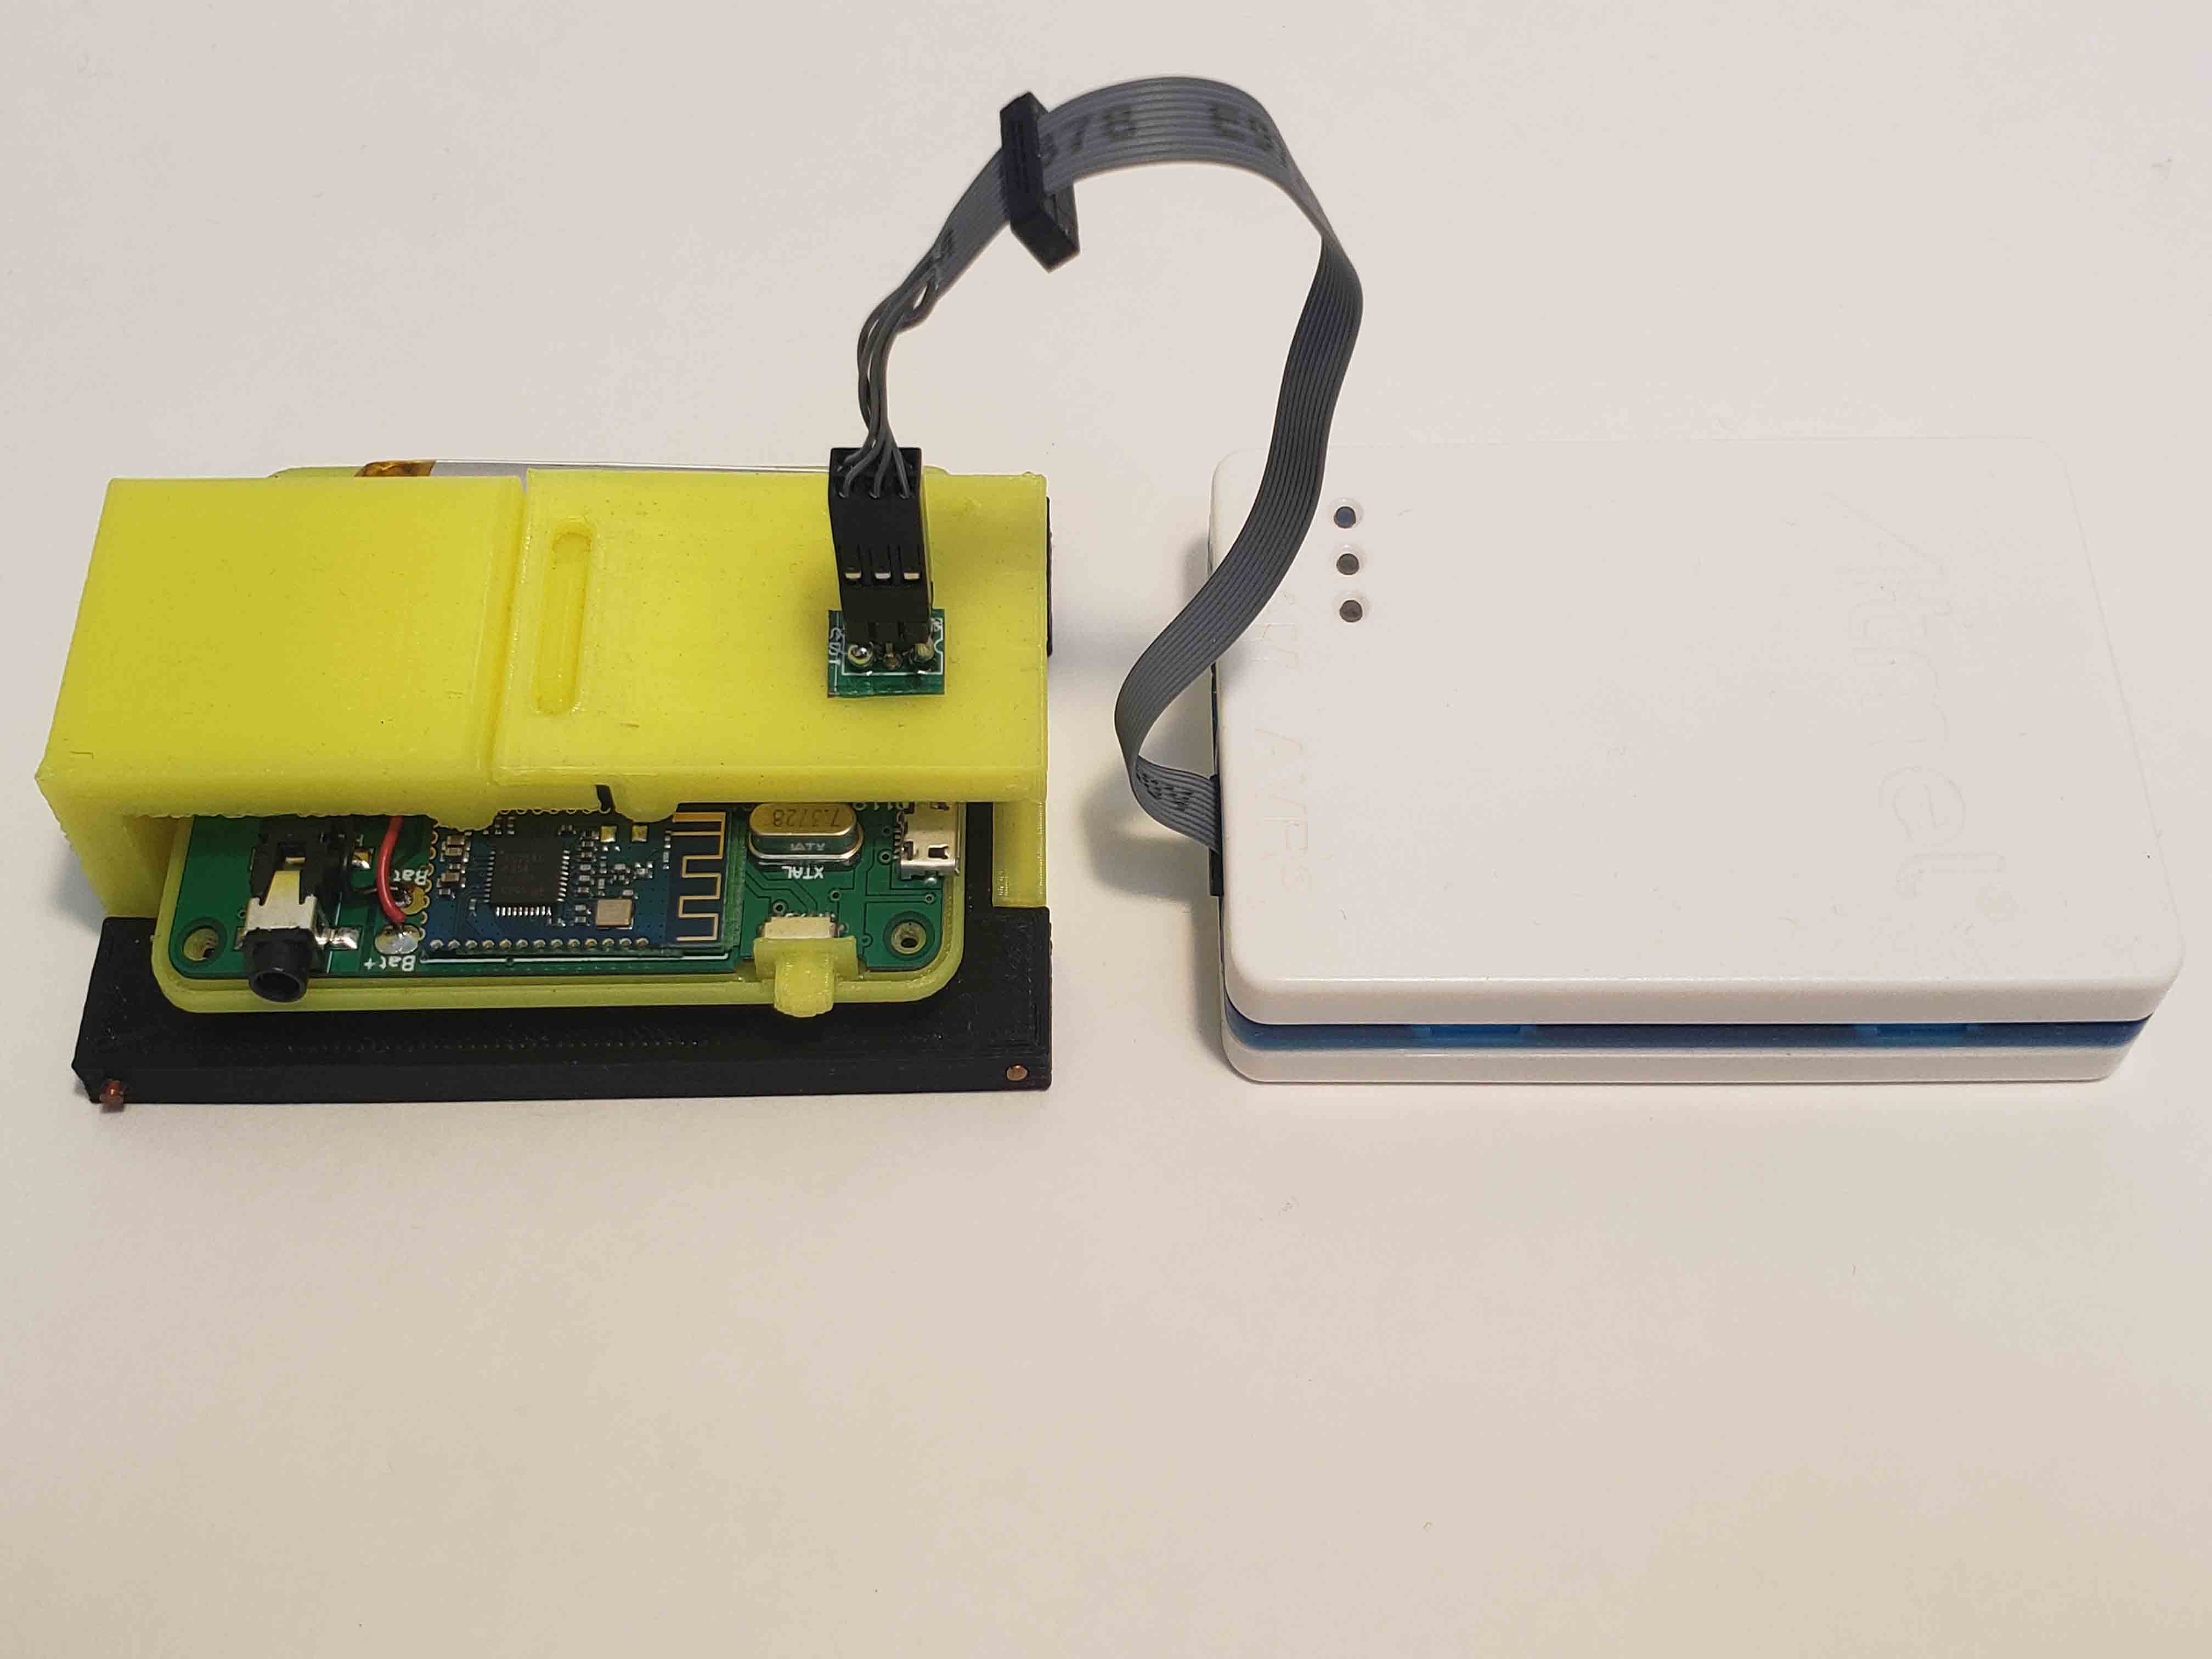
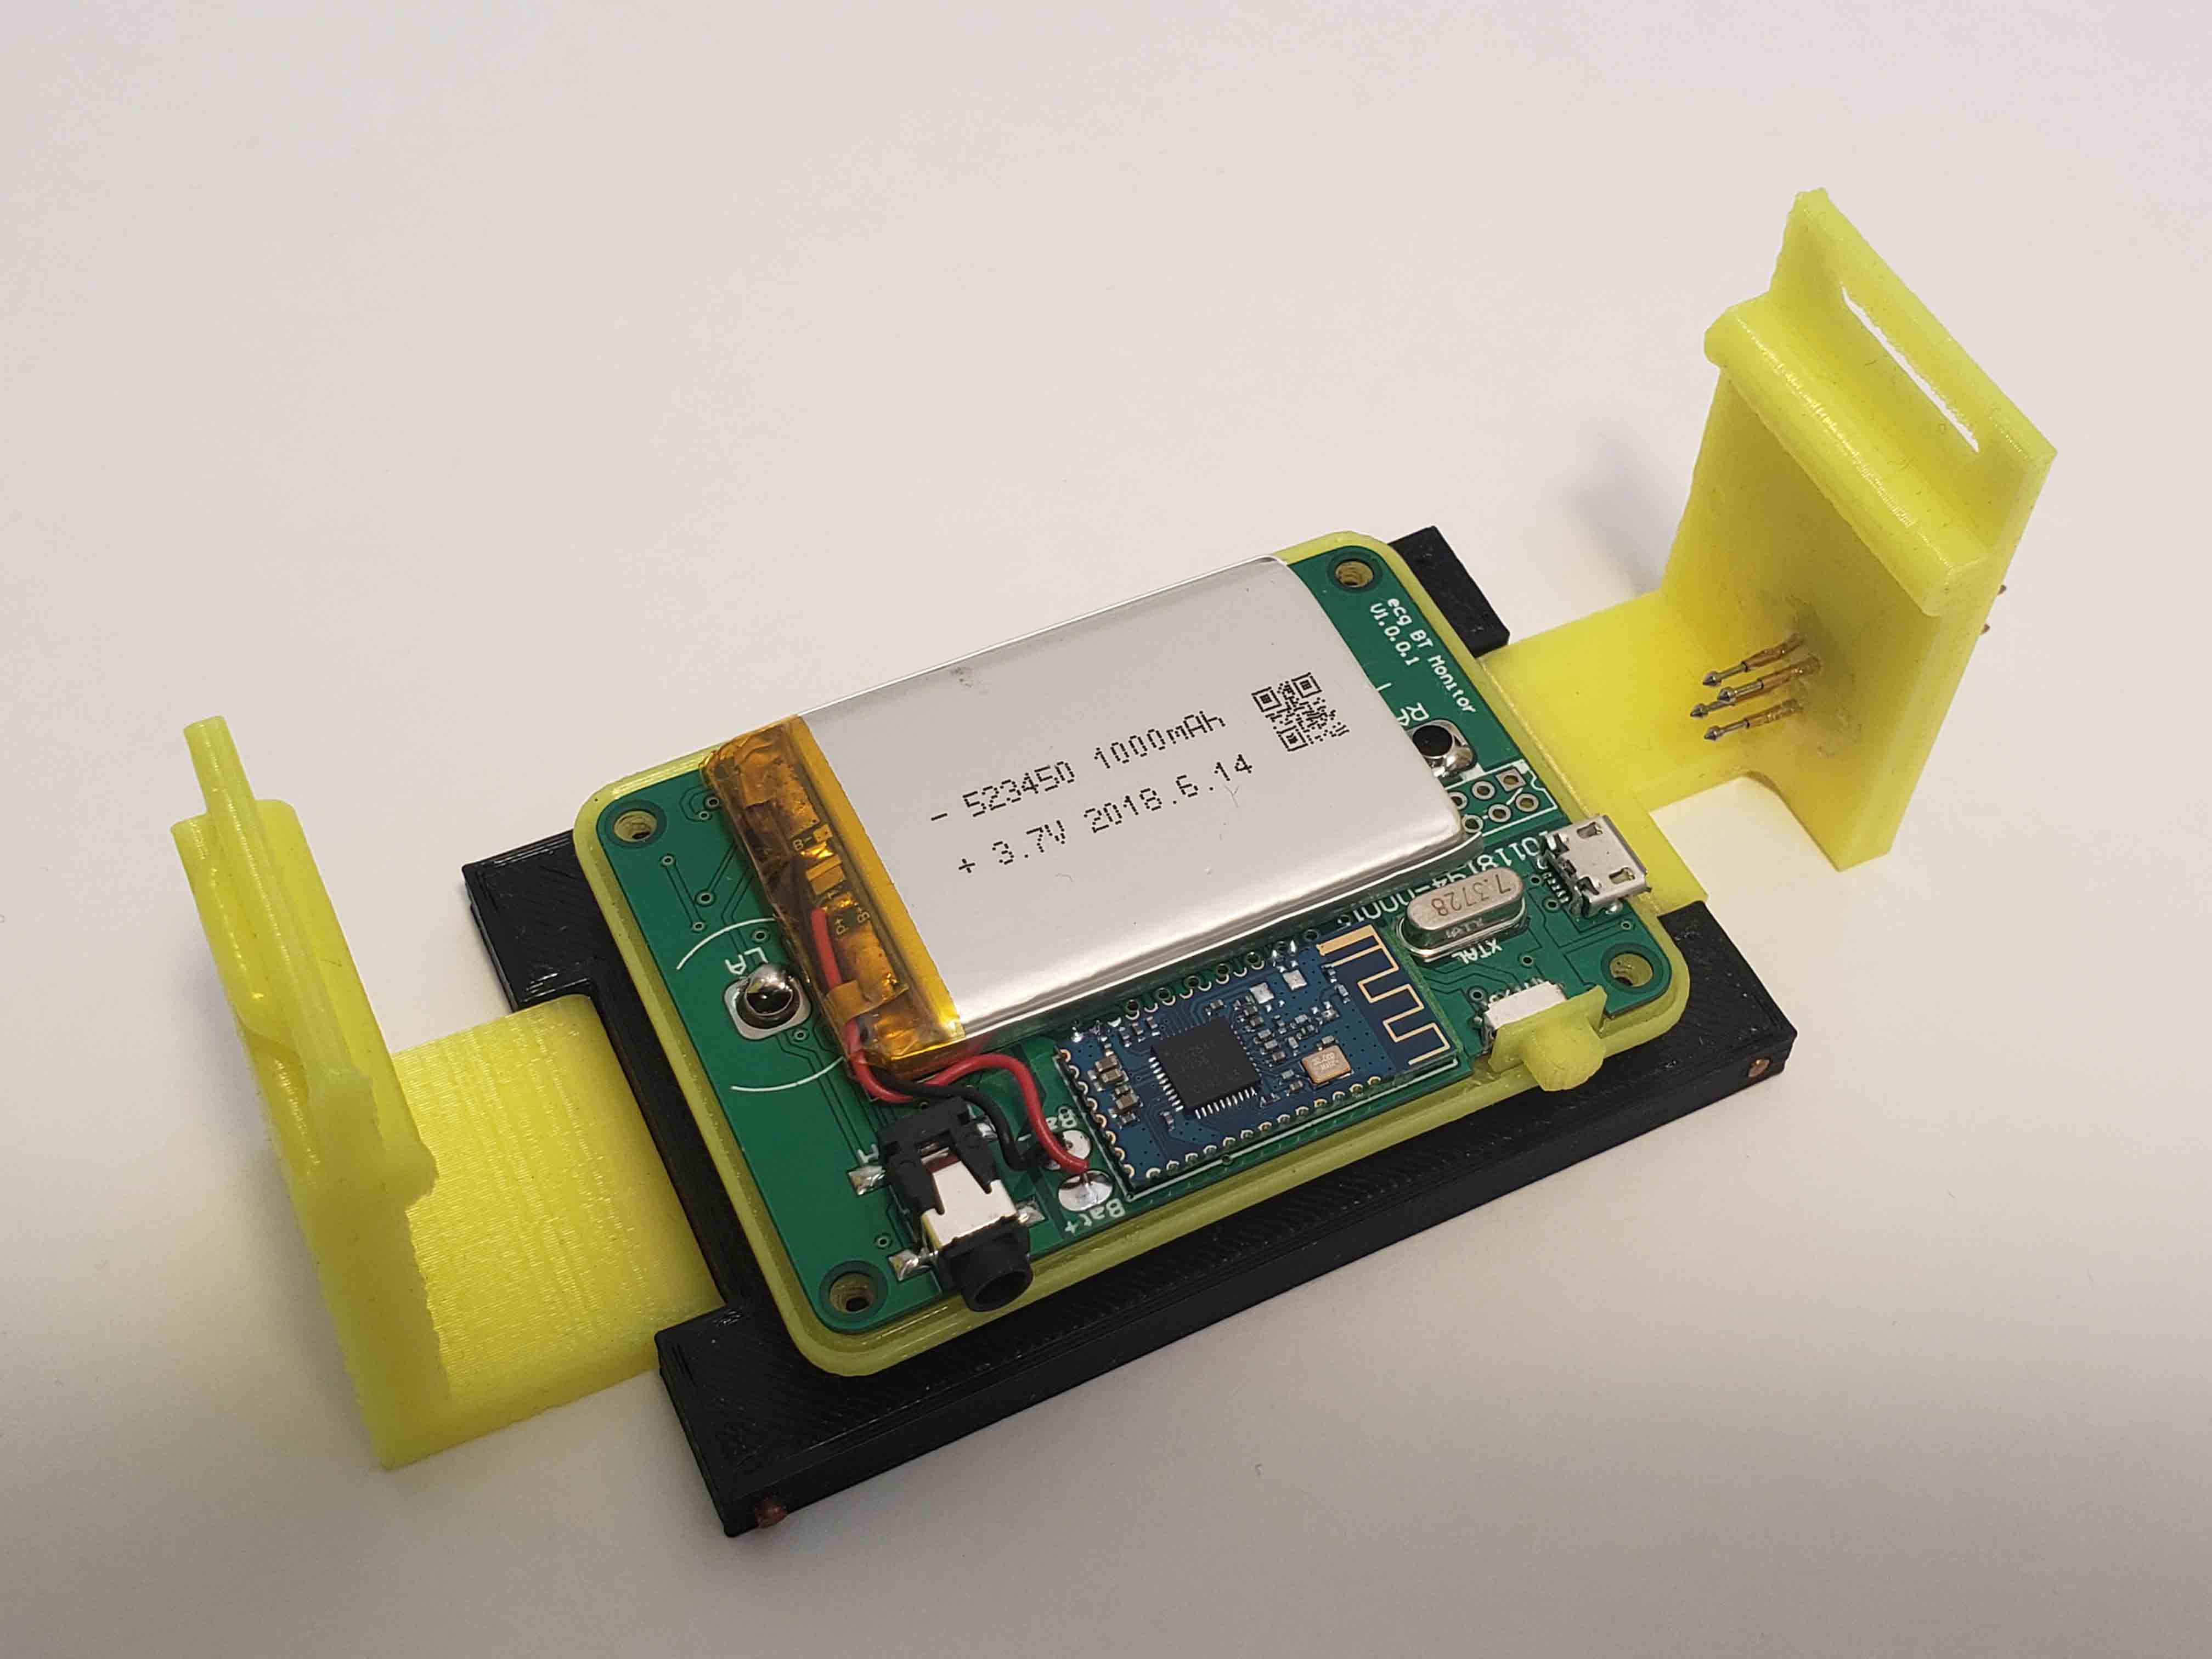
STL 3D ecgMonitor with Battery in Programmer – Fig. 3
ecgMonitor is connected to a MCU Programmer.
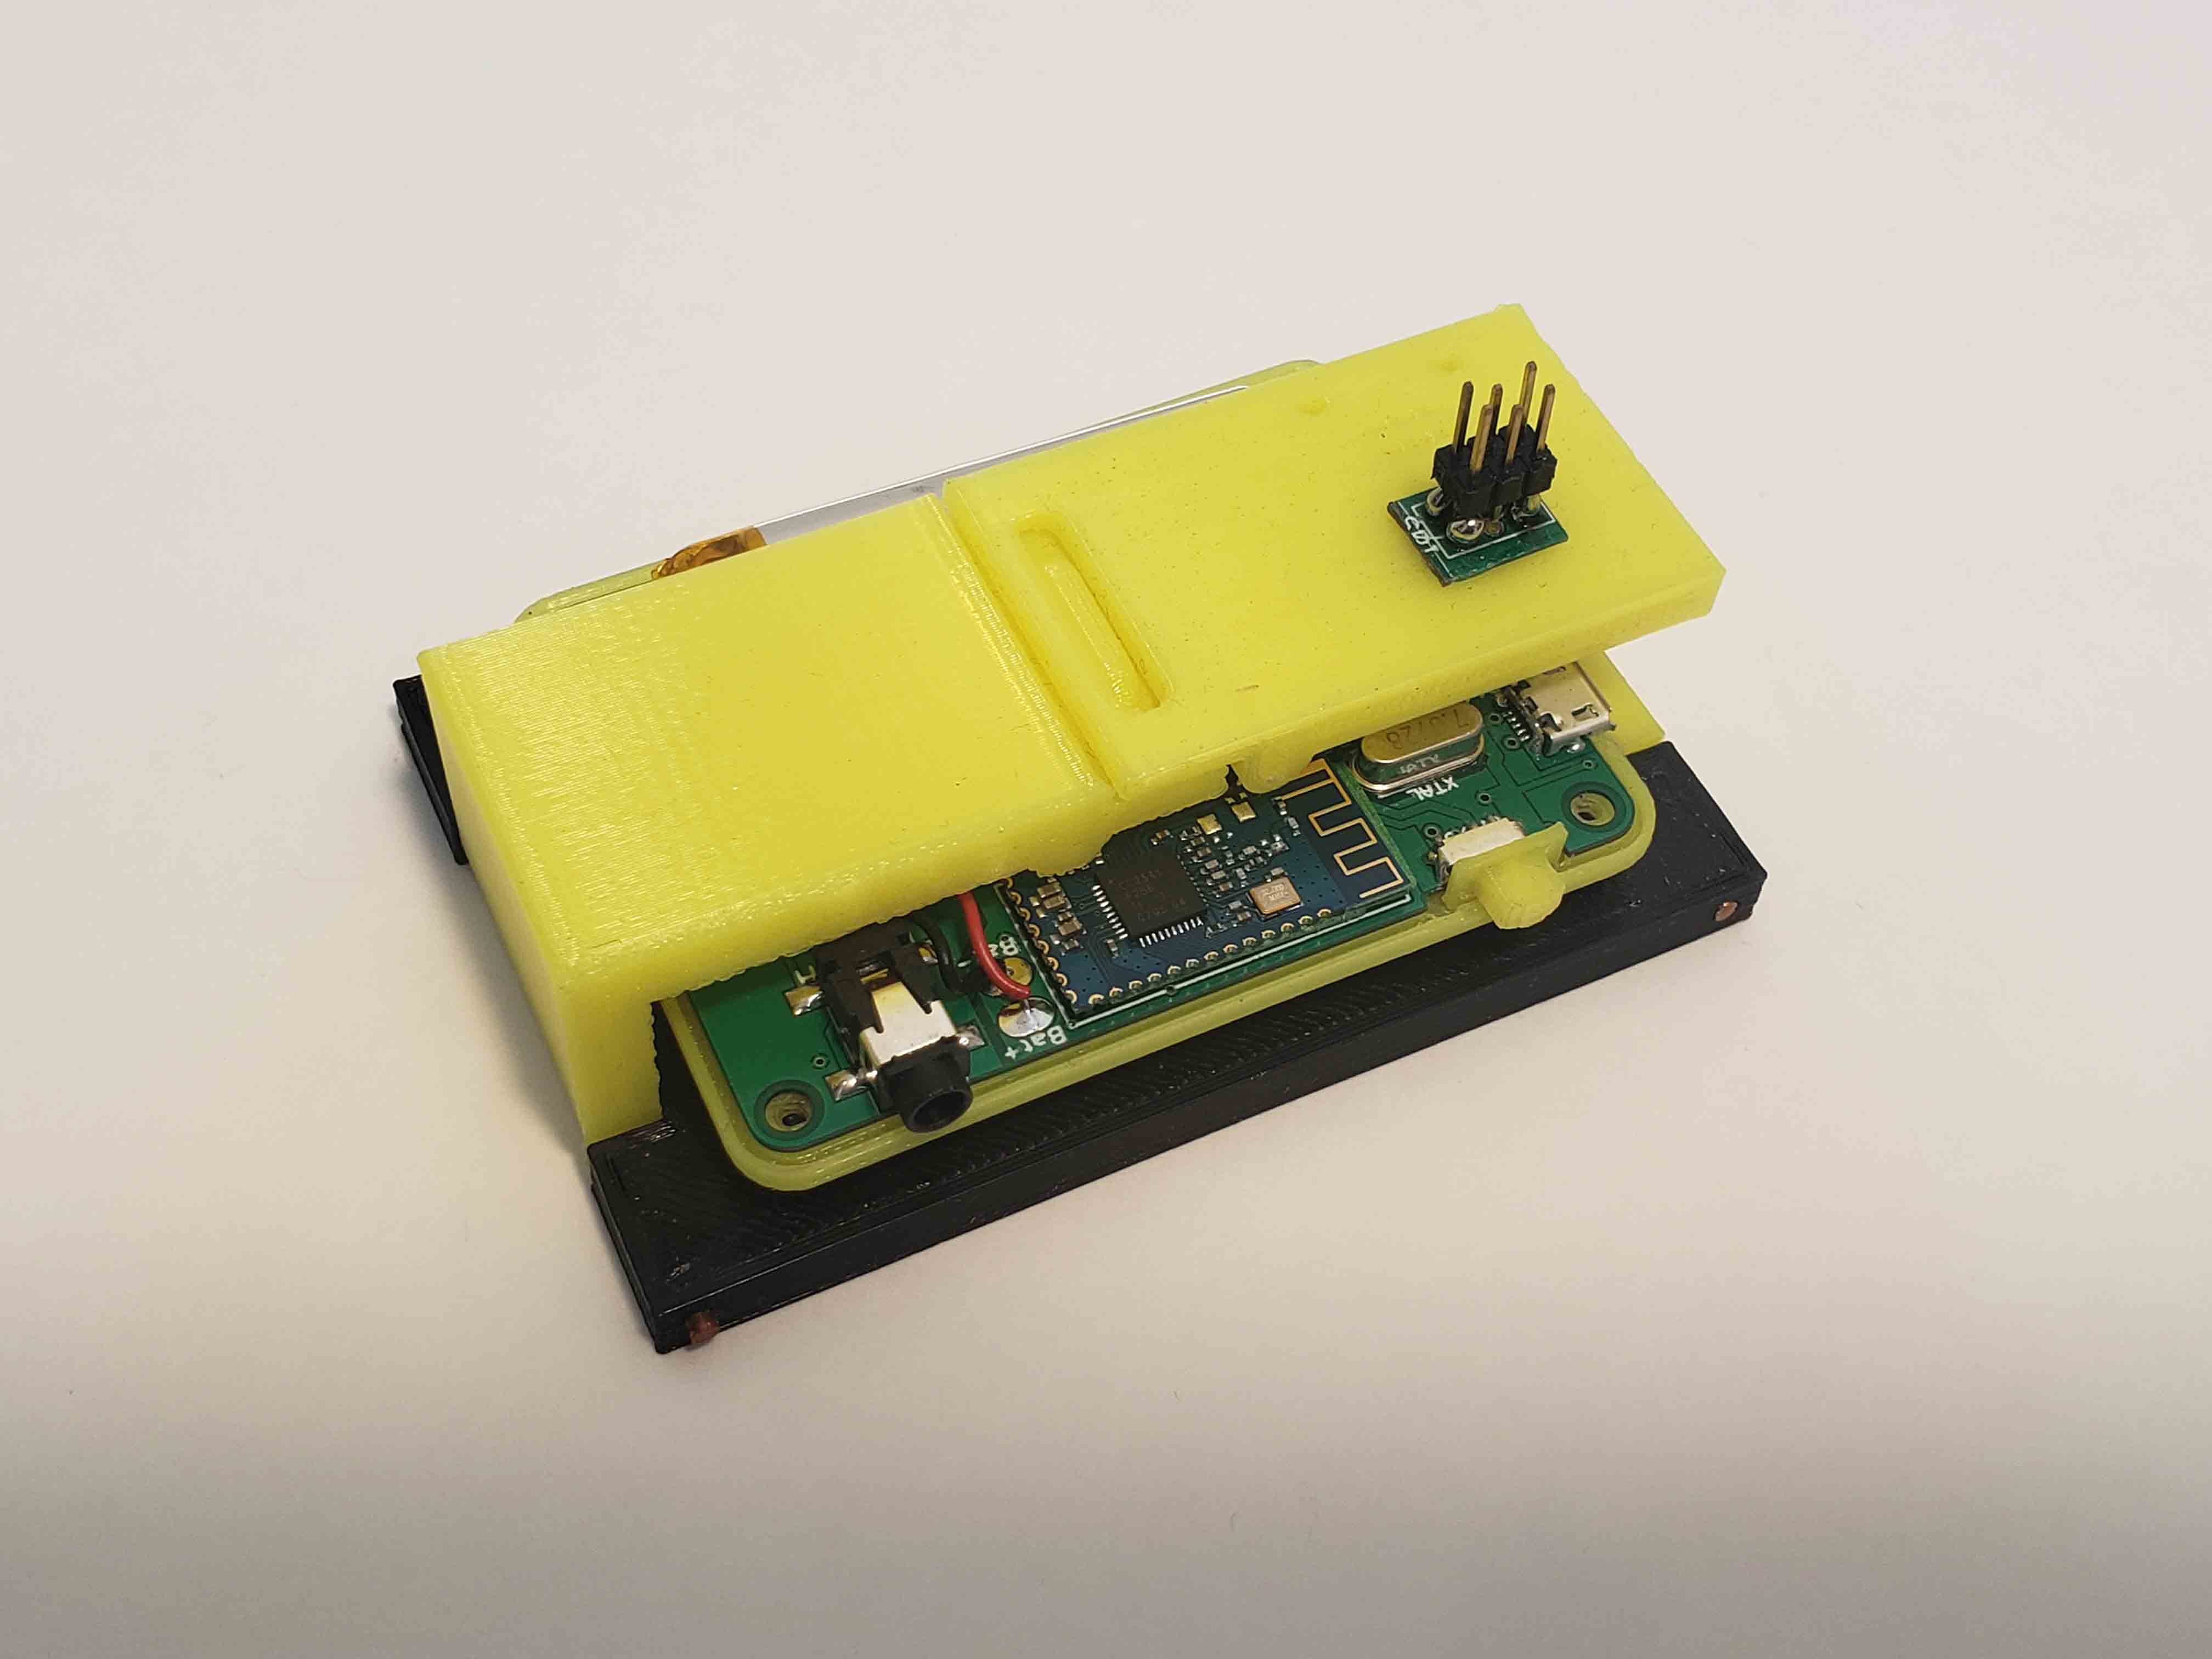
STL 3D ecgMonitor with Battery in Programmer / Assembly – Fig. 2
STL 3D ecgMonitor with Battery in Programmer / Assembly – Fig. 1
August 2017
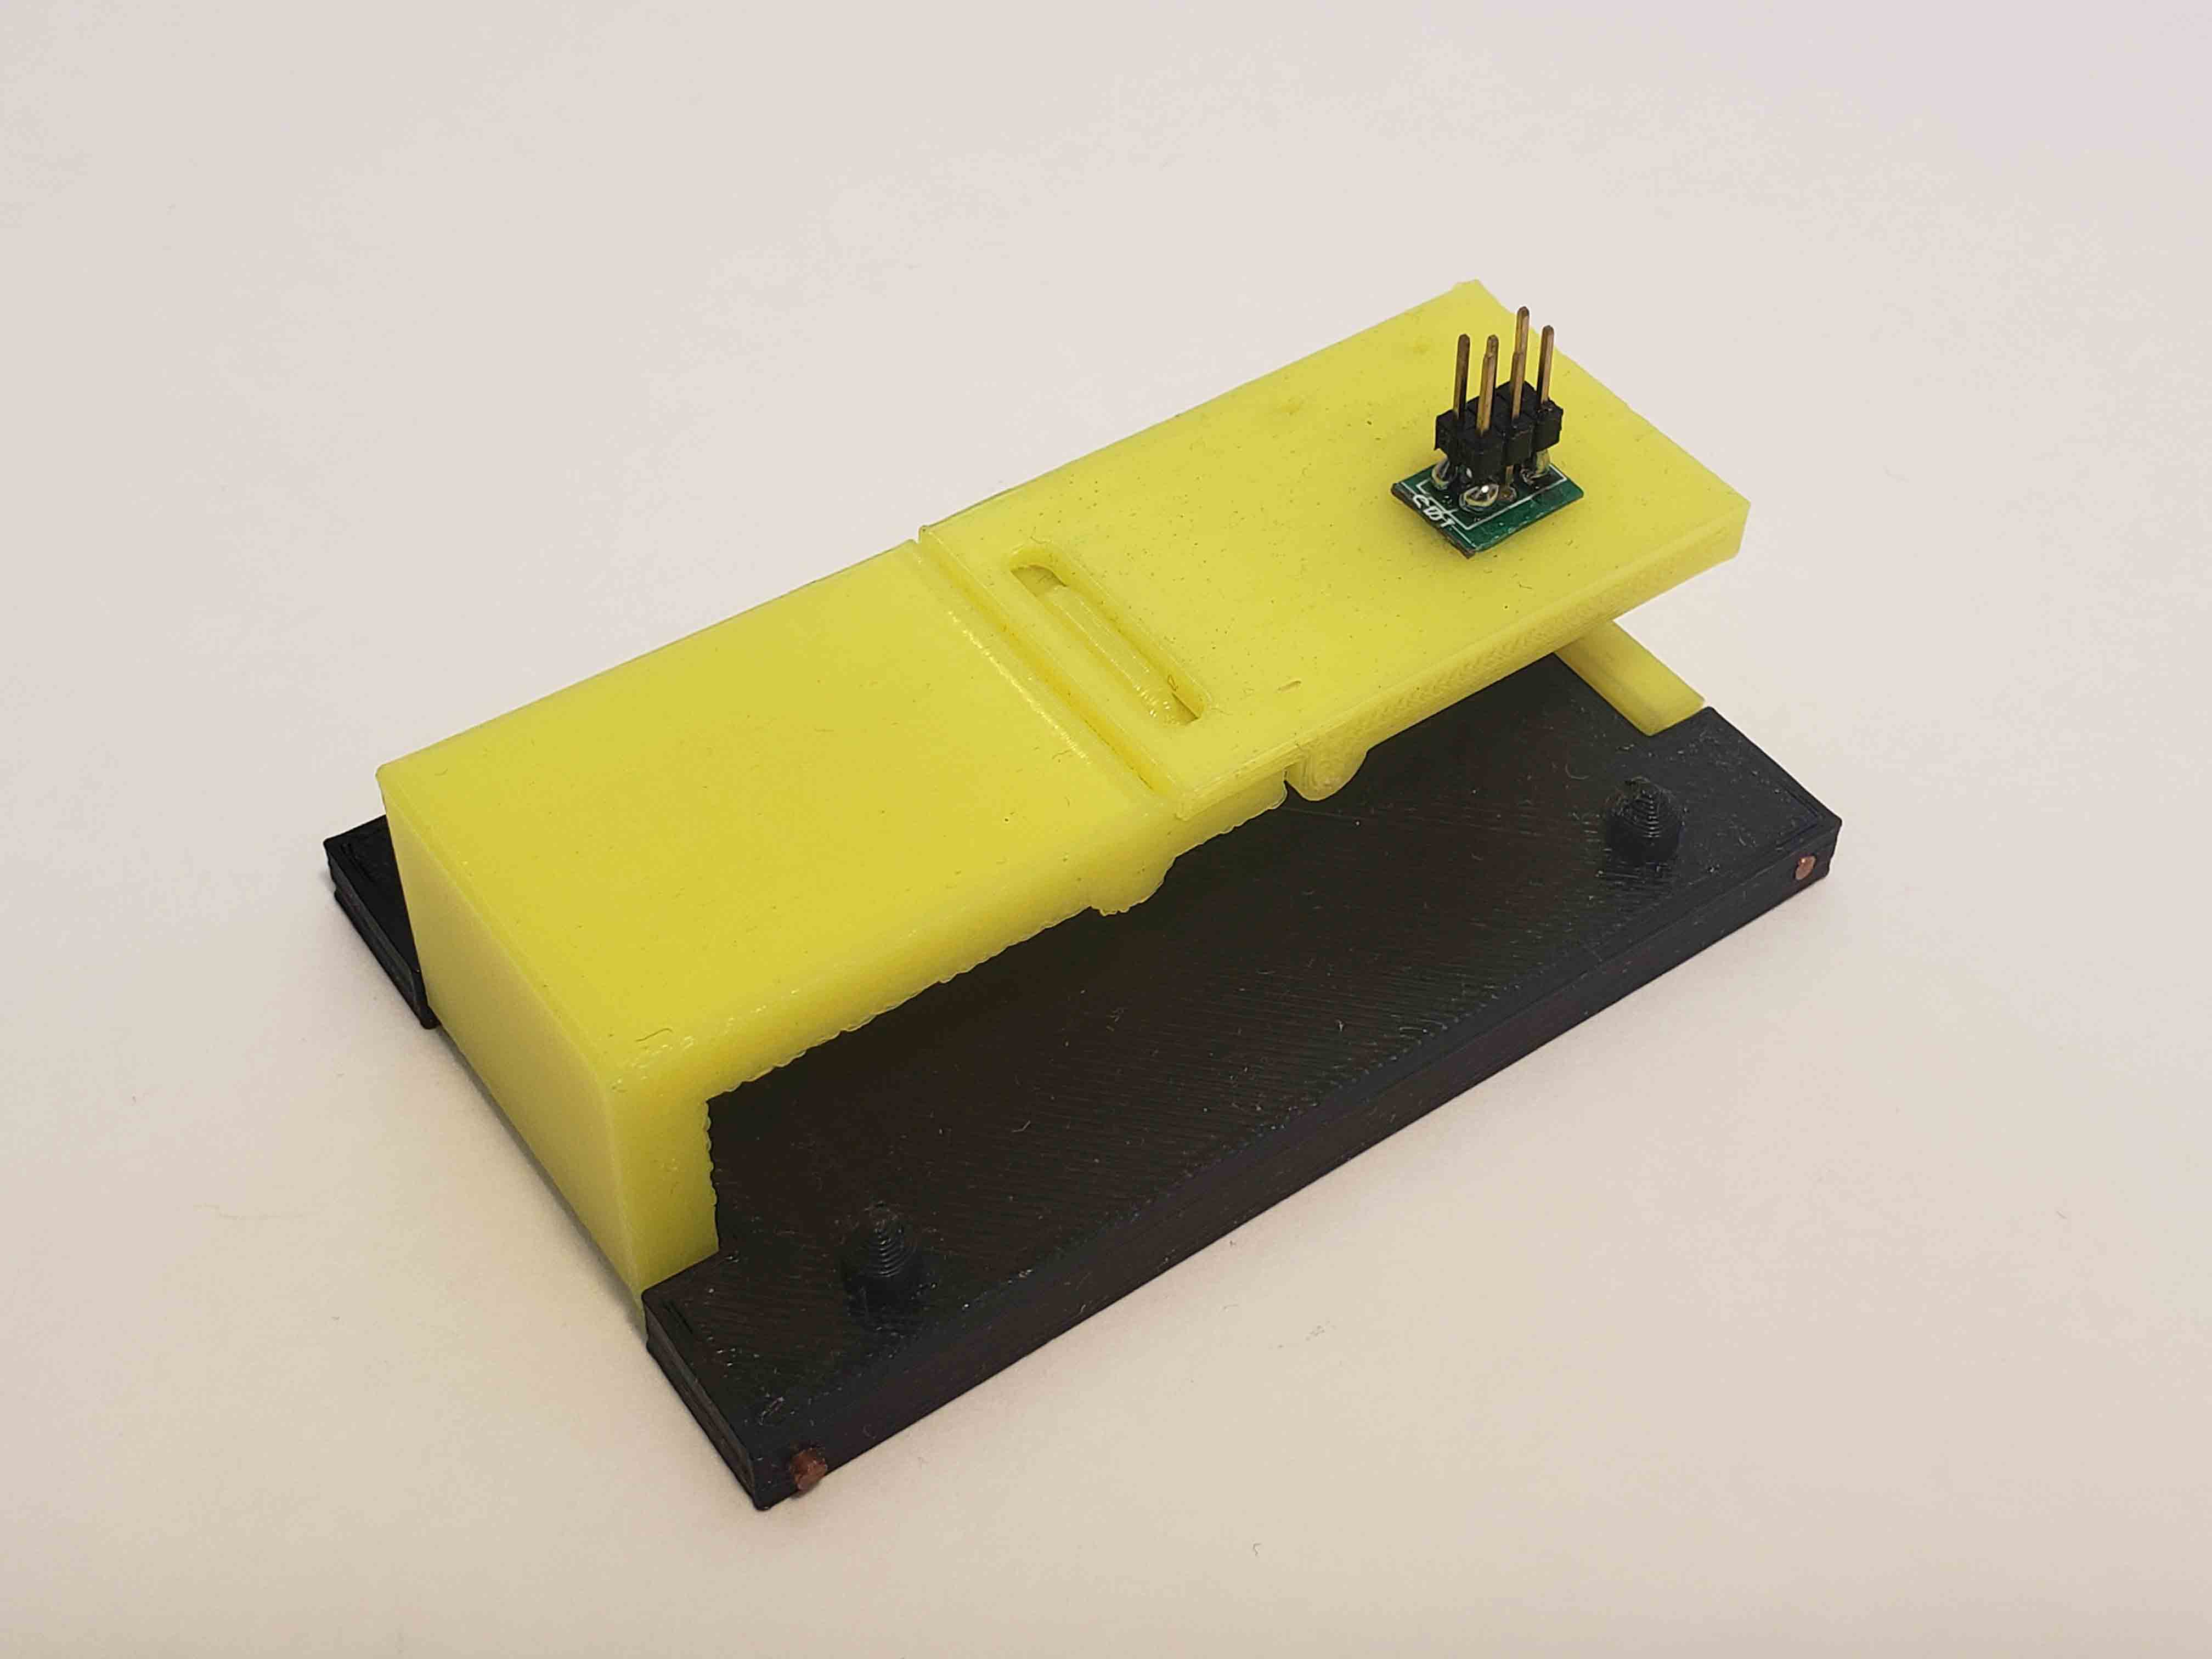
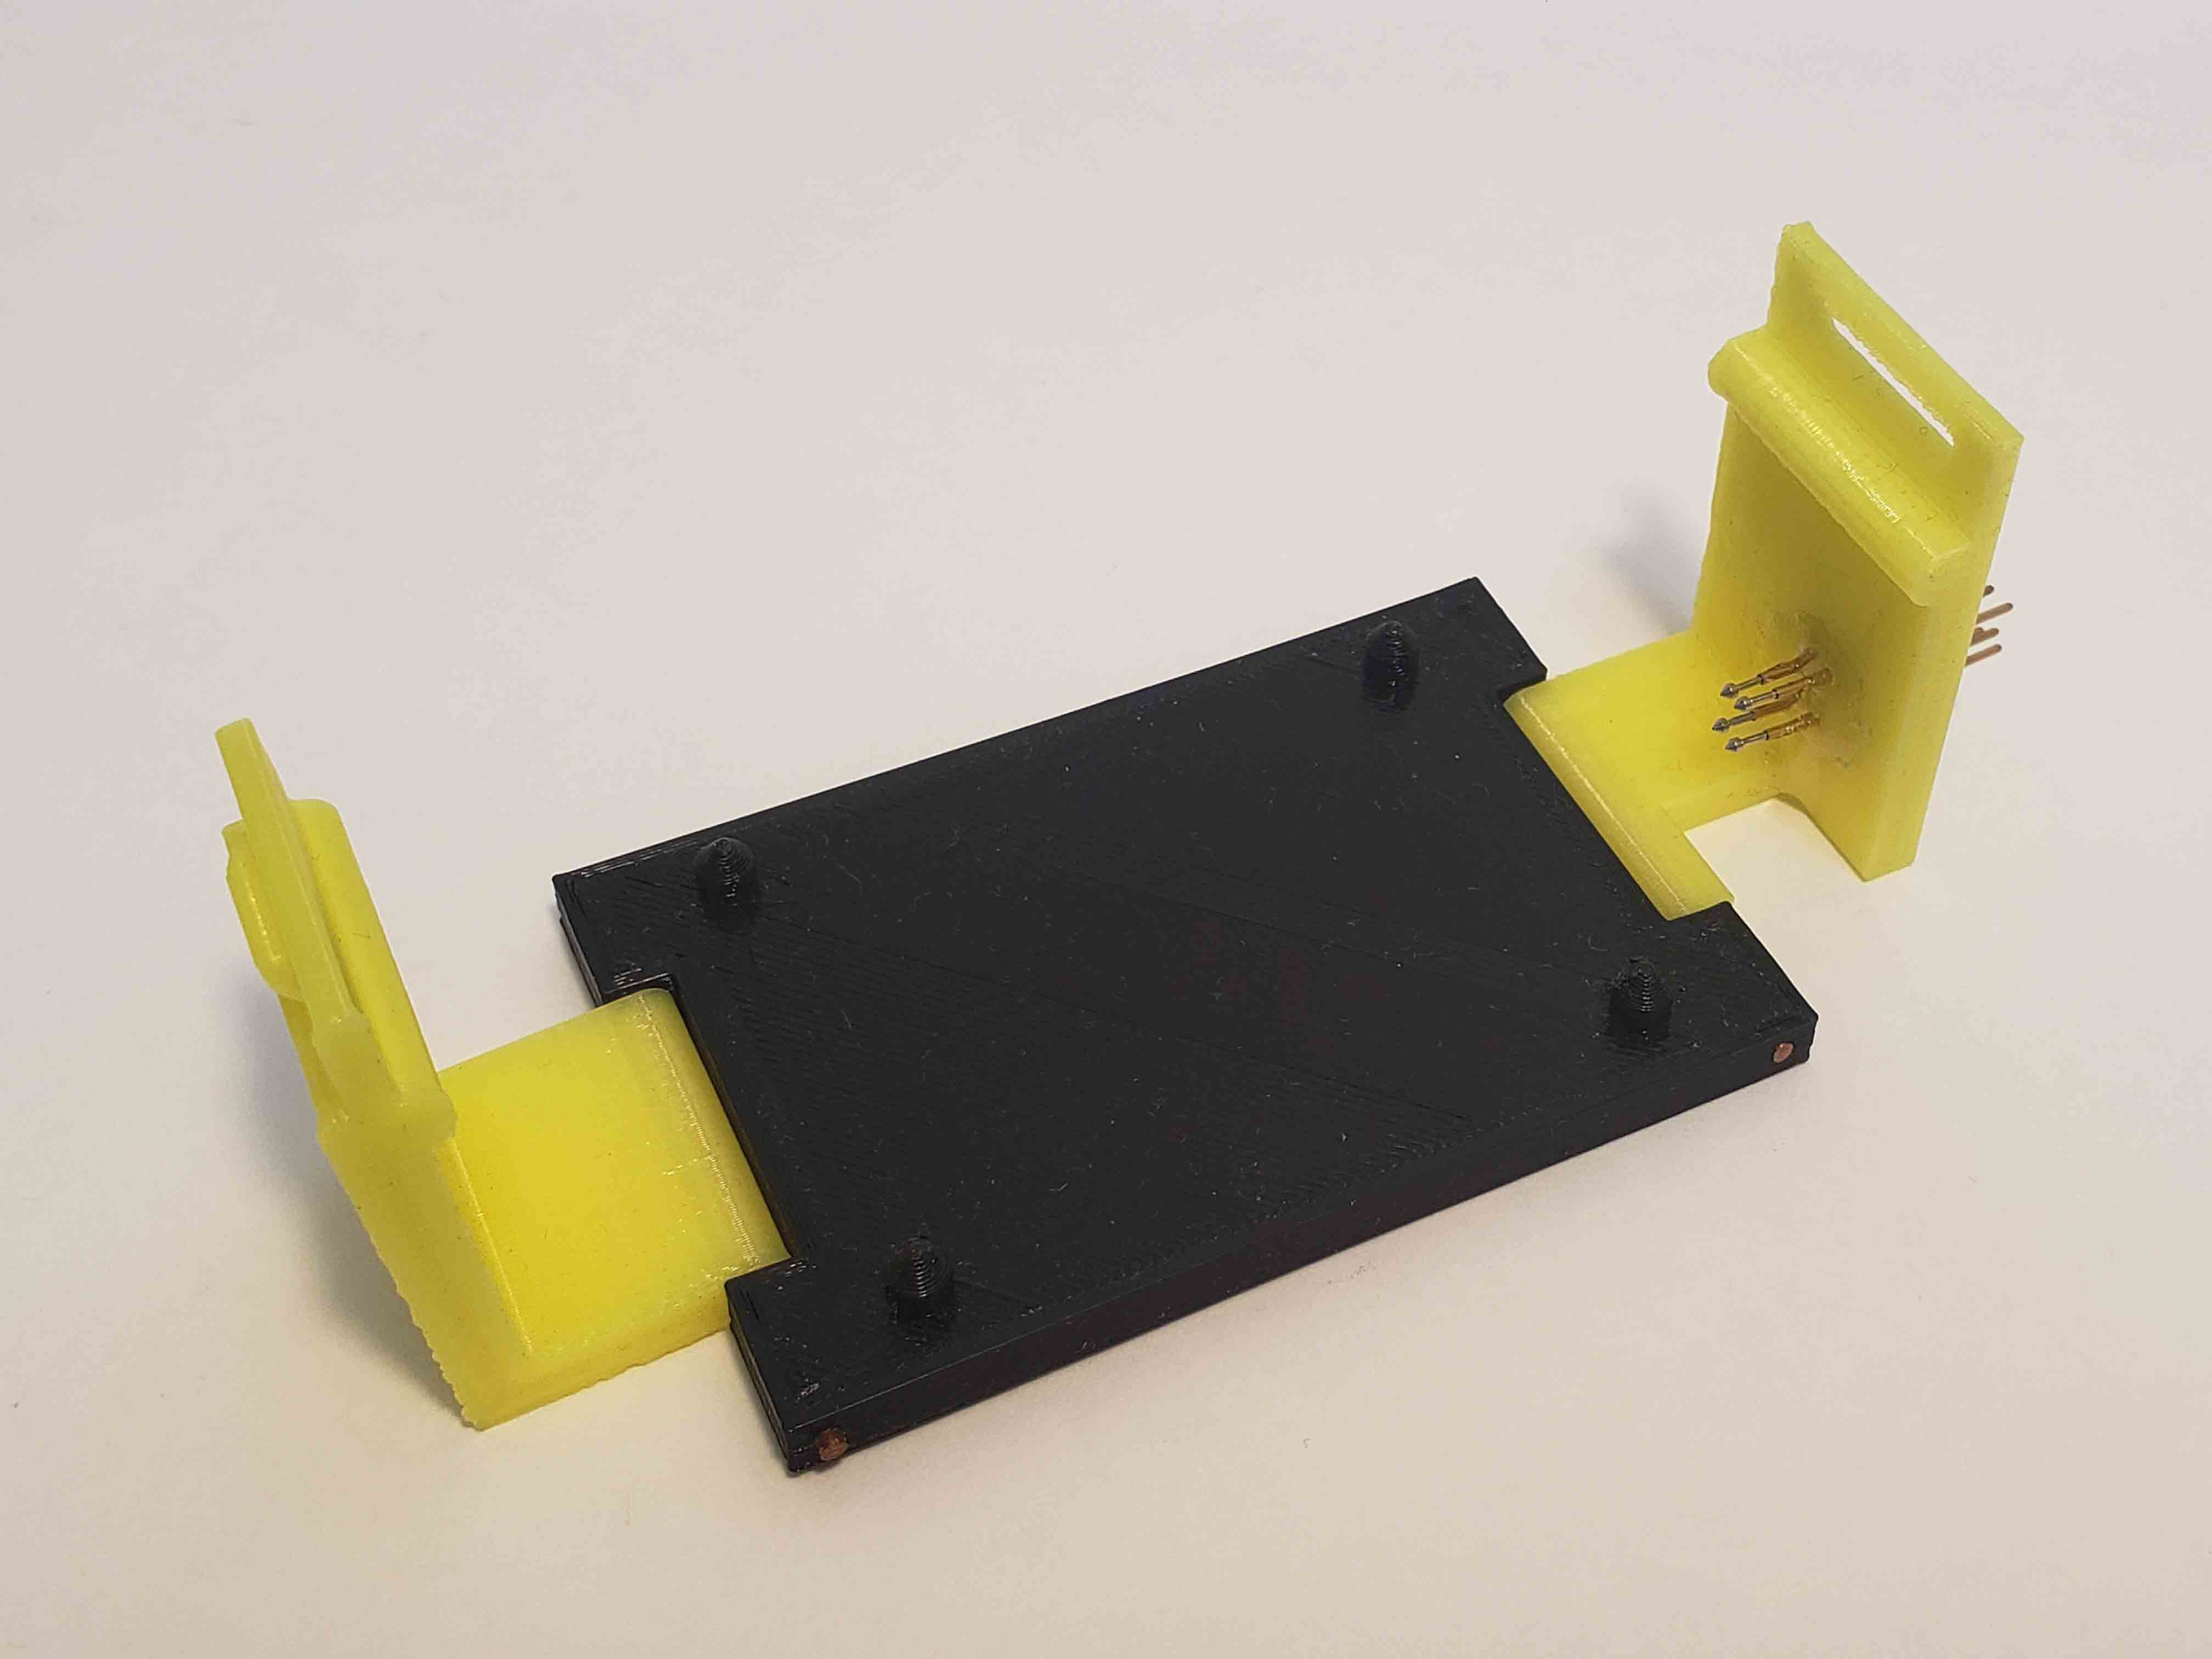
ecgMonitor Programmer – Fig. 2
STL 3D Printing with 6-pin connector
ecgMonitor Programmer – Fig. 1
STL 3D Printing
June 2017
ECG Programmer with Housing Assembly
3D Printing STL file output
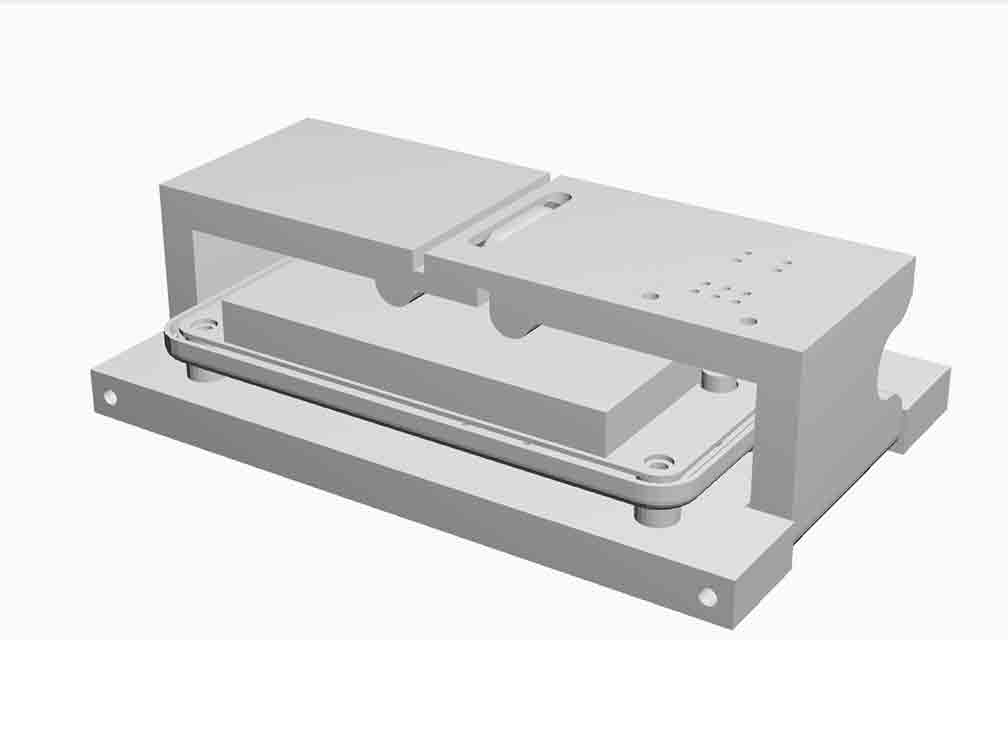
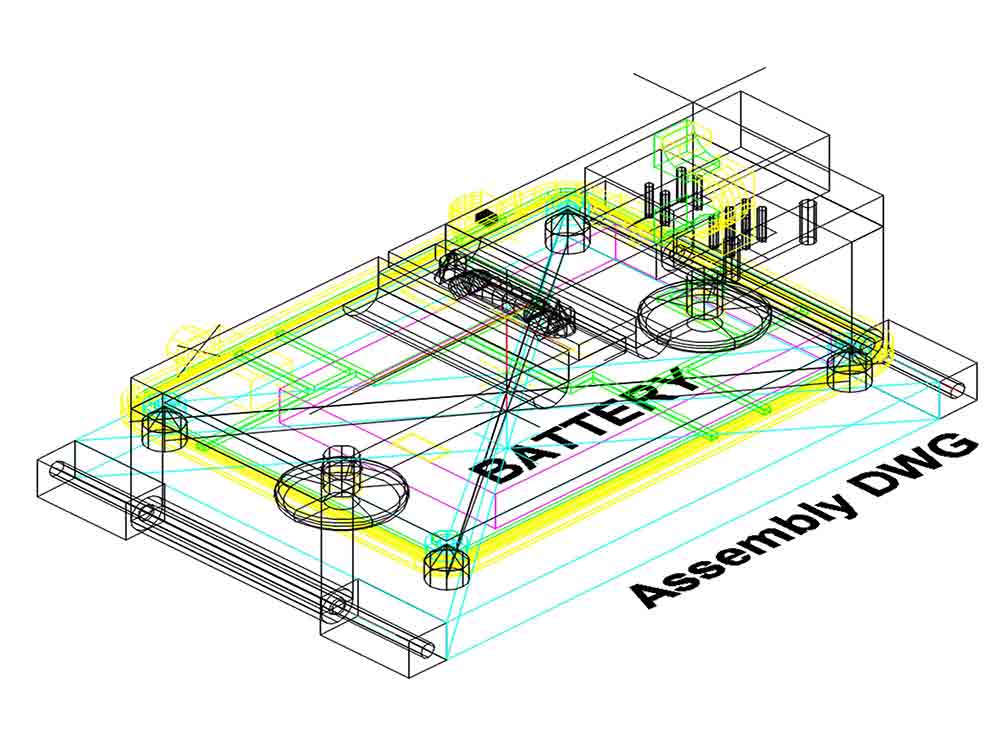
AutoCAD Programmer Design
Assembly Drawing of Programmer with ecgMonitor.
Programmer Design
May 2017
3D Printing: Final Release of ECG Case Housing – Fig. 2
3D Printing: Final Release of ECG Case Housing – Fig. 1
March 2017
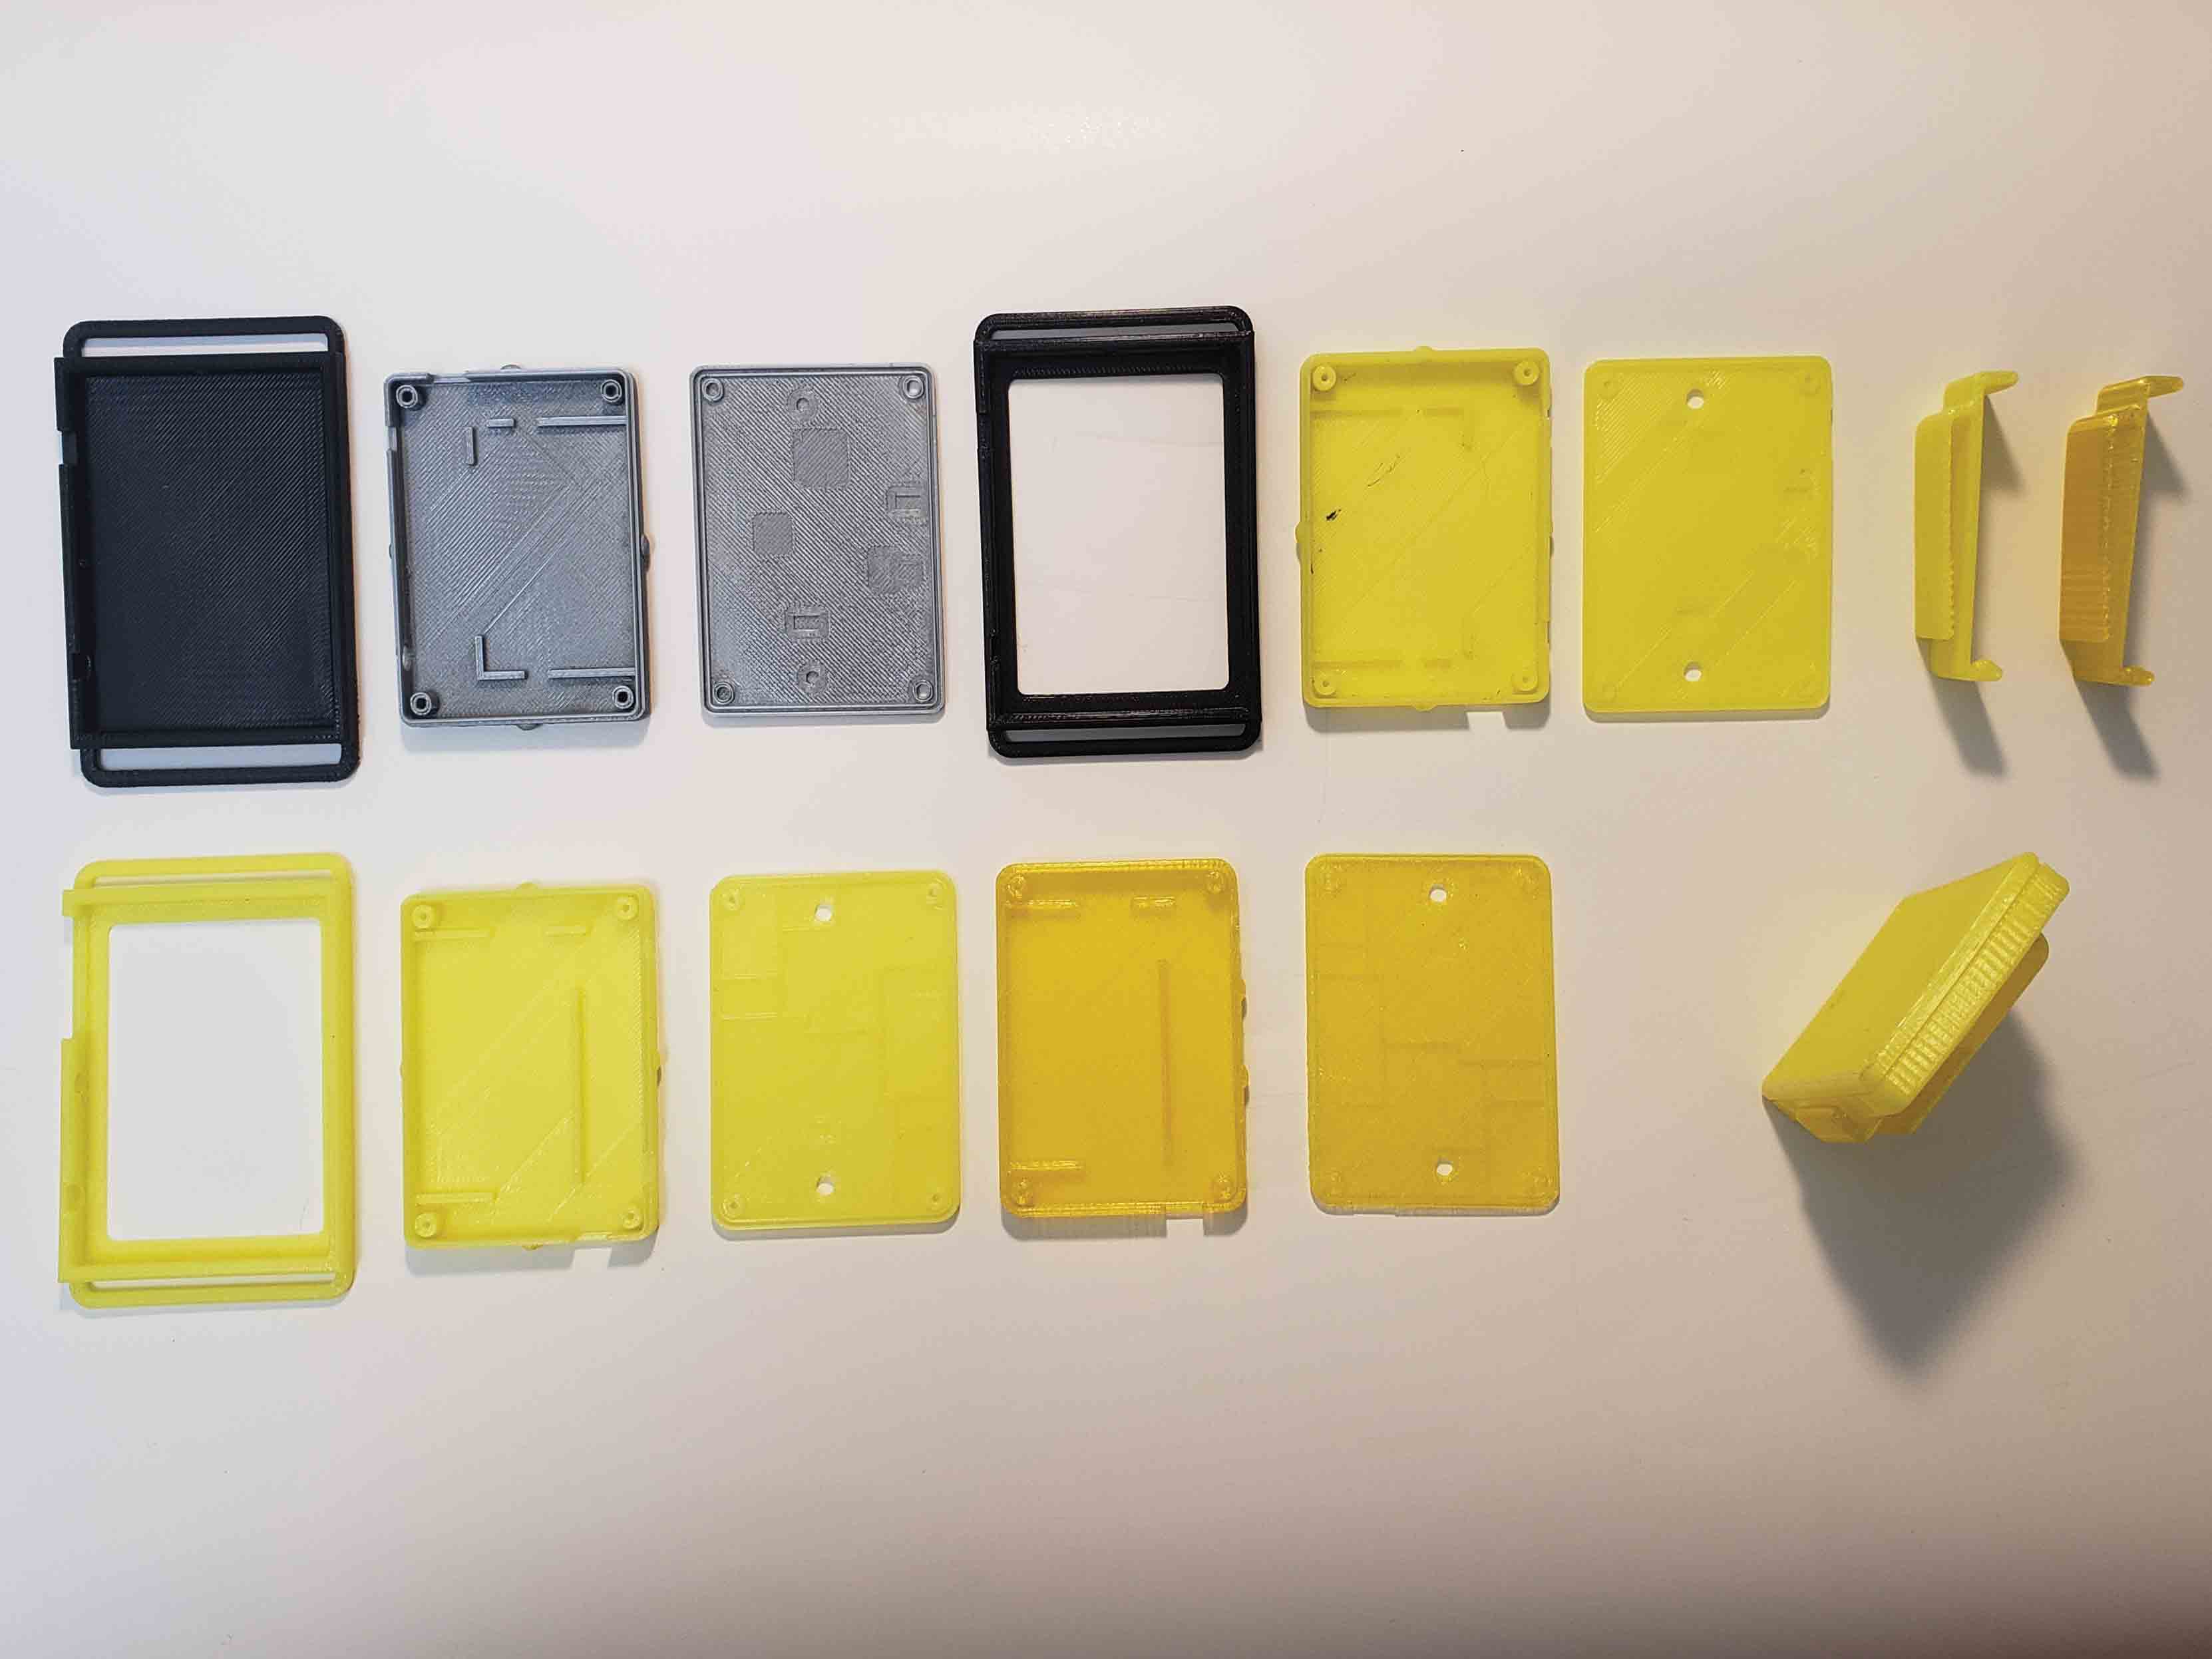
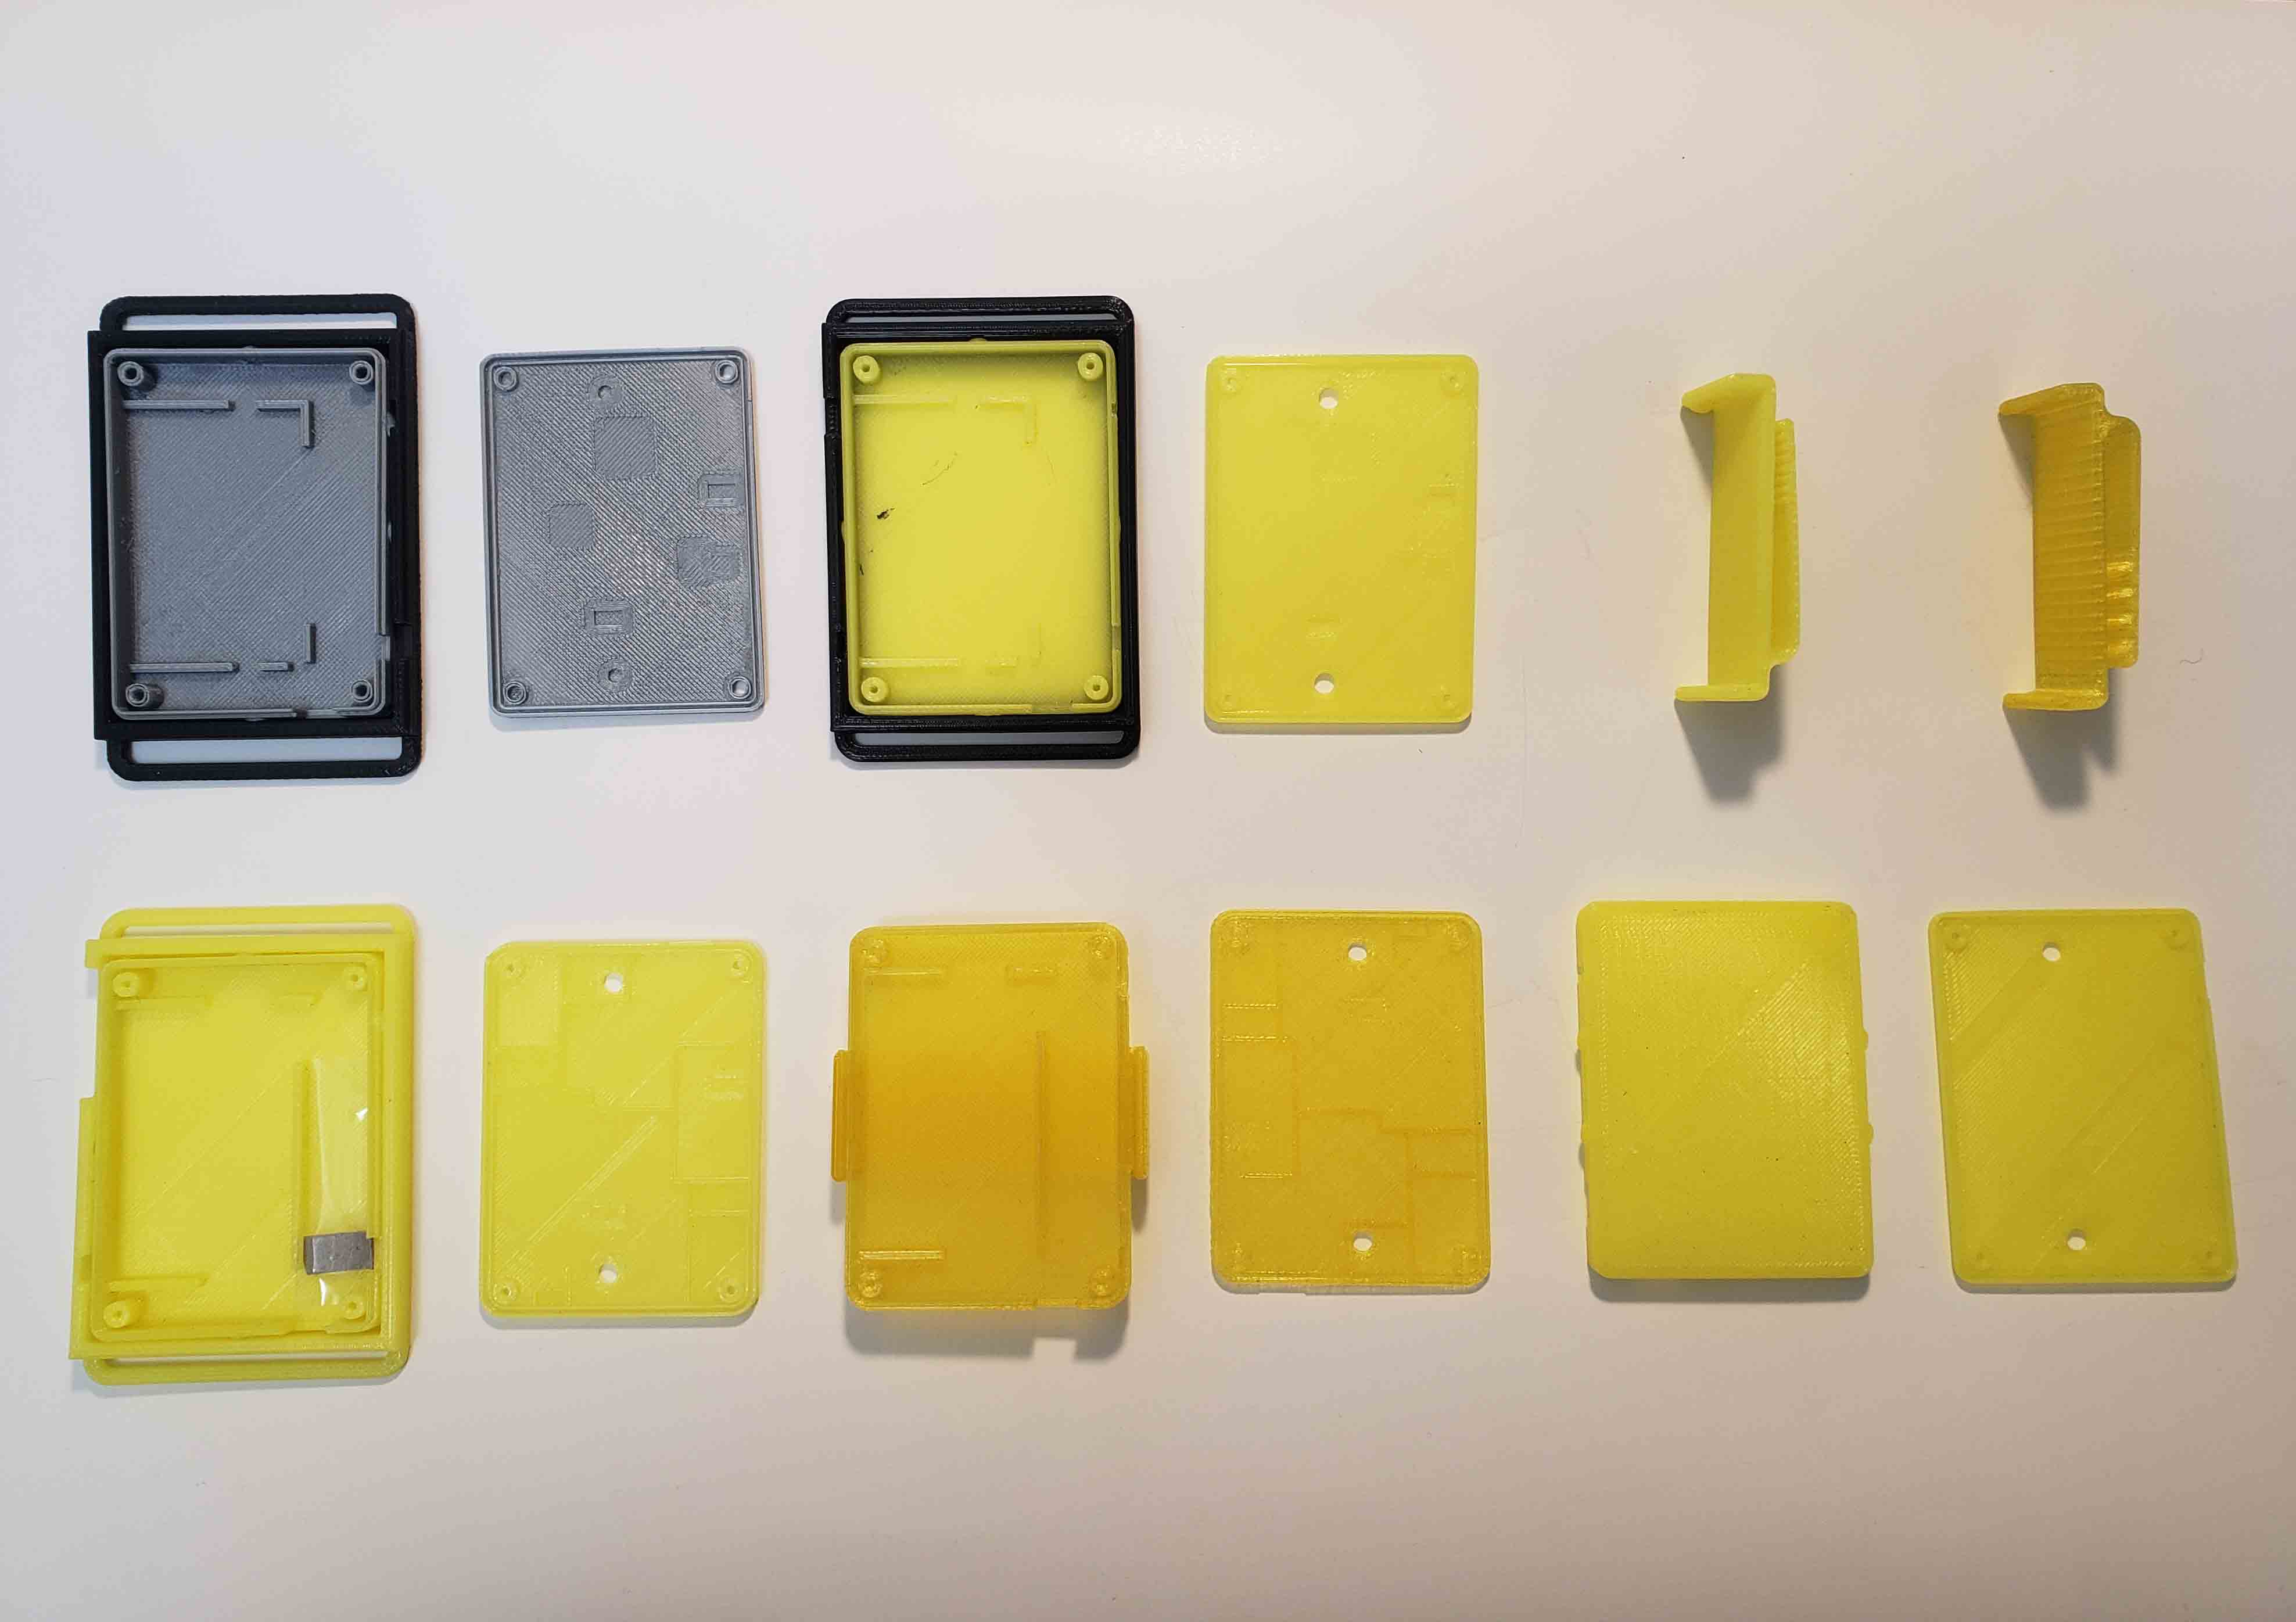
3D Printing for various type of ECG Case Housing – Fig. 2
3D Printing for various type of ECG Case Housing – Fig. 1
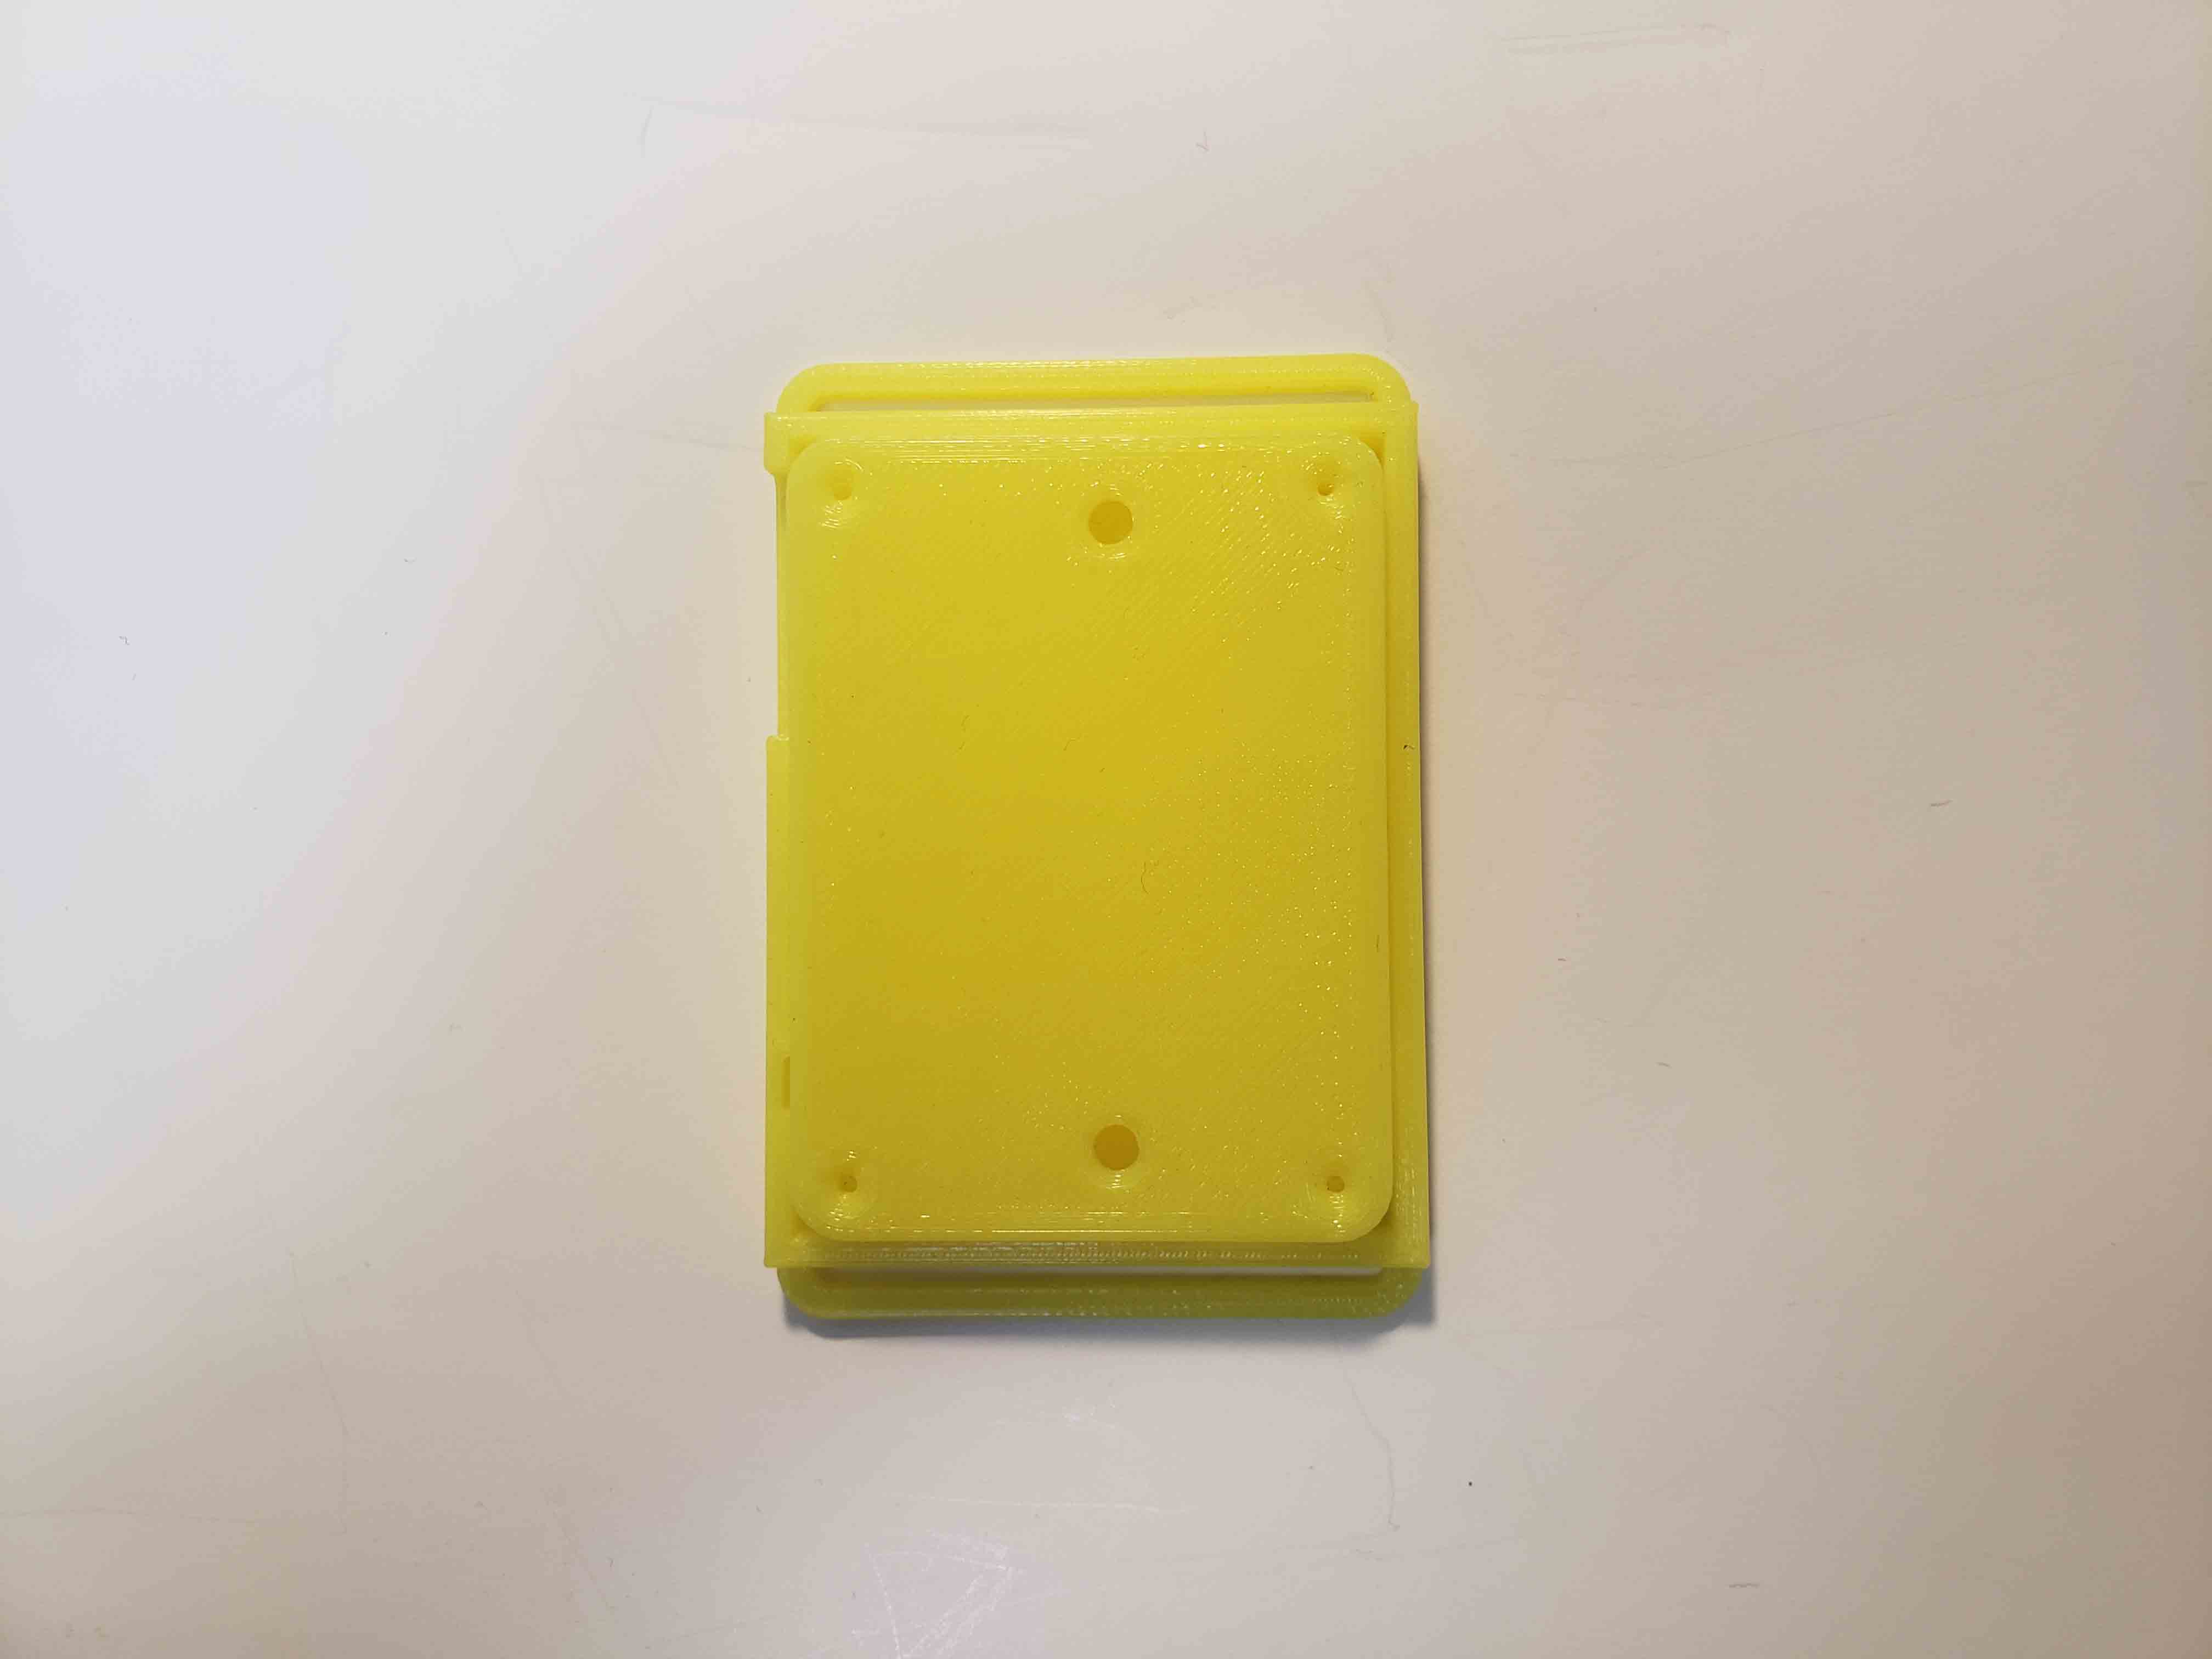
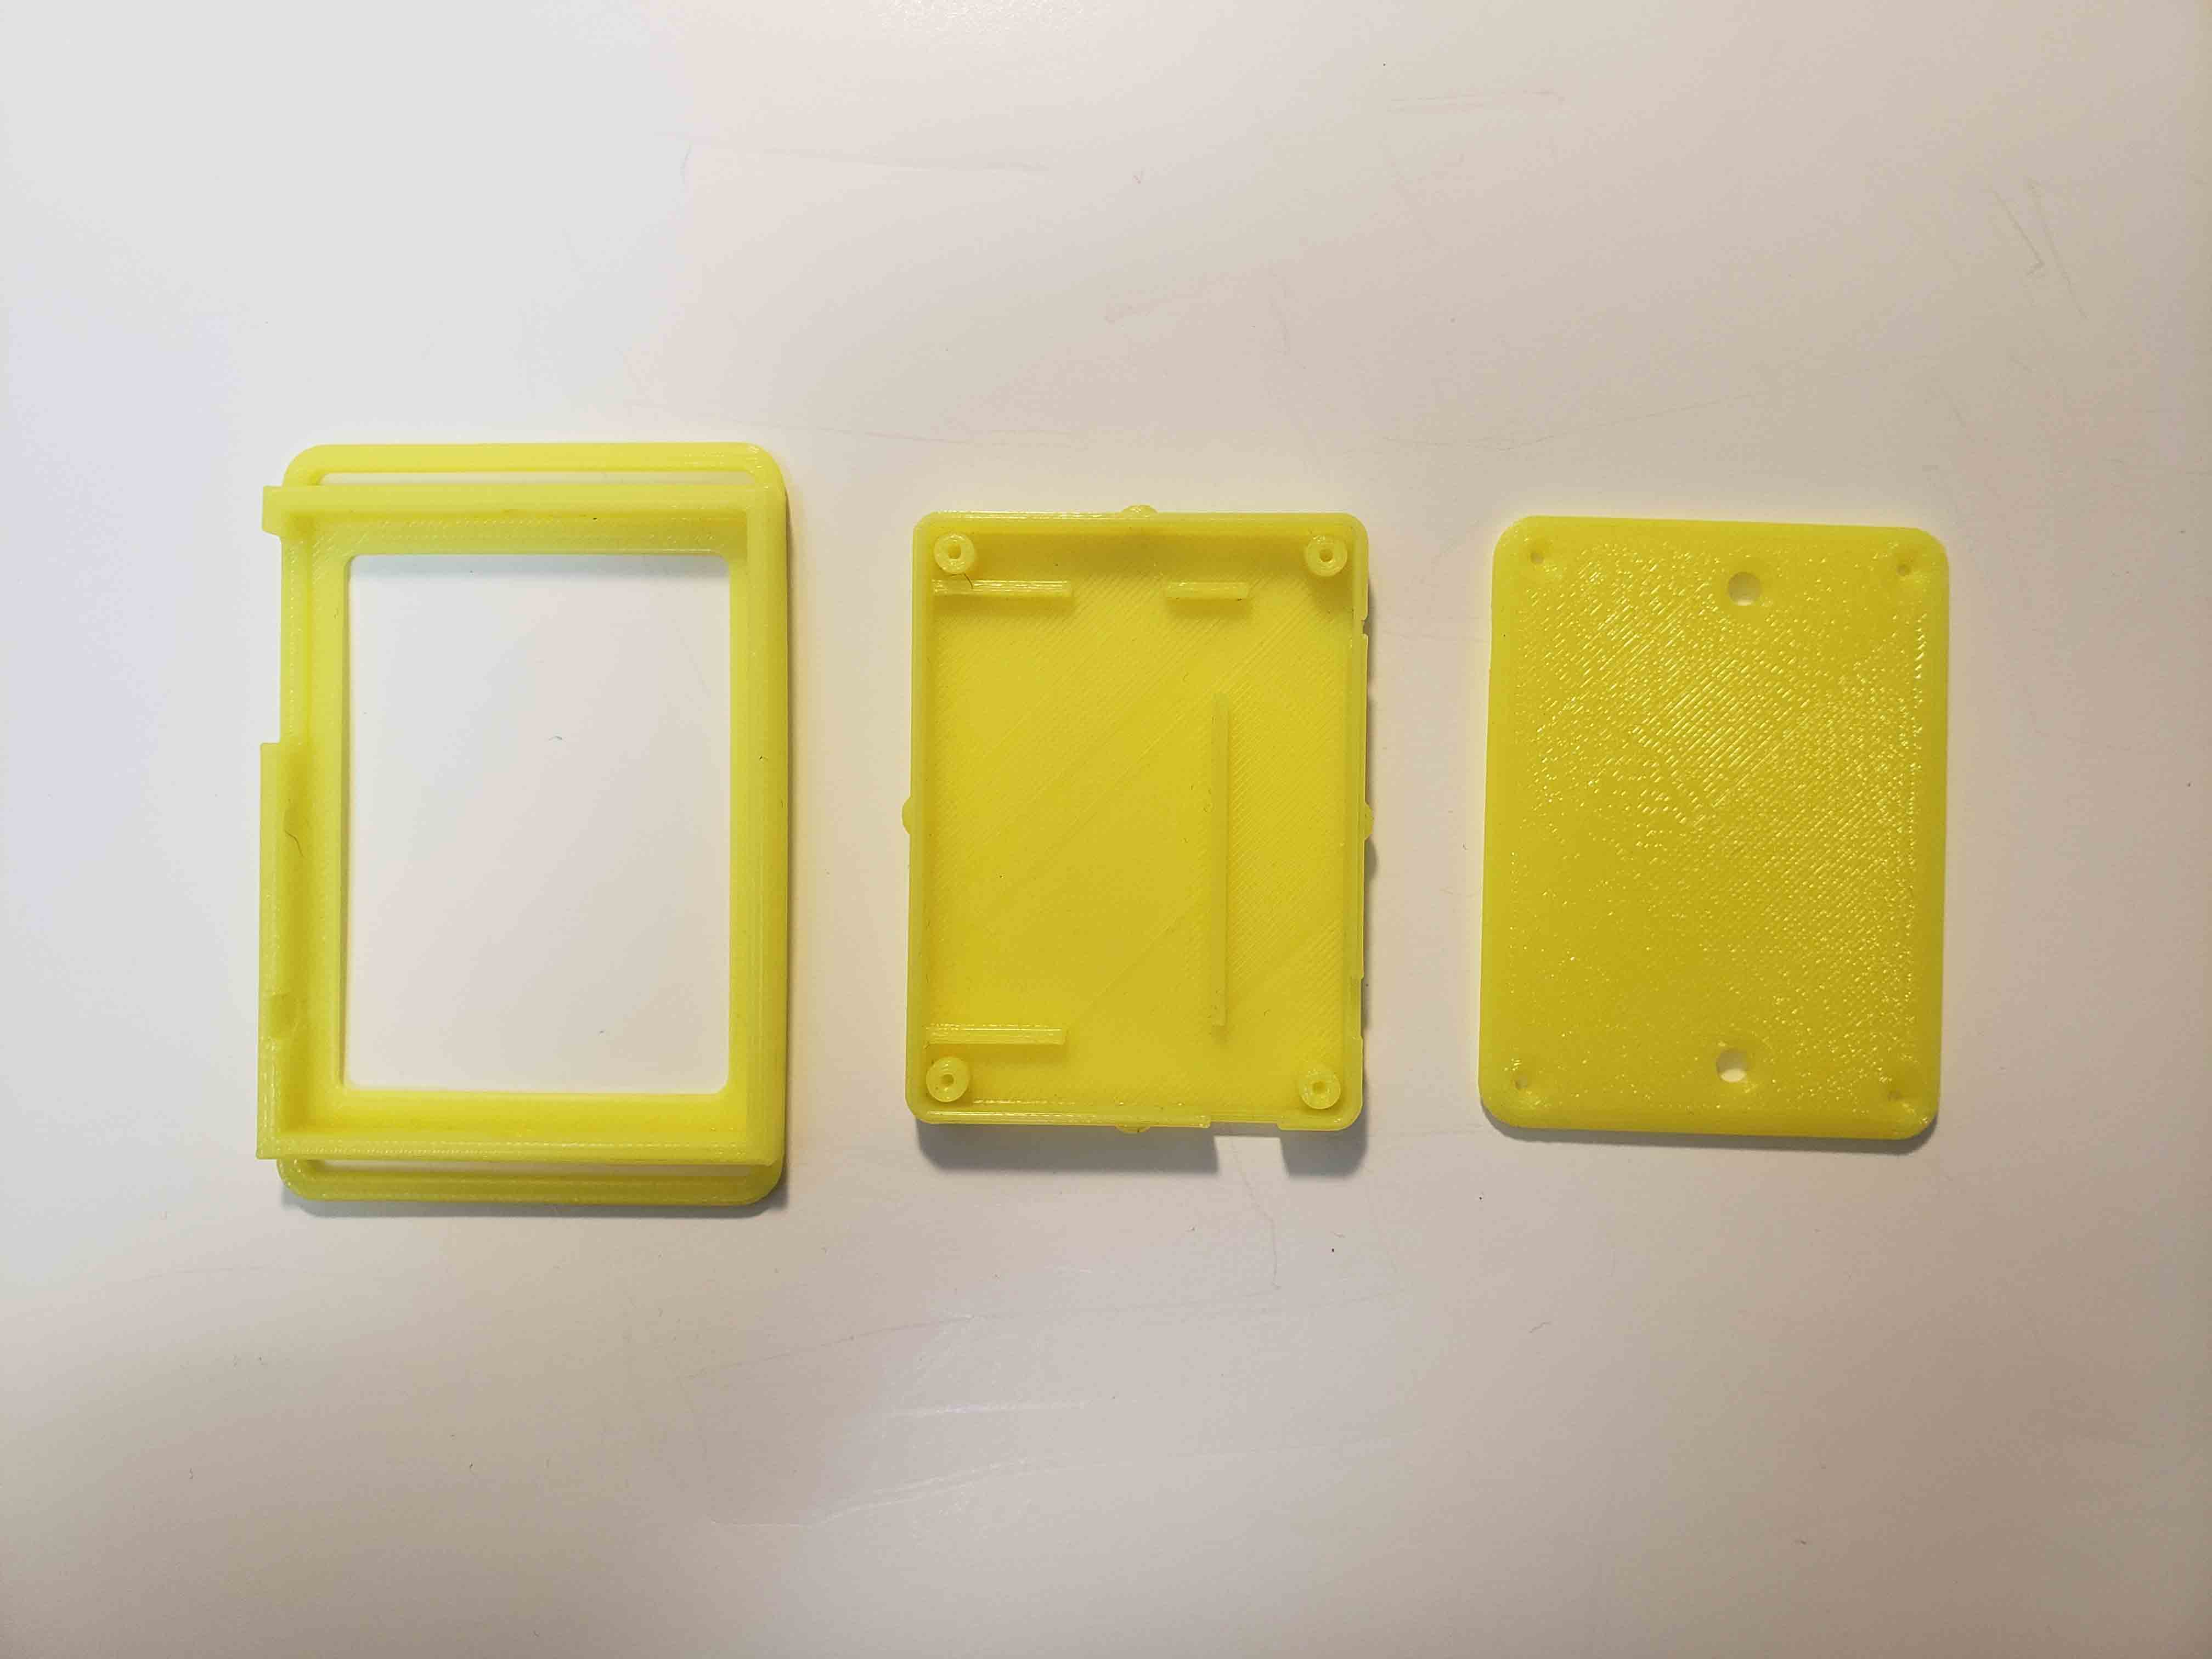
Case Housing Design – v1.1
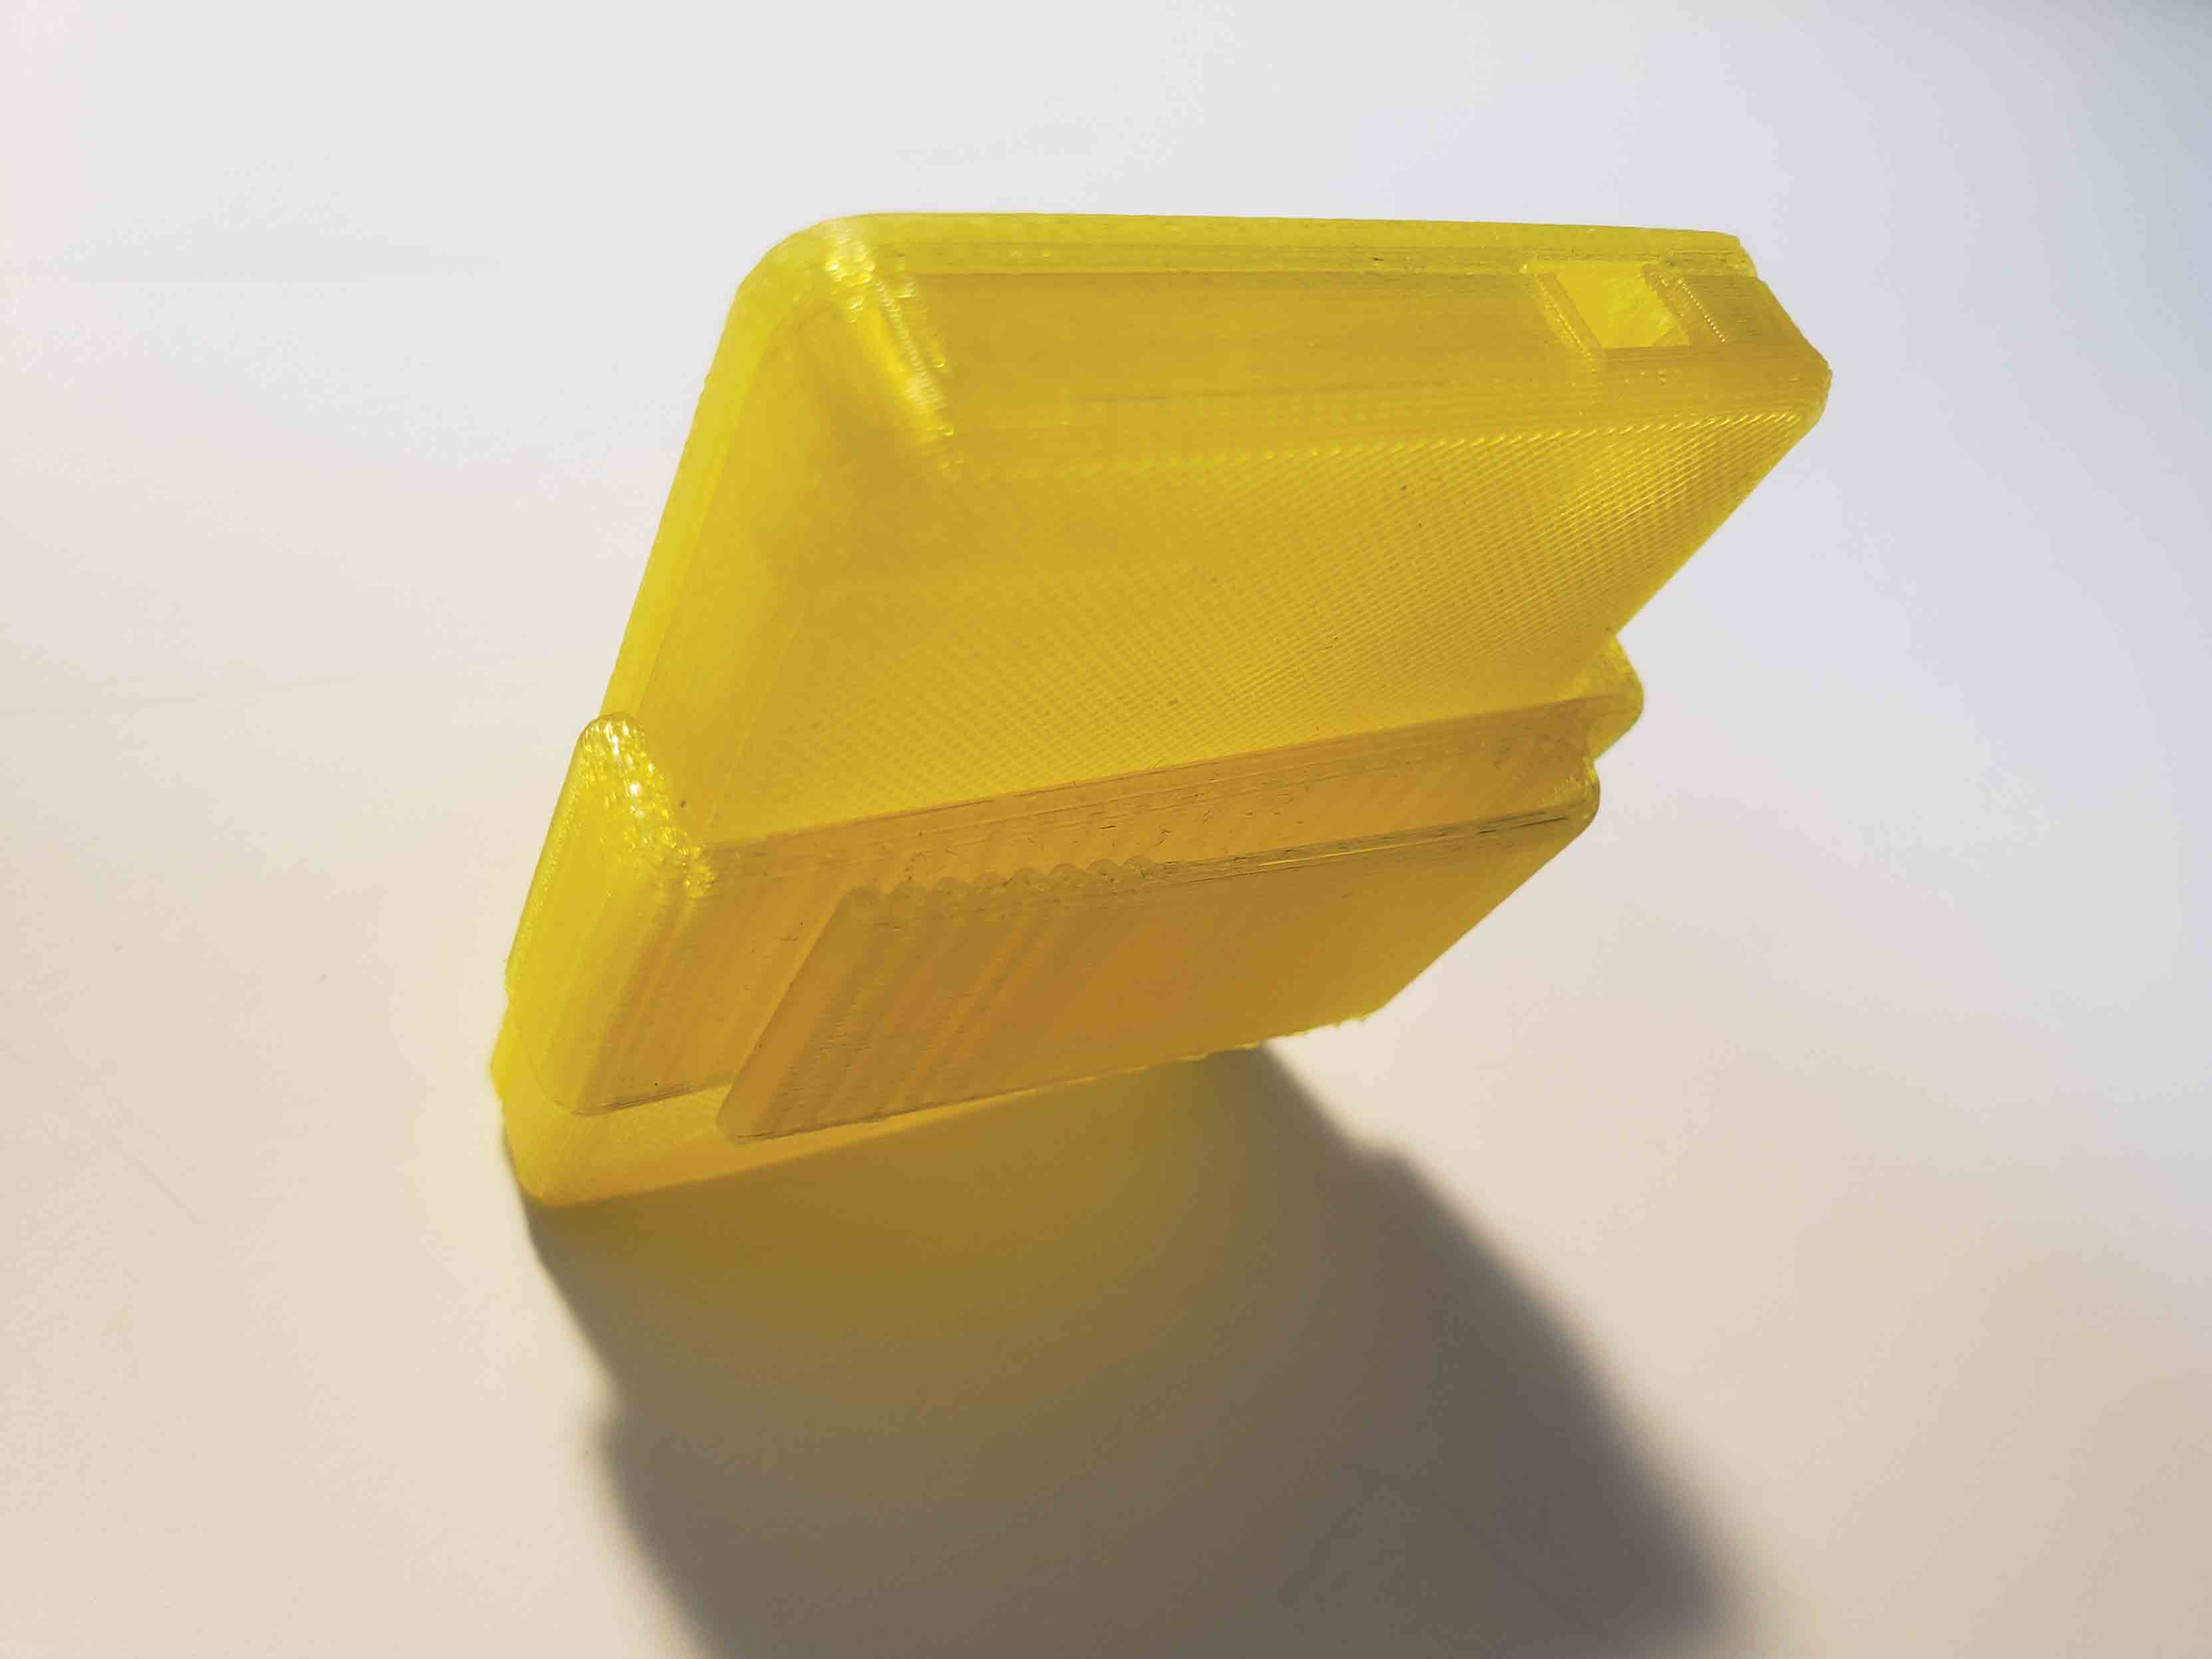
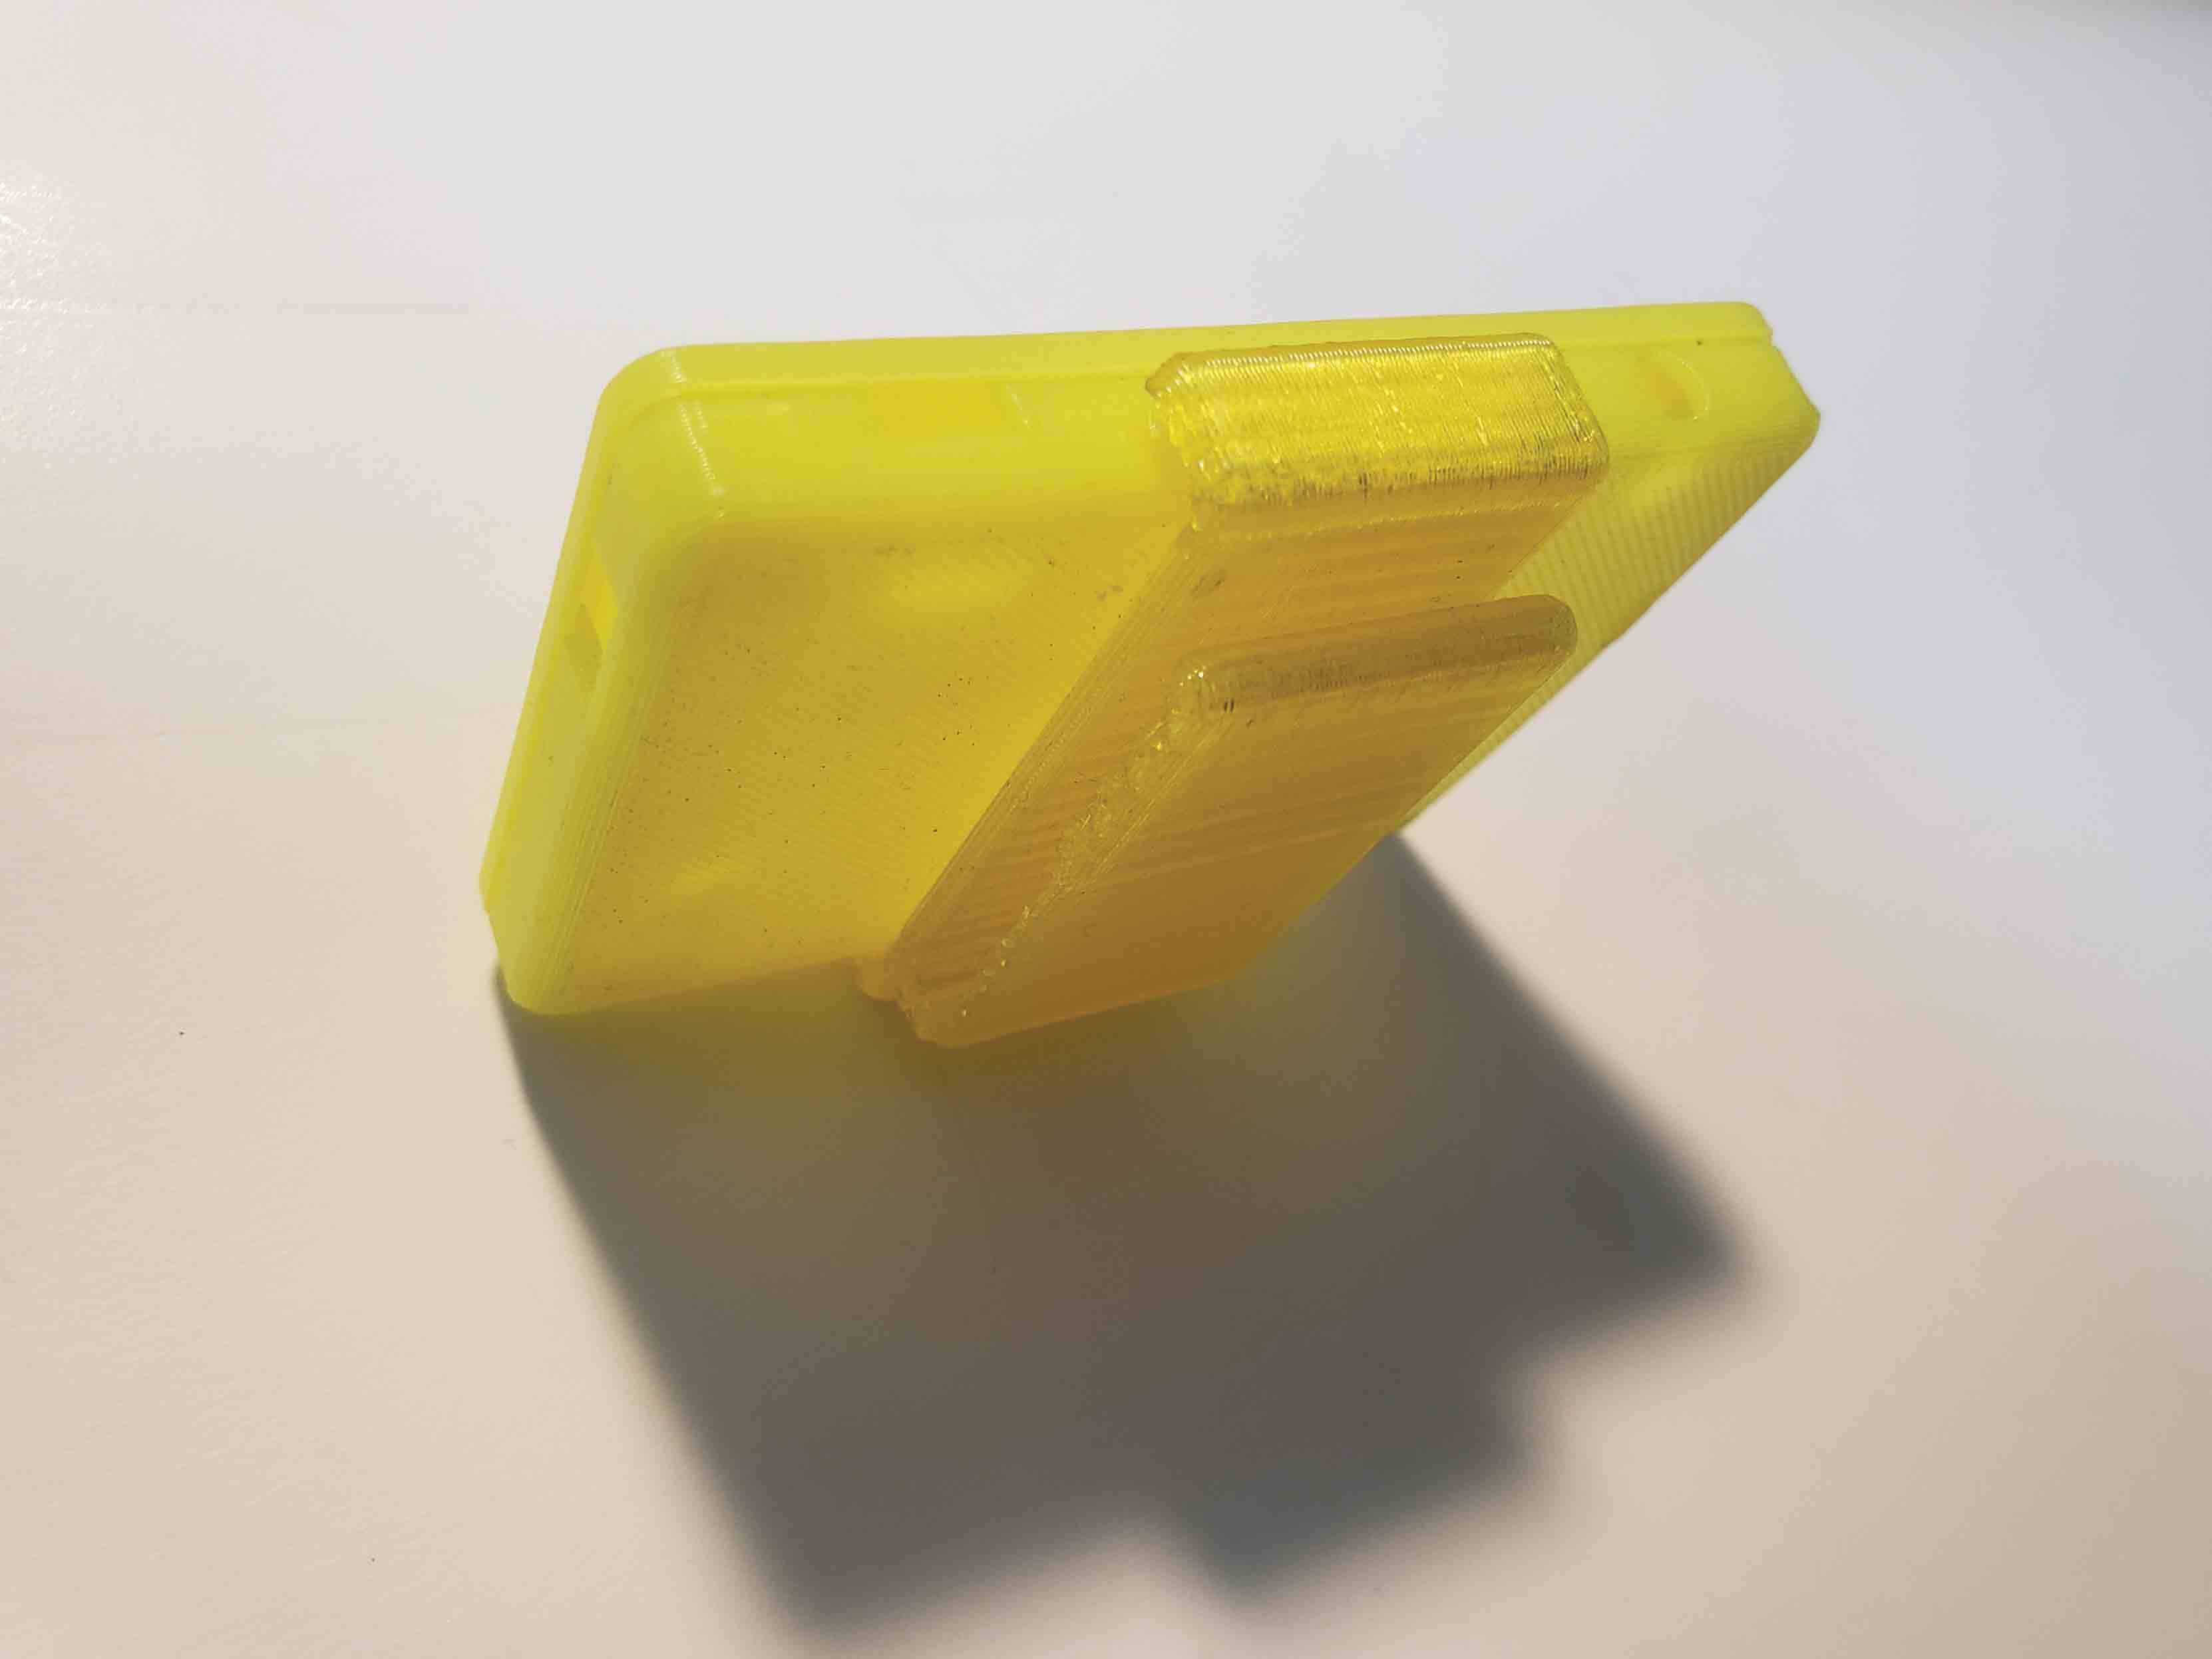
– Yellow Color Clip with Bottom and Lid Assembly Pic
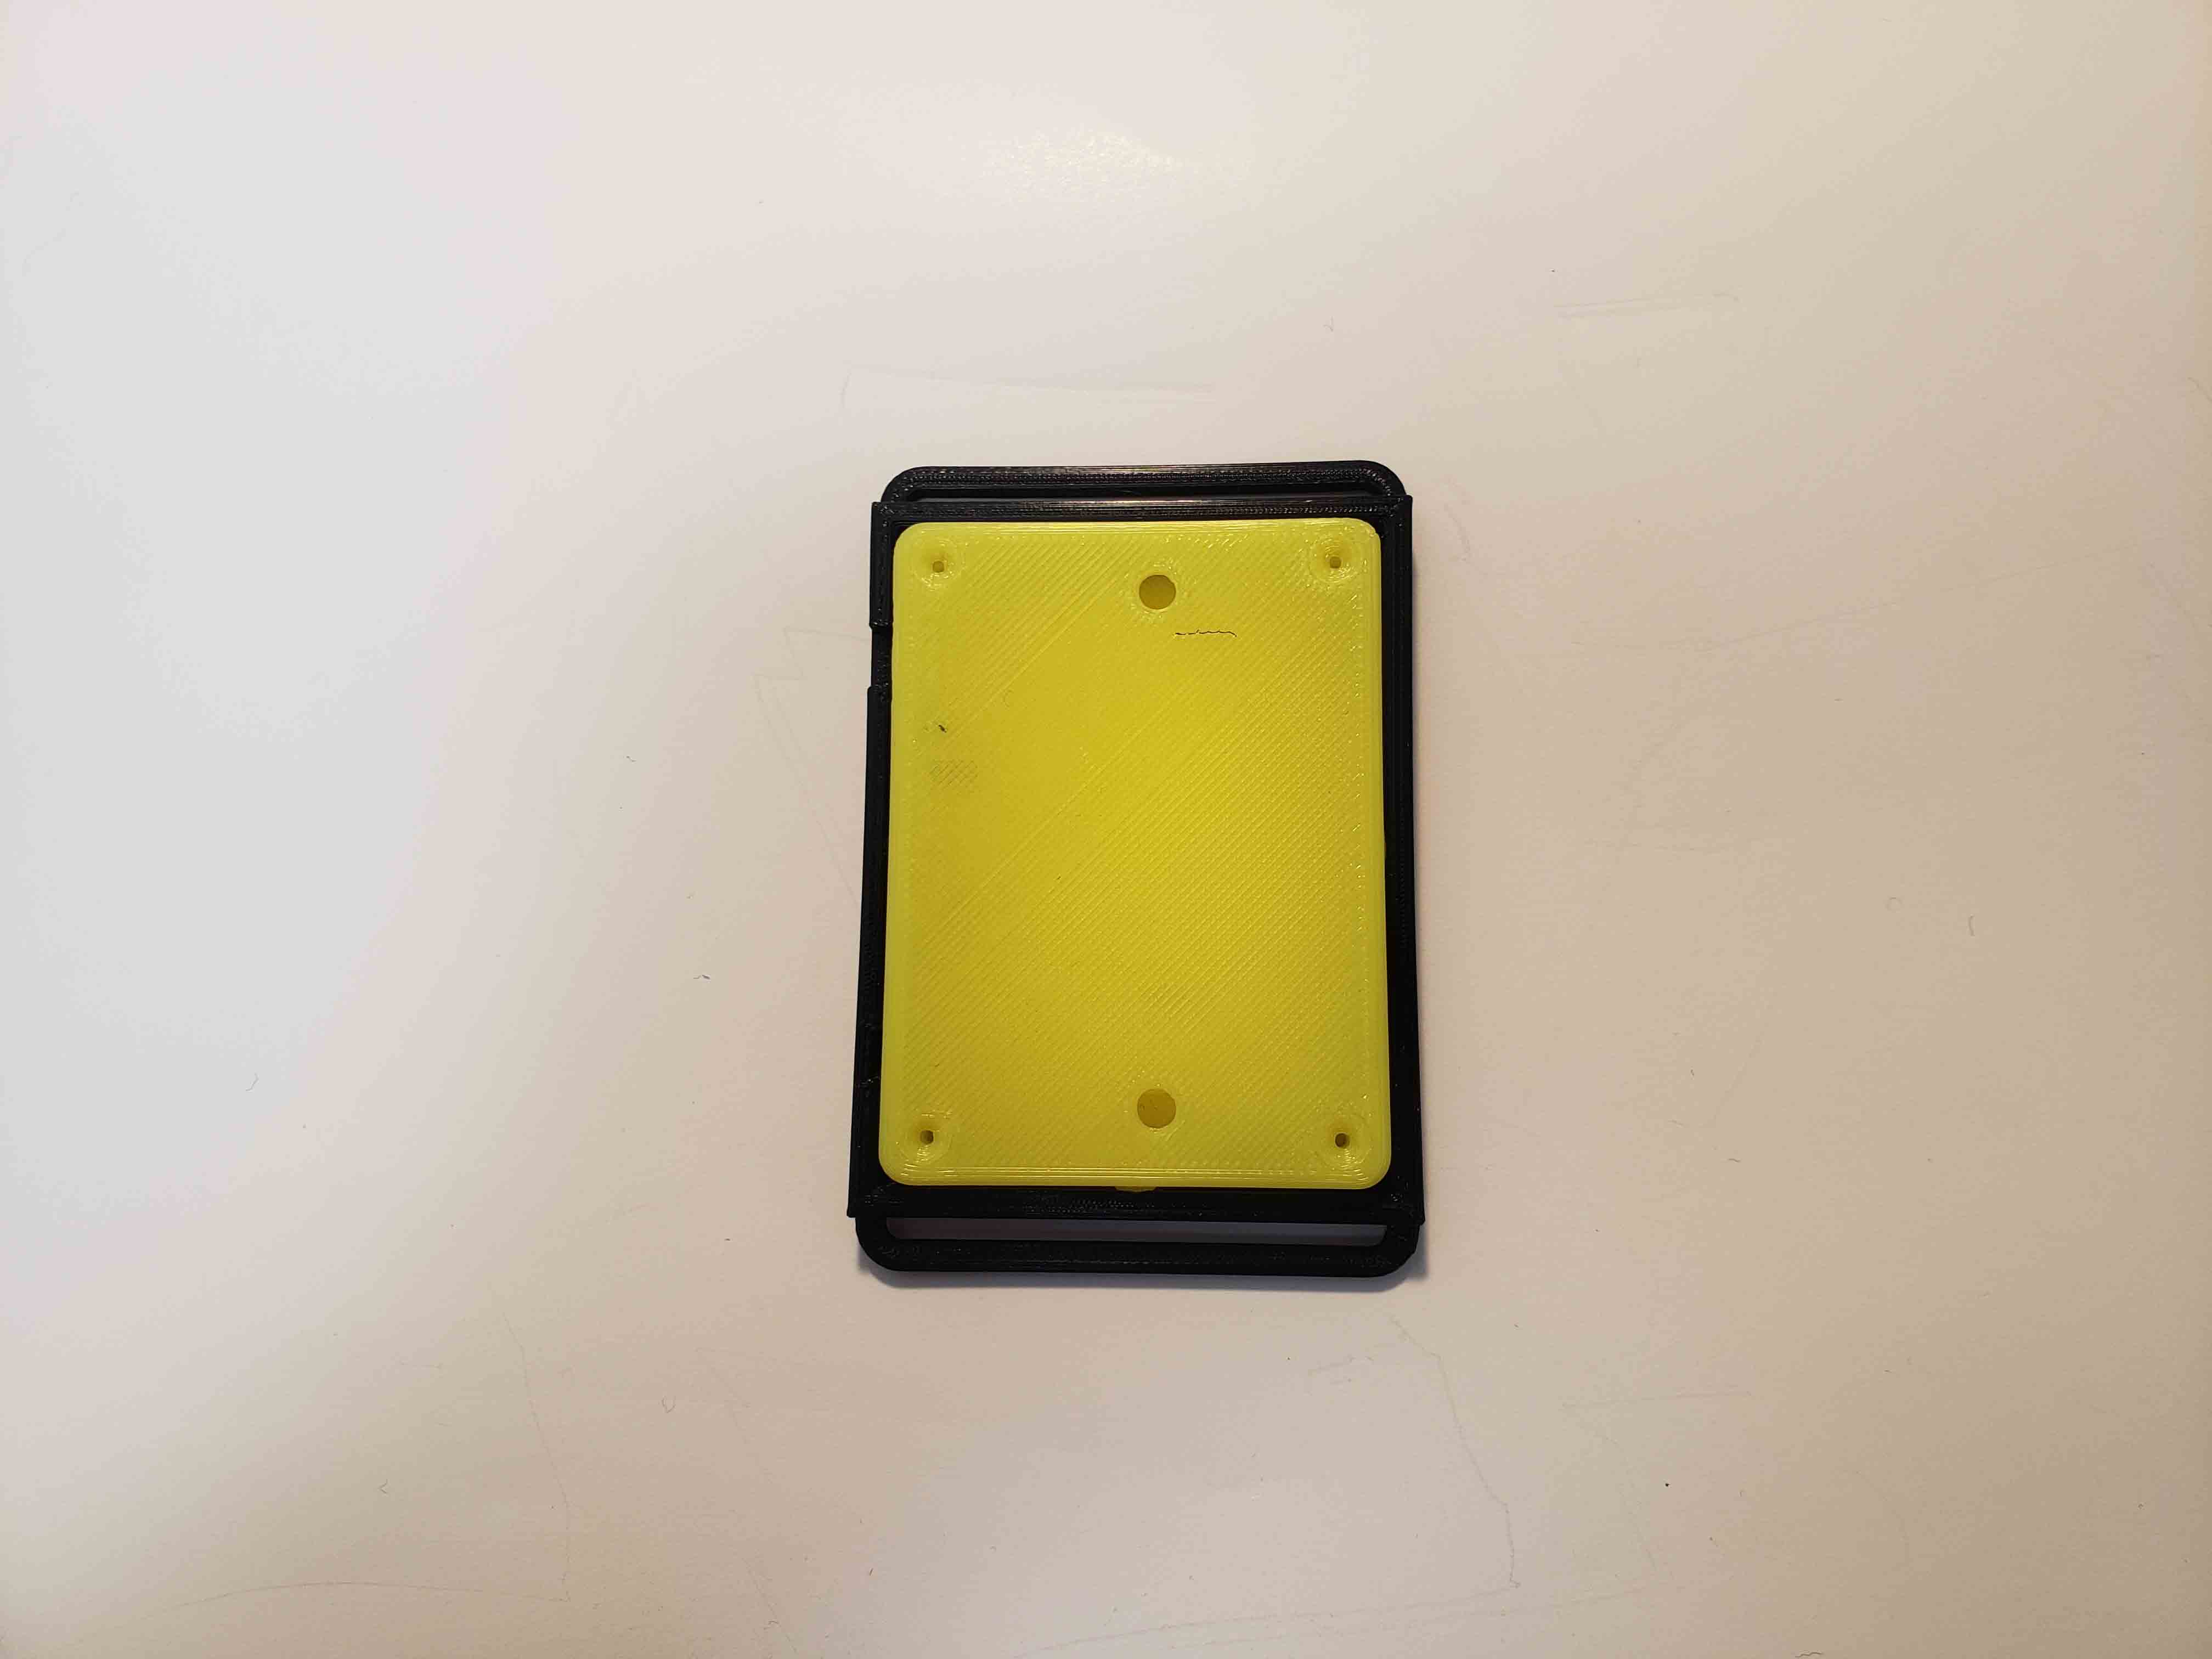
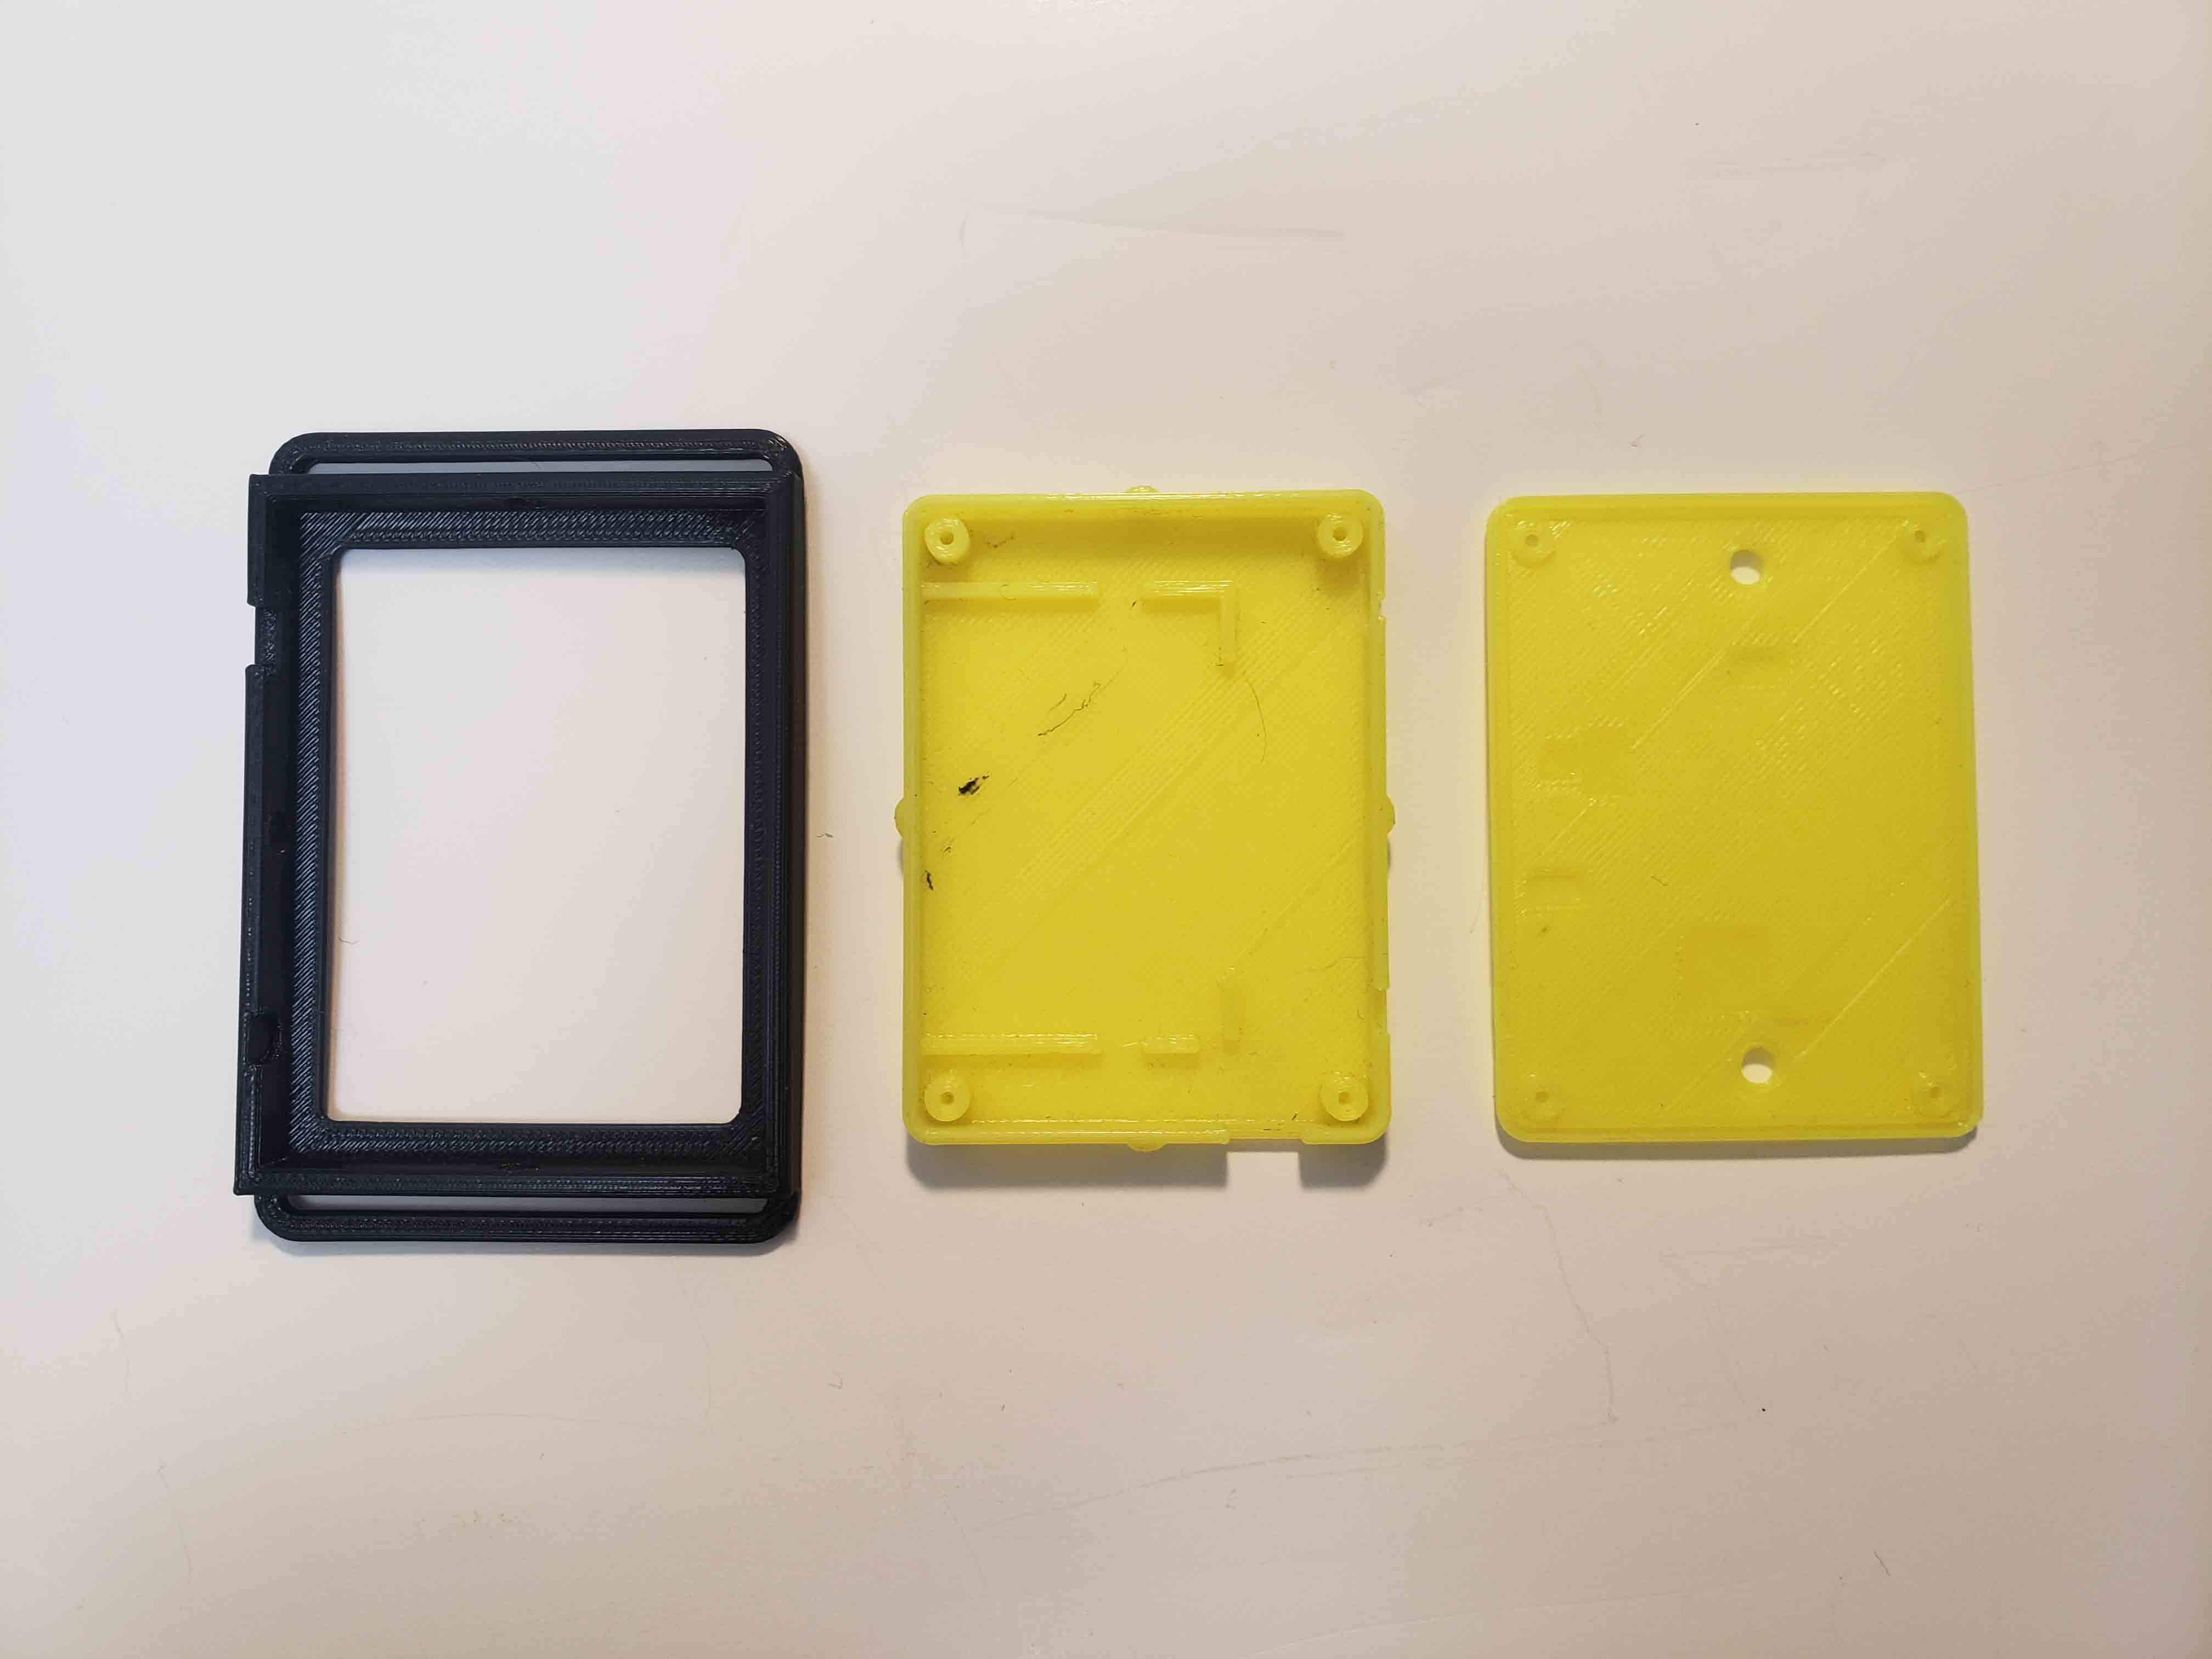
Case Housing Design – v1.0
– Black Color Clip with Bottom and Lid Assembly Pic
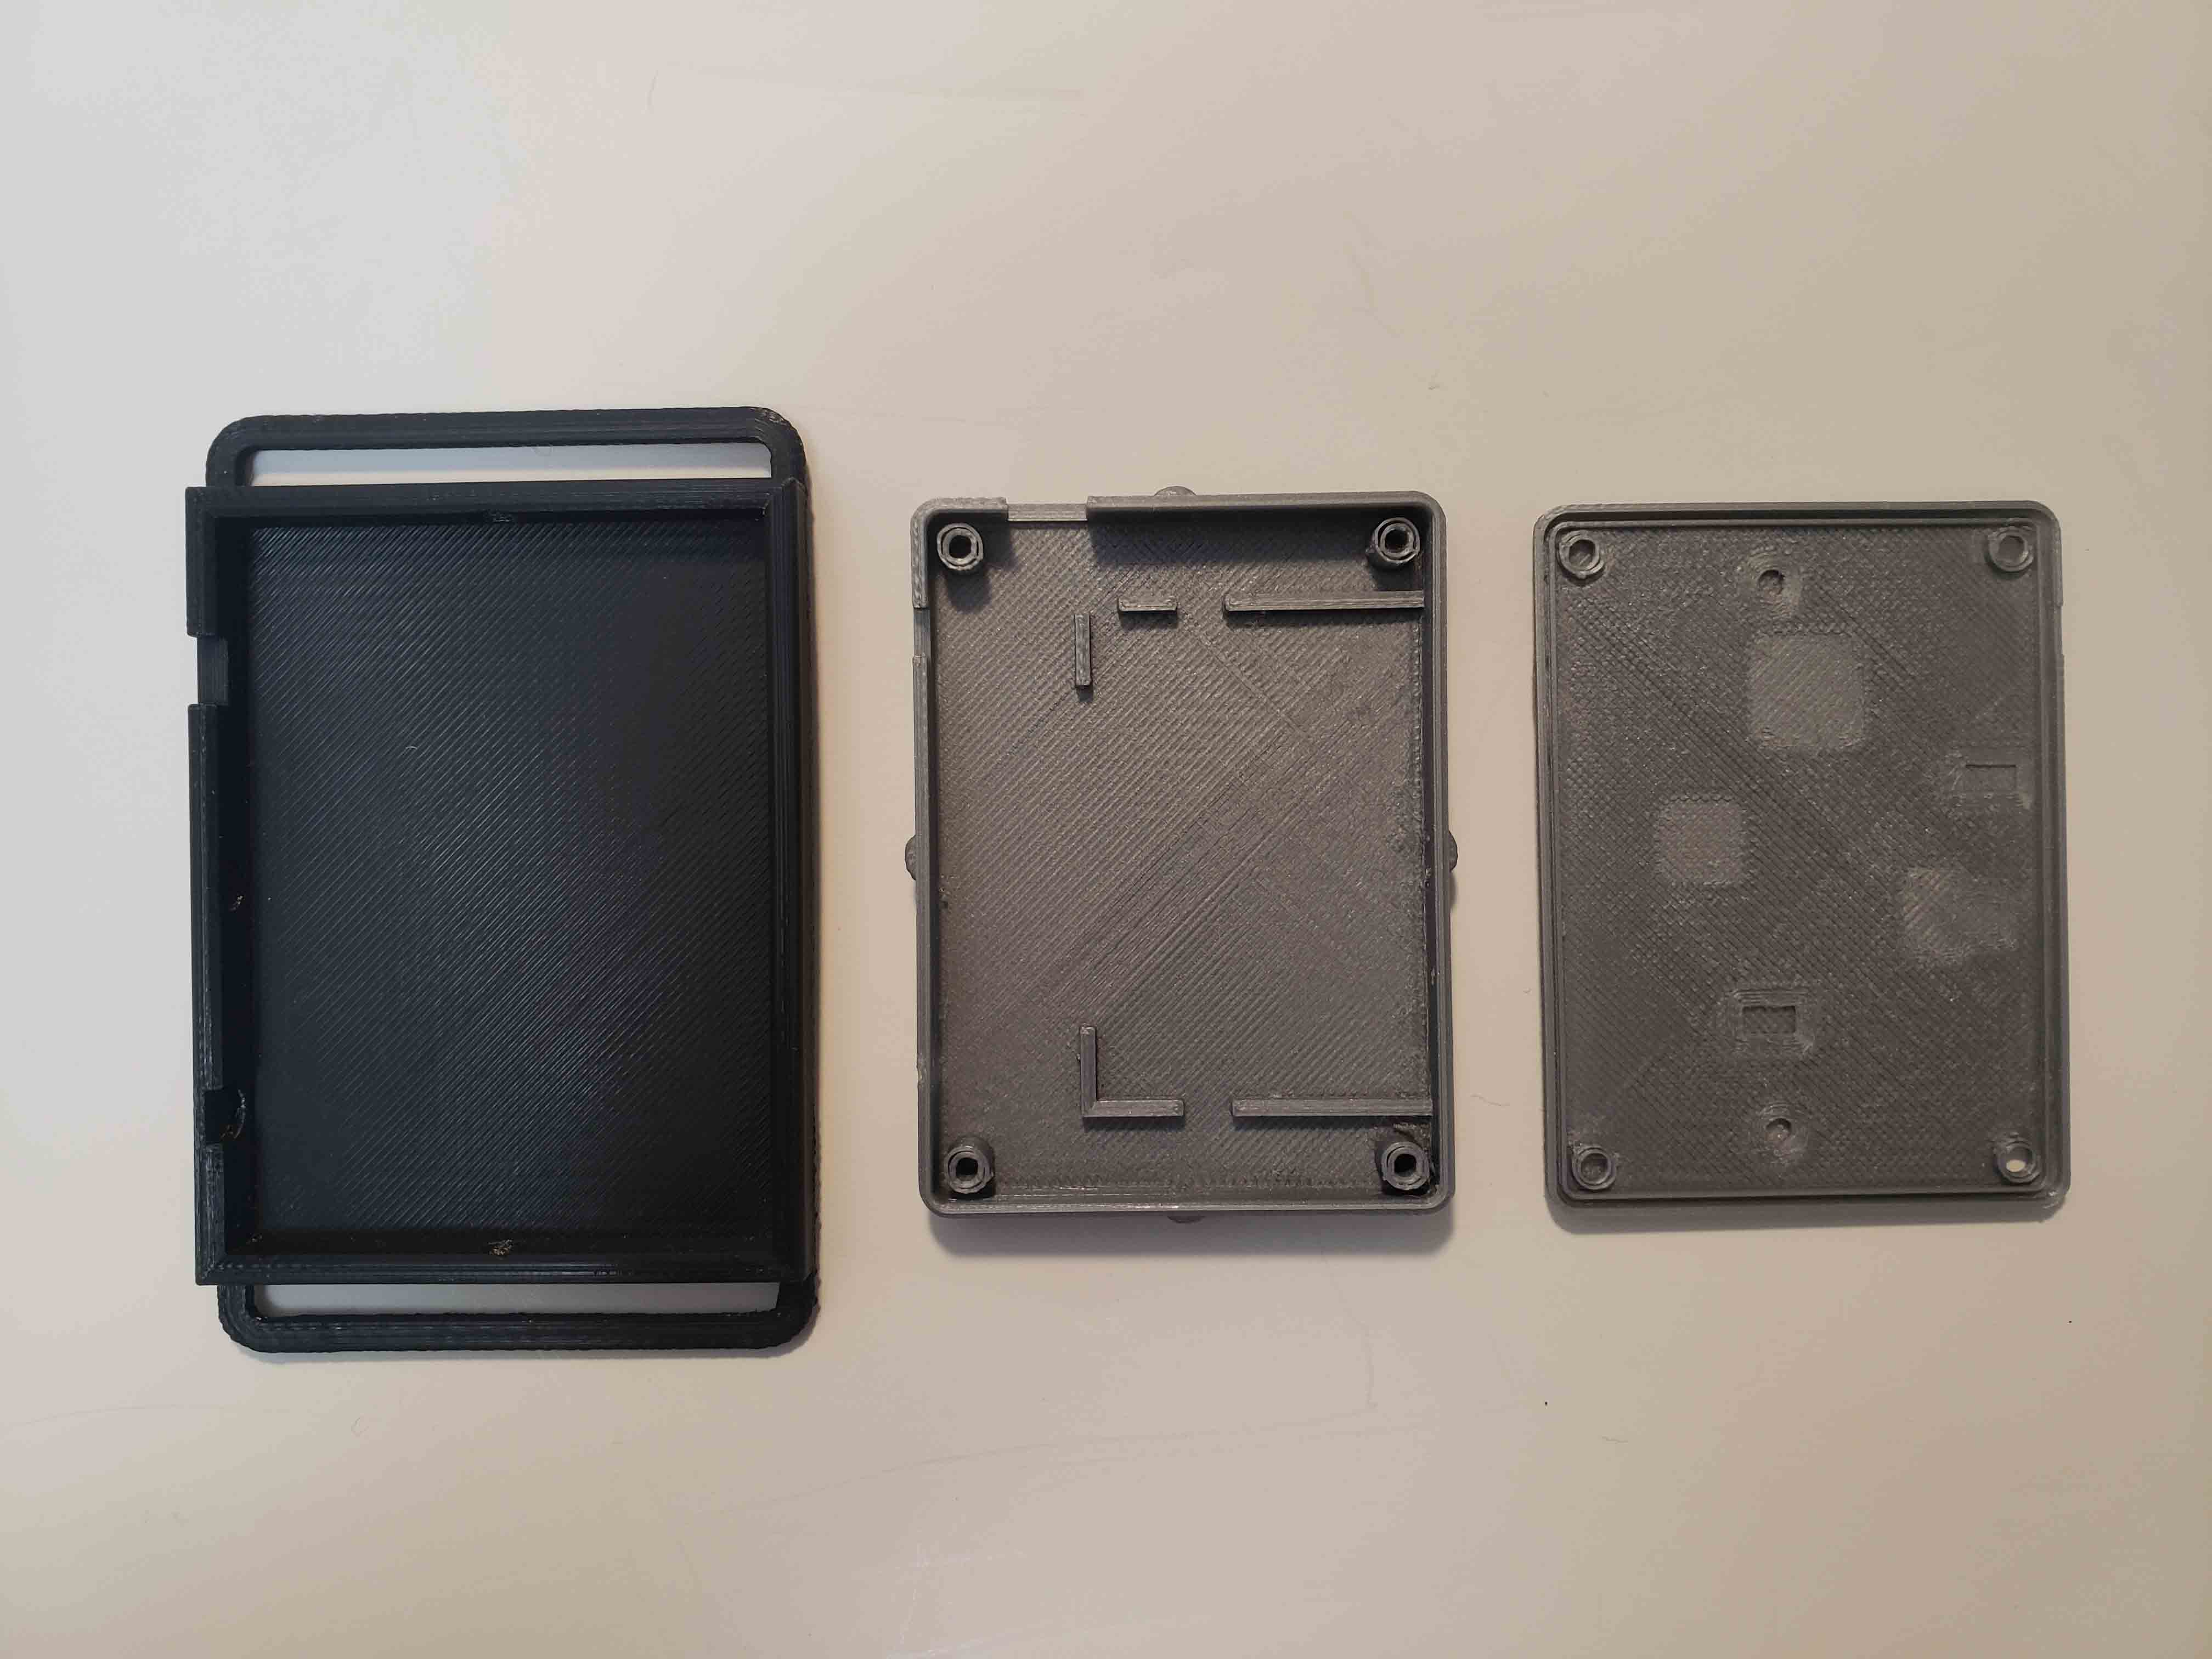
Case Housing Design – v1.2
– Prototype ECG Housing Black Color Clip and Grey Bottom and Lid
Case Housing Design – v1.1
– Prototype ECG Housing Yellow Color Through Hole
Case Housing Design – v1.0
– Prototype ECG Housing Black Color Through Hole
December 2016
Product Review and Re-design
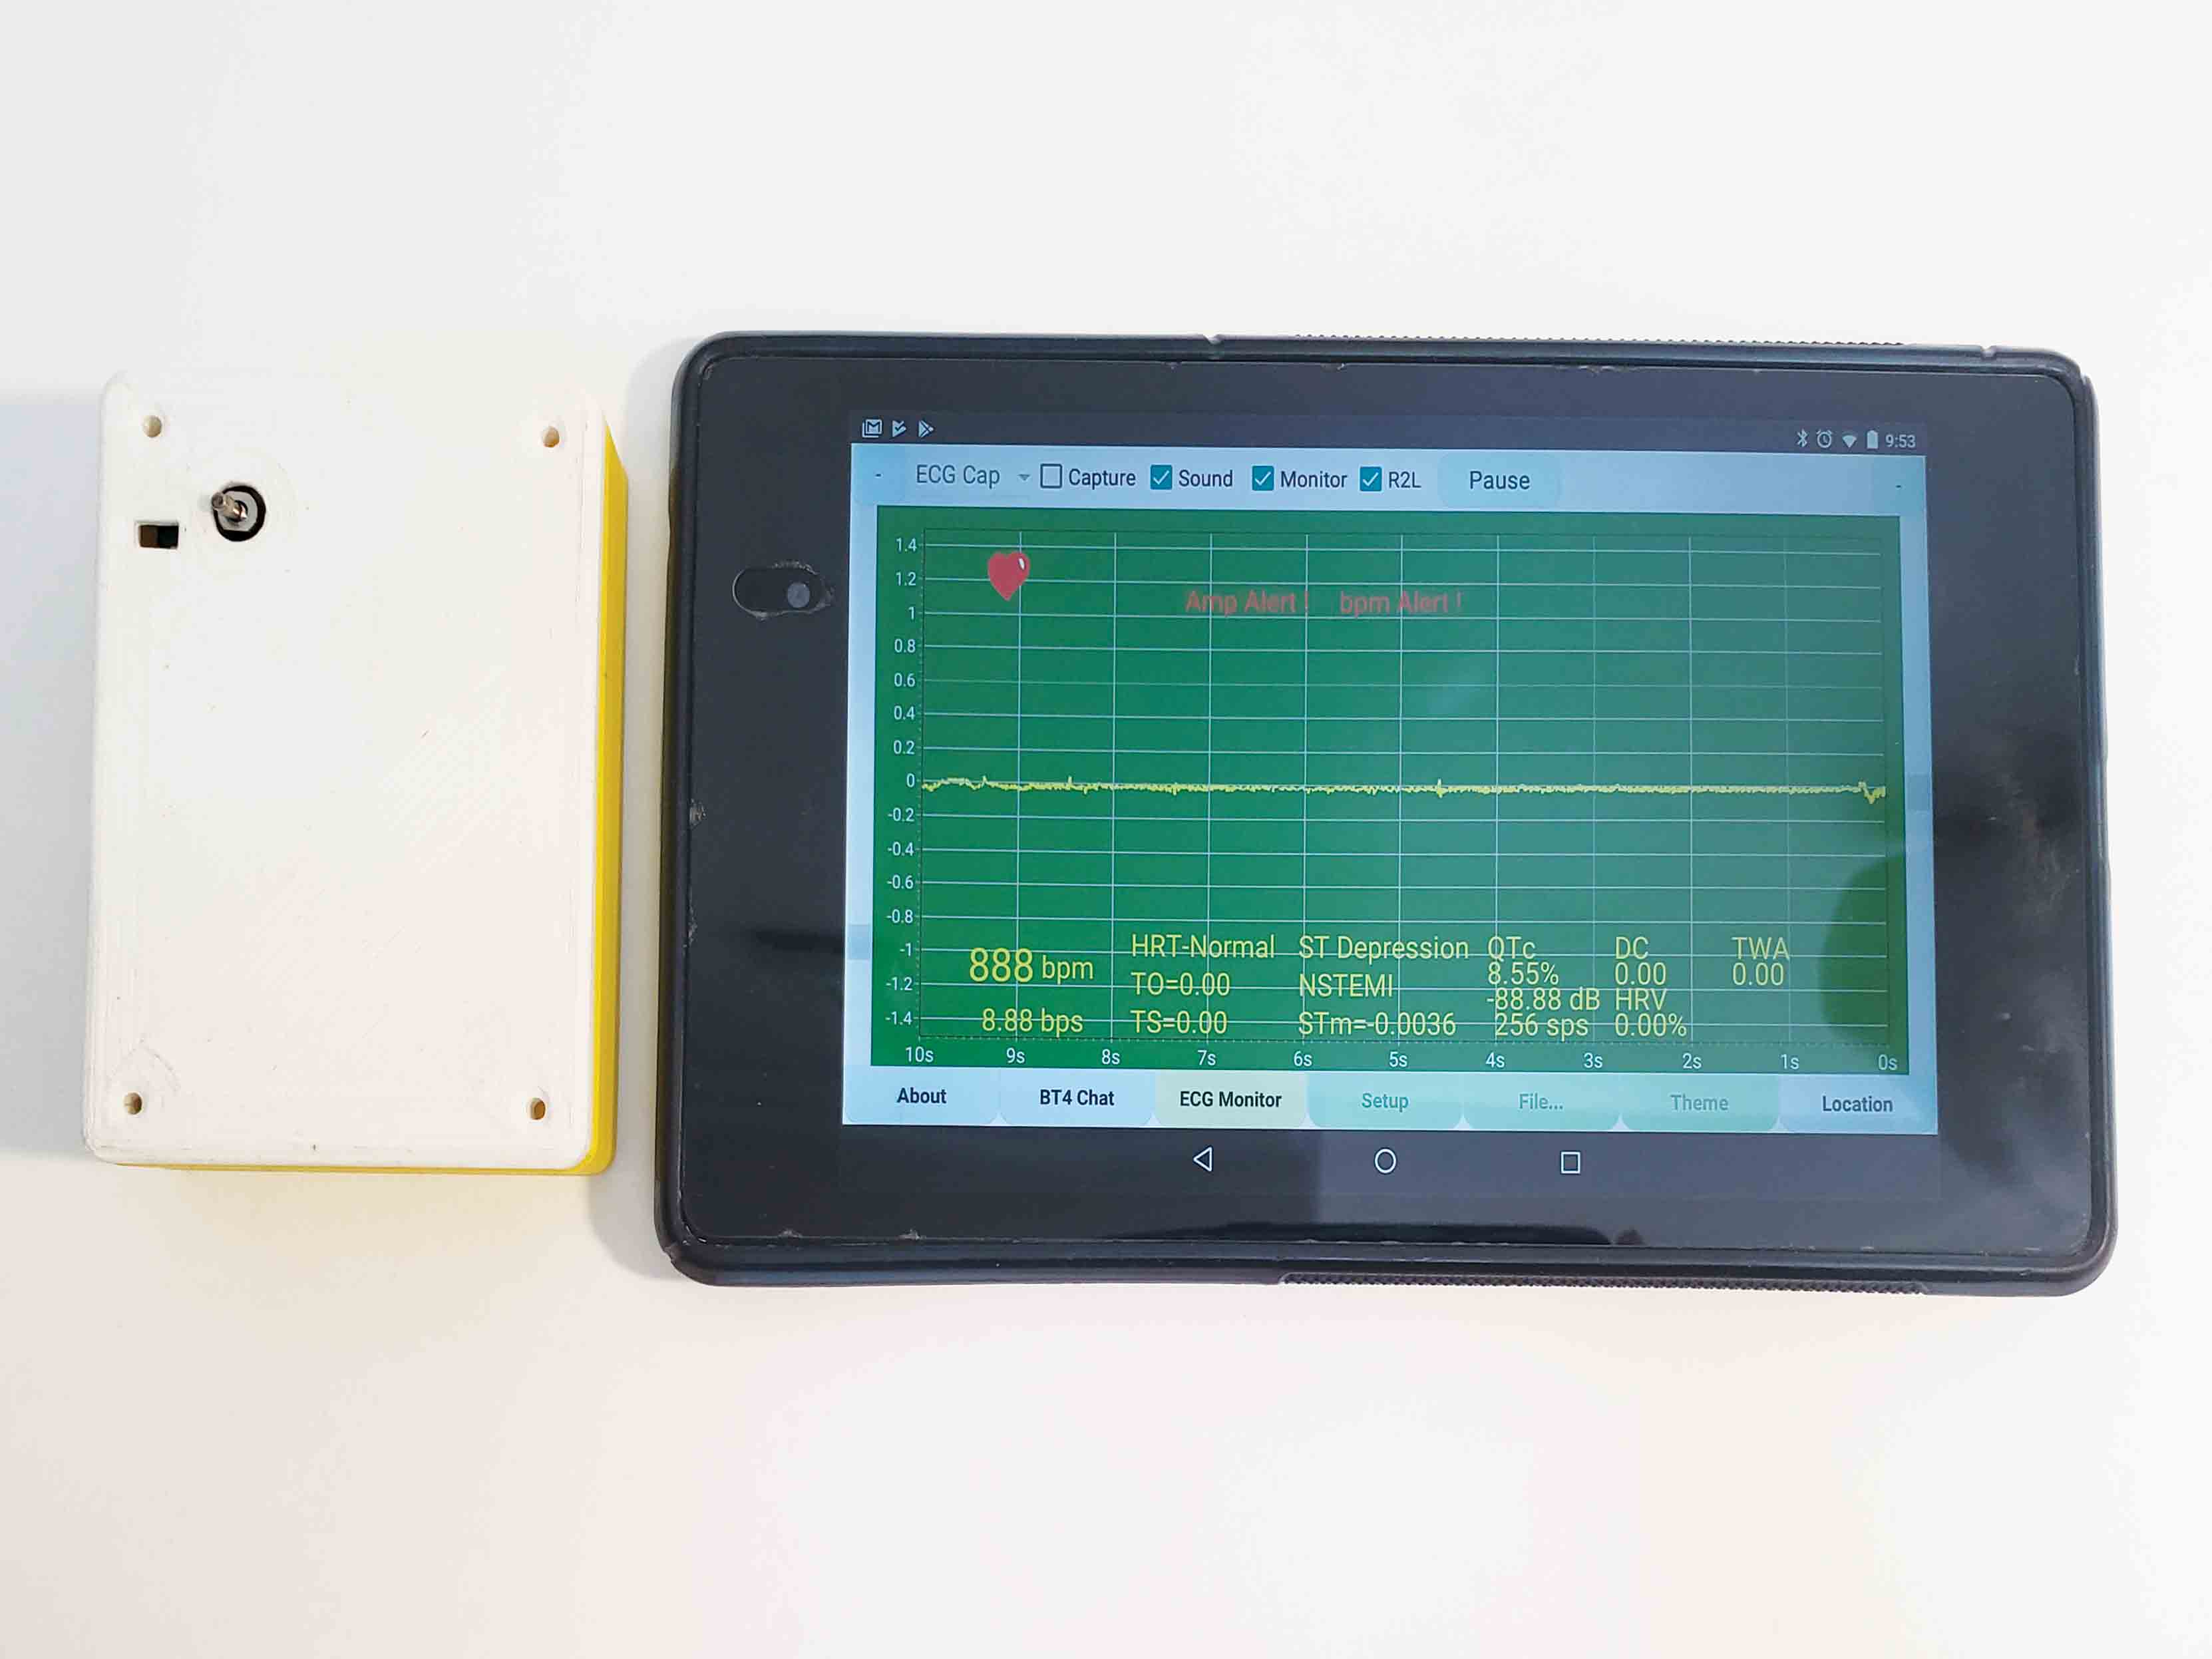
ecgMonitor Evaluation Test with Prototype
ecgMonitor is transmitting signal to an Android Tablet (Nexus 7). The grounding signal is captured from the ecgMonitor device to the Android Tablet (Nexus 7).
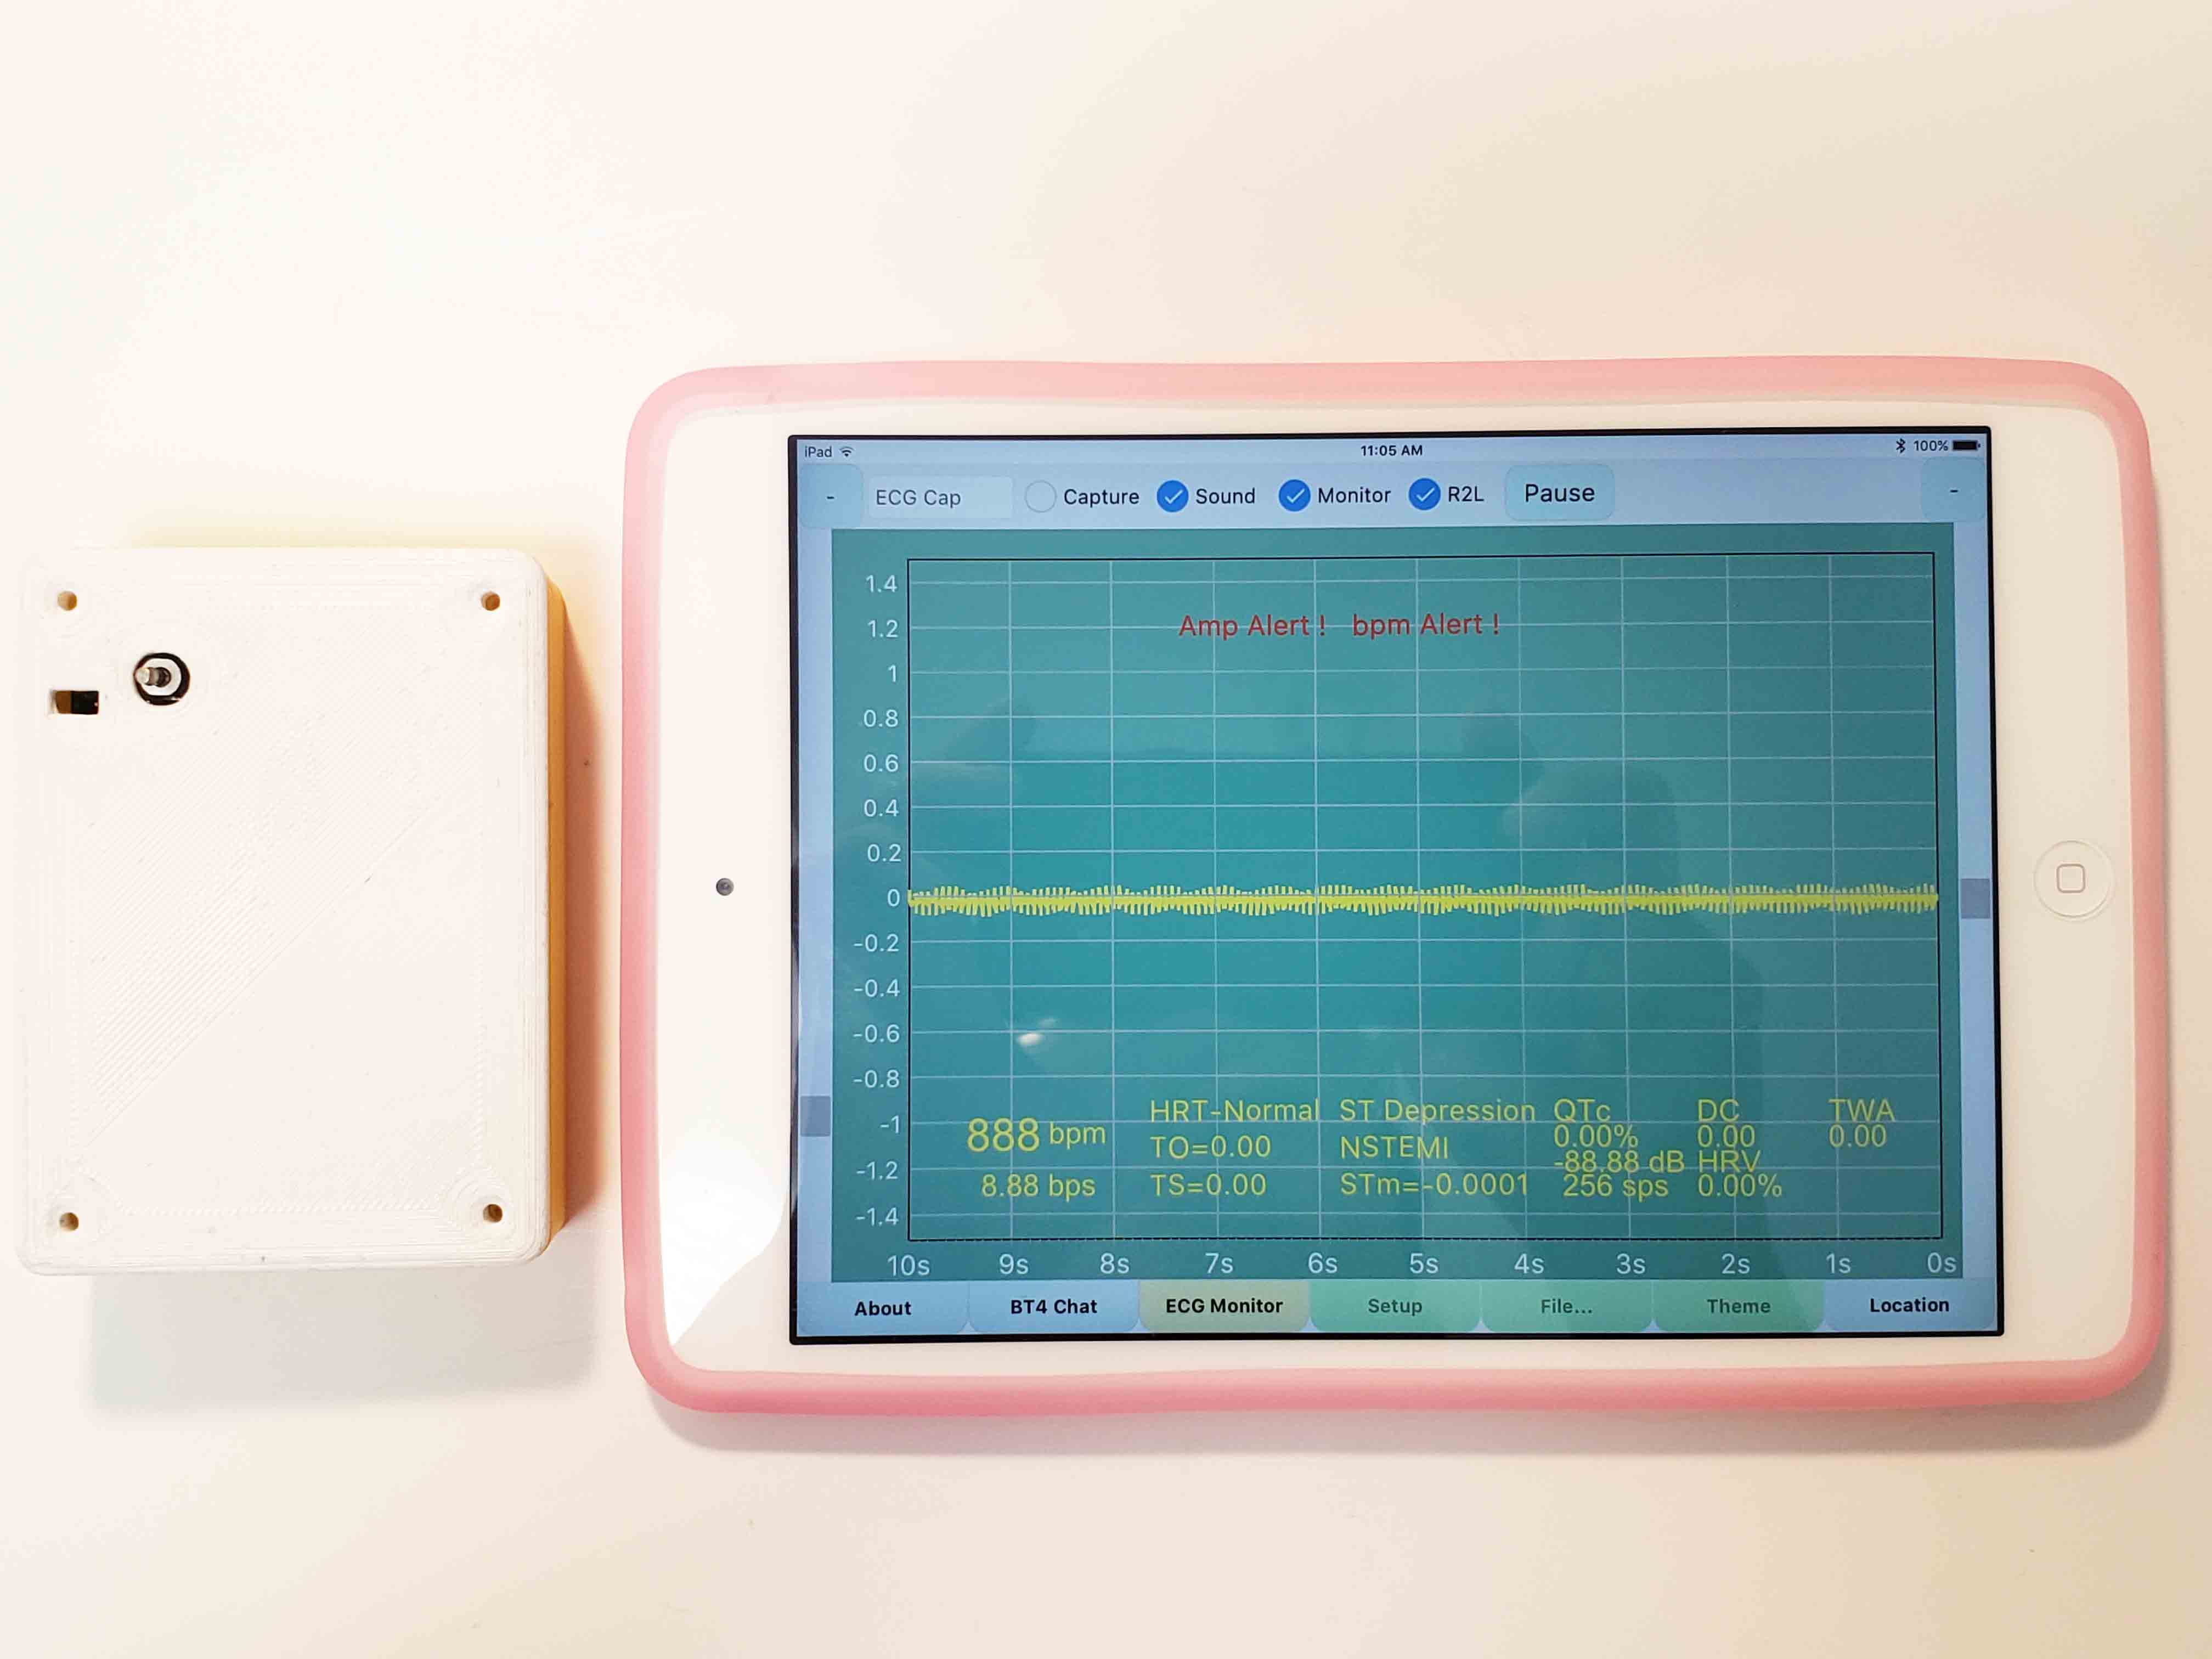
ecgMonitor Evaluation Test with Prototype
ecgMonitor is transmitting signal to an Apple iPad Mini. The noise signal 50Hz/60Hz is captured from the ecgmonitor device to the Apple iPad Mini.
ecgMonitor Evaluation Test with Prototype
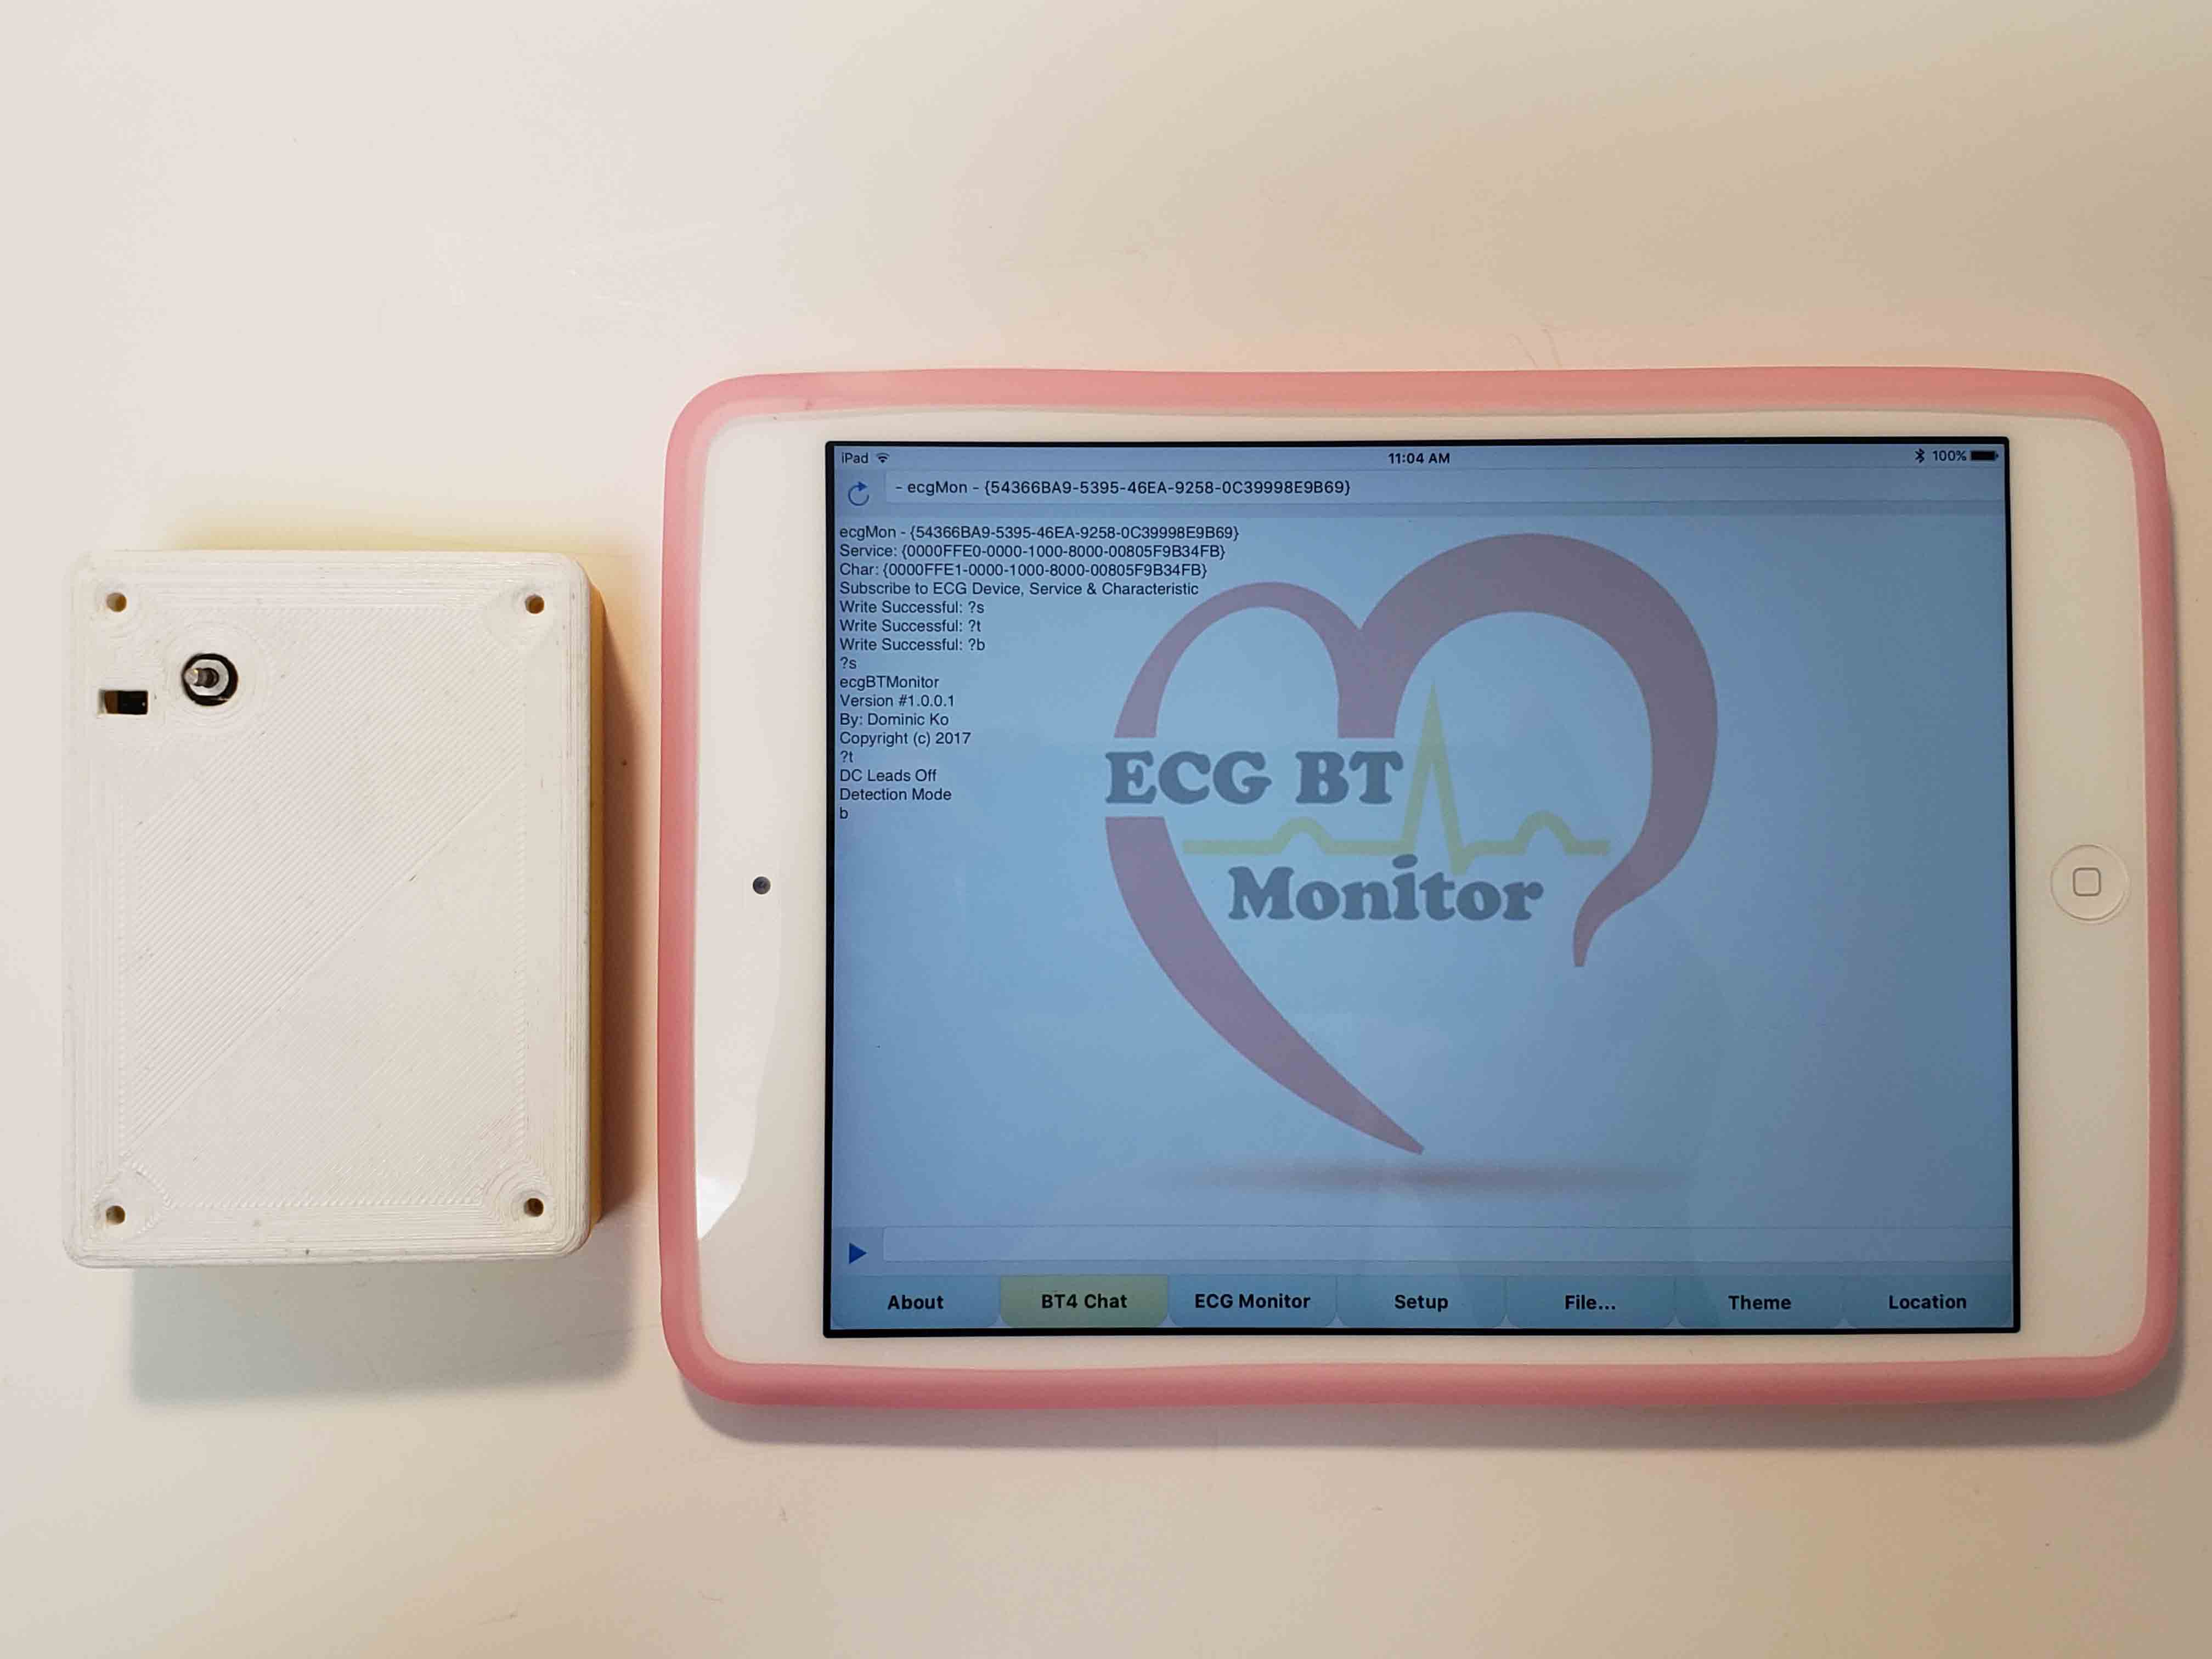
ecgMonitor / BT4 is communicating with an Apple iPad Mini. The BT4 Chat page shows ‘Logon’ successfully with the Apple iPad Mini.
November 2015
Product Evaluation
ECG Monitor – Analysis
The following heart signals will be measured by
'Cardiac' or 'Heart' mode:
Heart Beat - bpm or bps
       HRT - Heart Rate Turbulence
        ST - ST Segment Analysis
       QTc - QT Analysis
     AC/DC - Acceleration and Deceleration Capacity
       HRV - Heart Rate Variability
       TWA - T-Wave Alternans
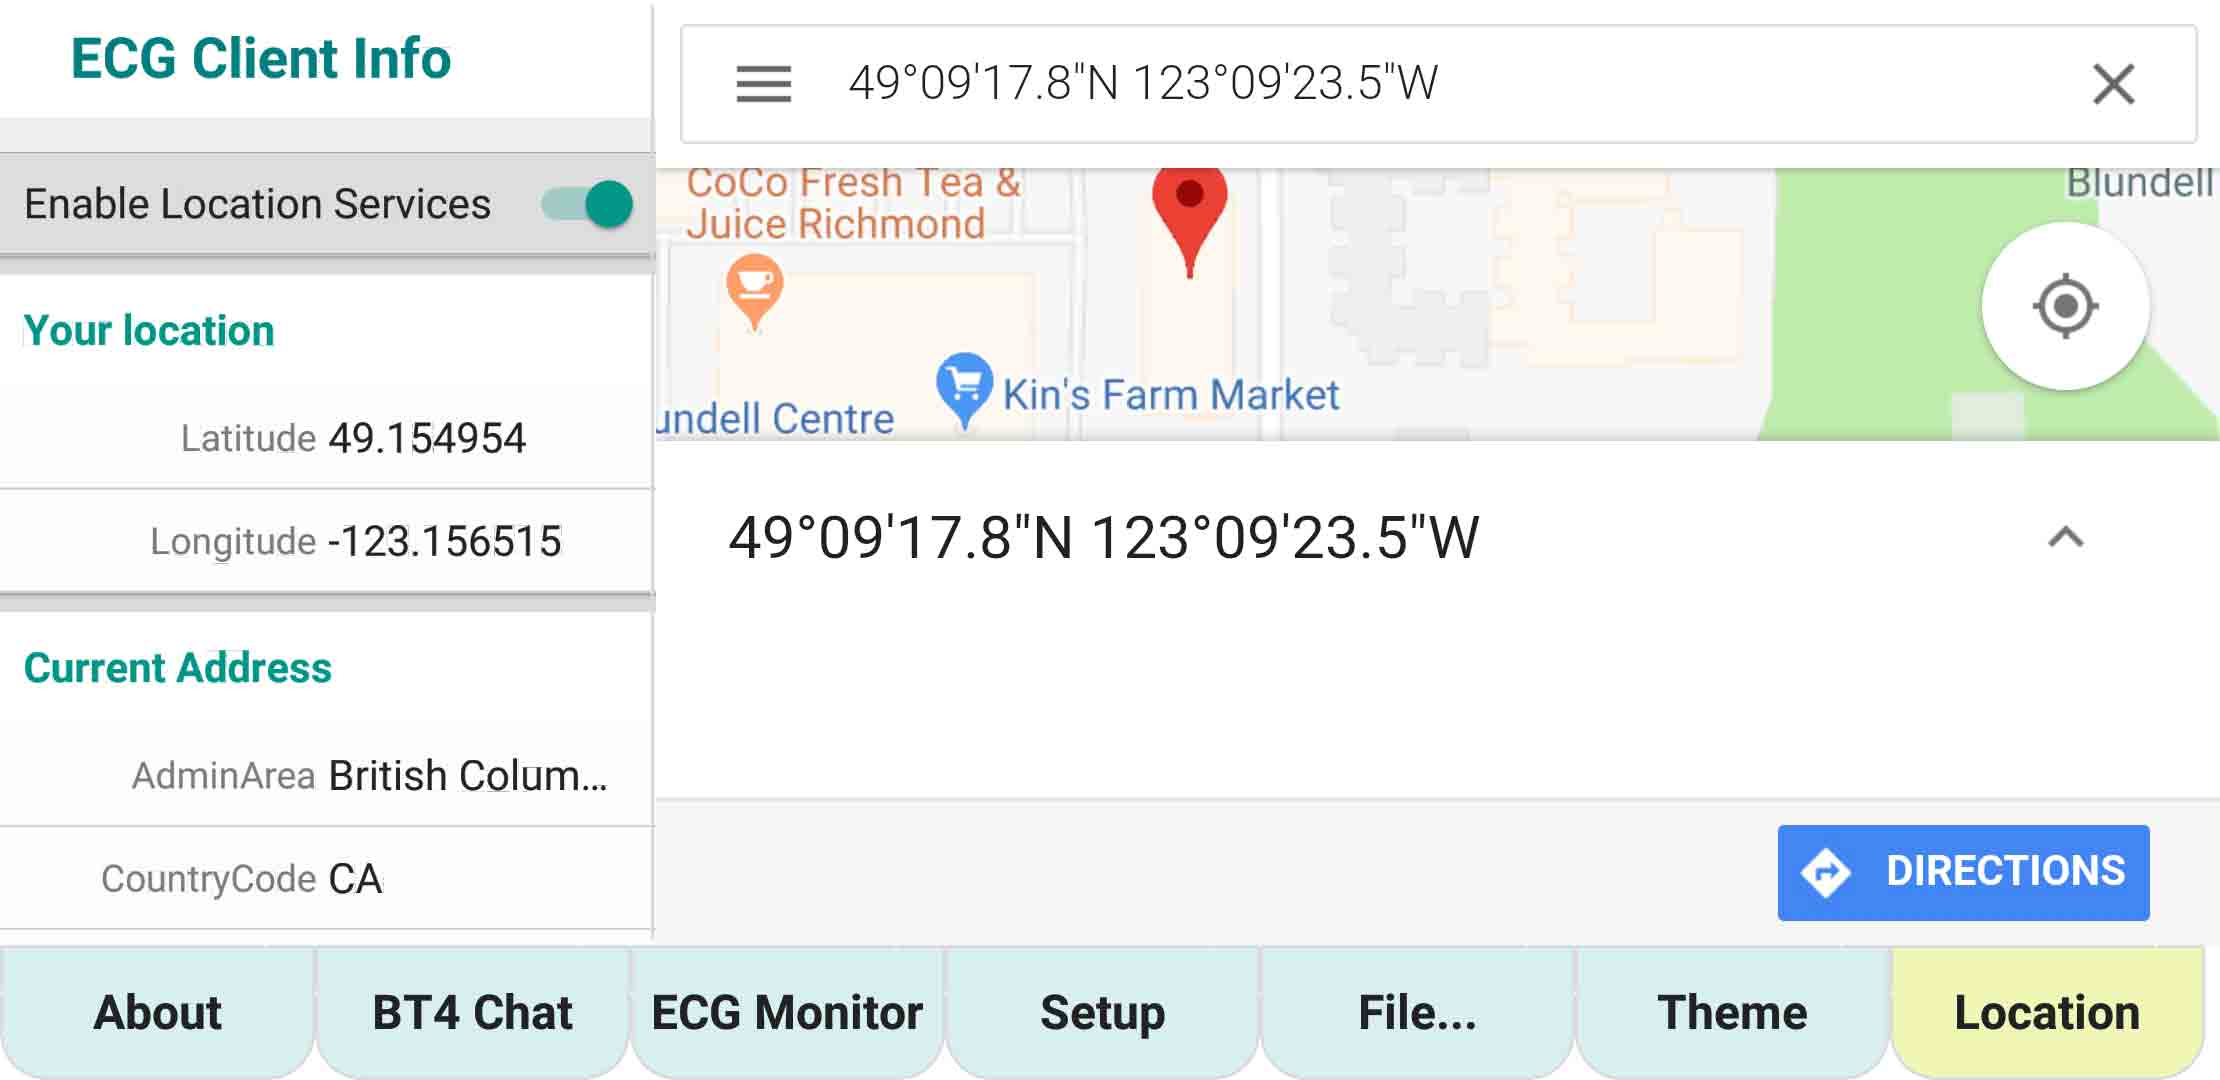
ecgMonitor – ‘Location’ page – Client Location Monitor
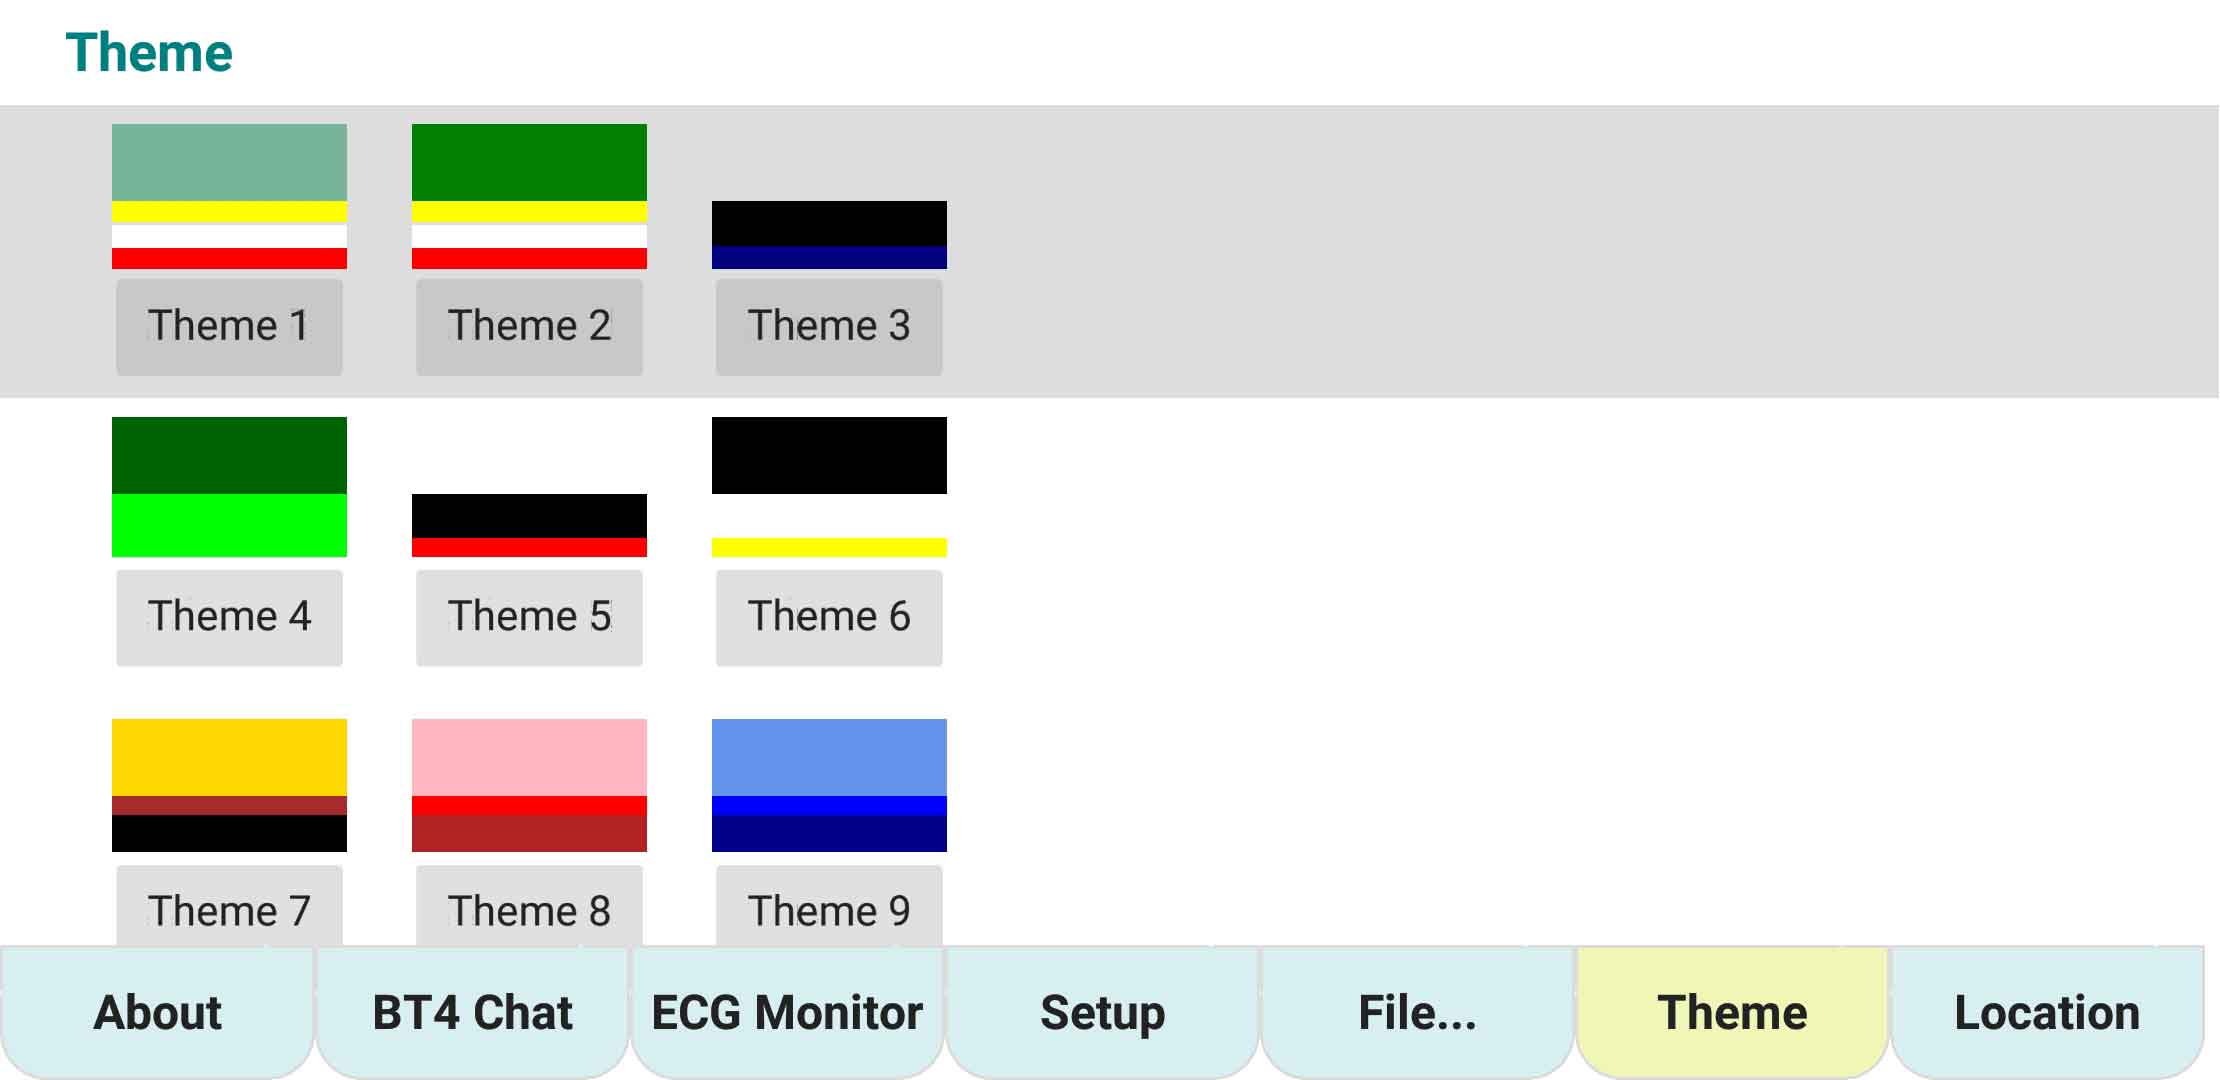
ecgMonitor – ‘Theme’ page – Theme Color Selection
ecgMonitor – ‘File…’ page
- File Manager
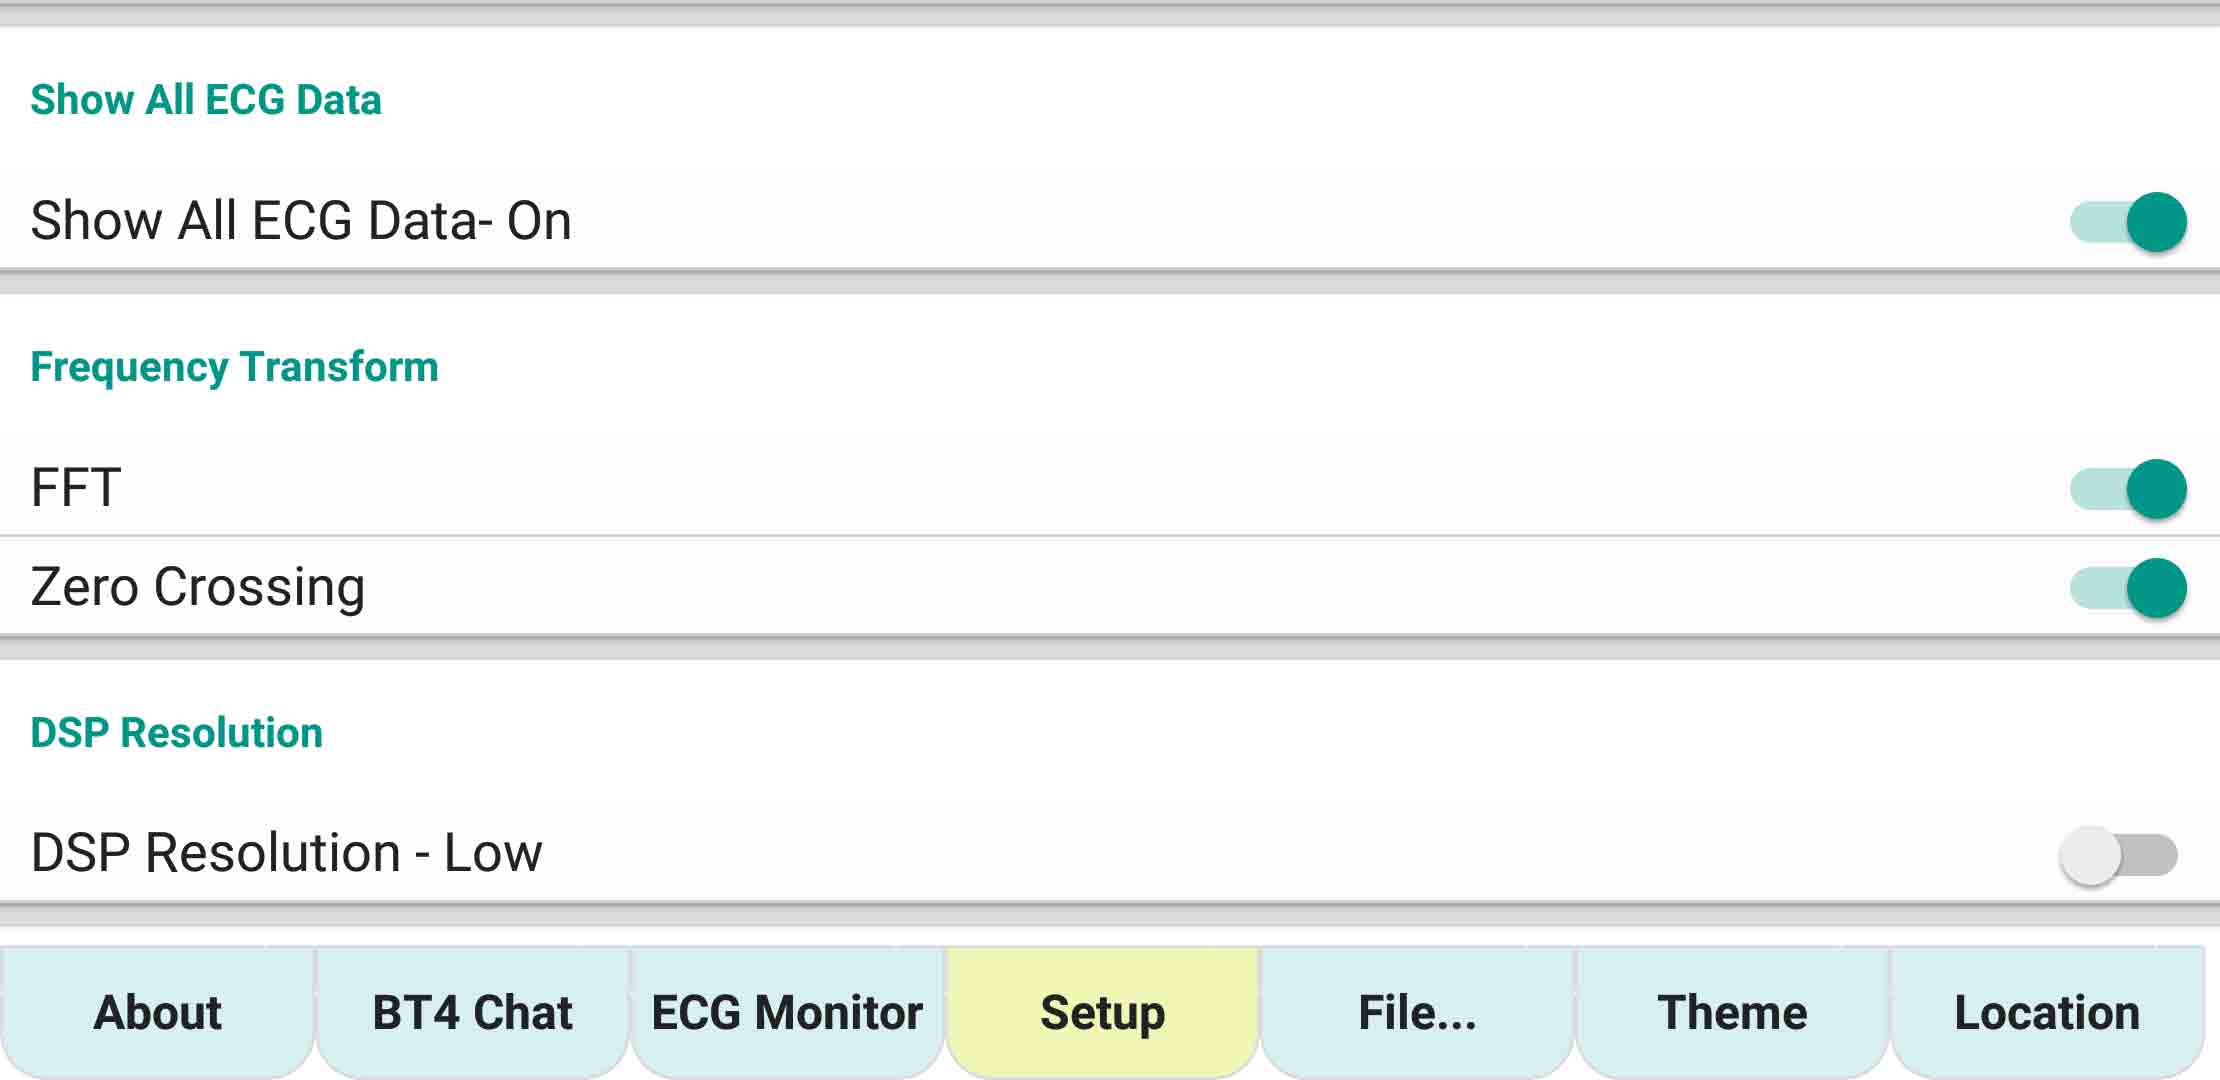
ecgMonitor – ‘Setup’ page – Frequency Transform – FFT, Zero Crossing
Frequency Transform – FFT, Zero Crossing
DSP Resolution
DTW Original Data
BPM Digit
ecgMonitor – ‘Setup’ page – Capture Data & Abnormal ECG
Limited Capture Data
Abnormal ECG – Auto Capture, Capture Abnormal ECG, DTW, Amp, bpm, FDBT,SDBT
Show All ECG Data
ecgMonitor – ‘Setup’ page – Auto Dialer, SMS & eMail Setting
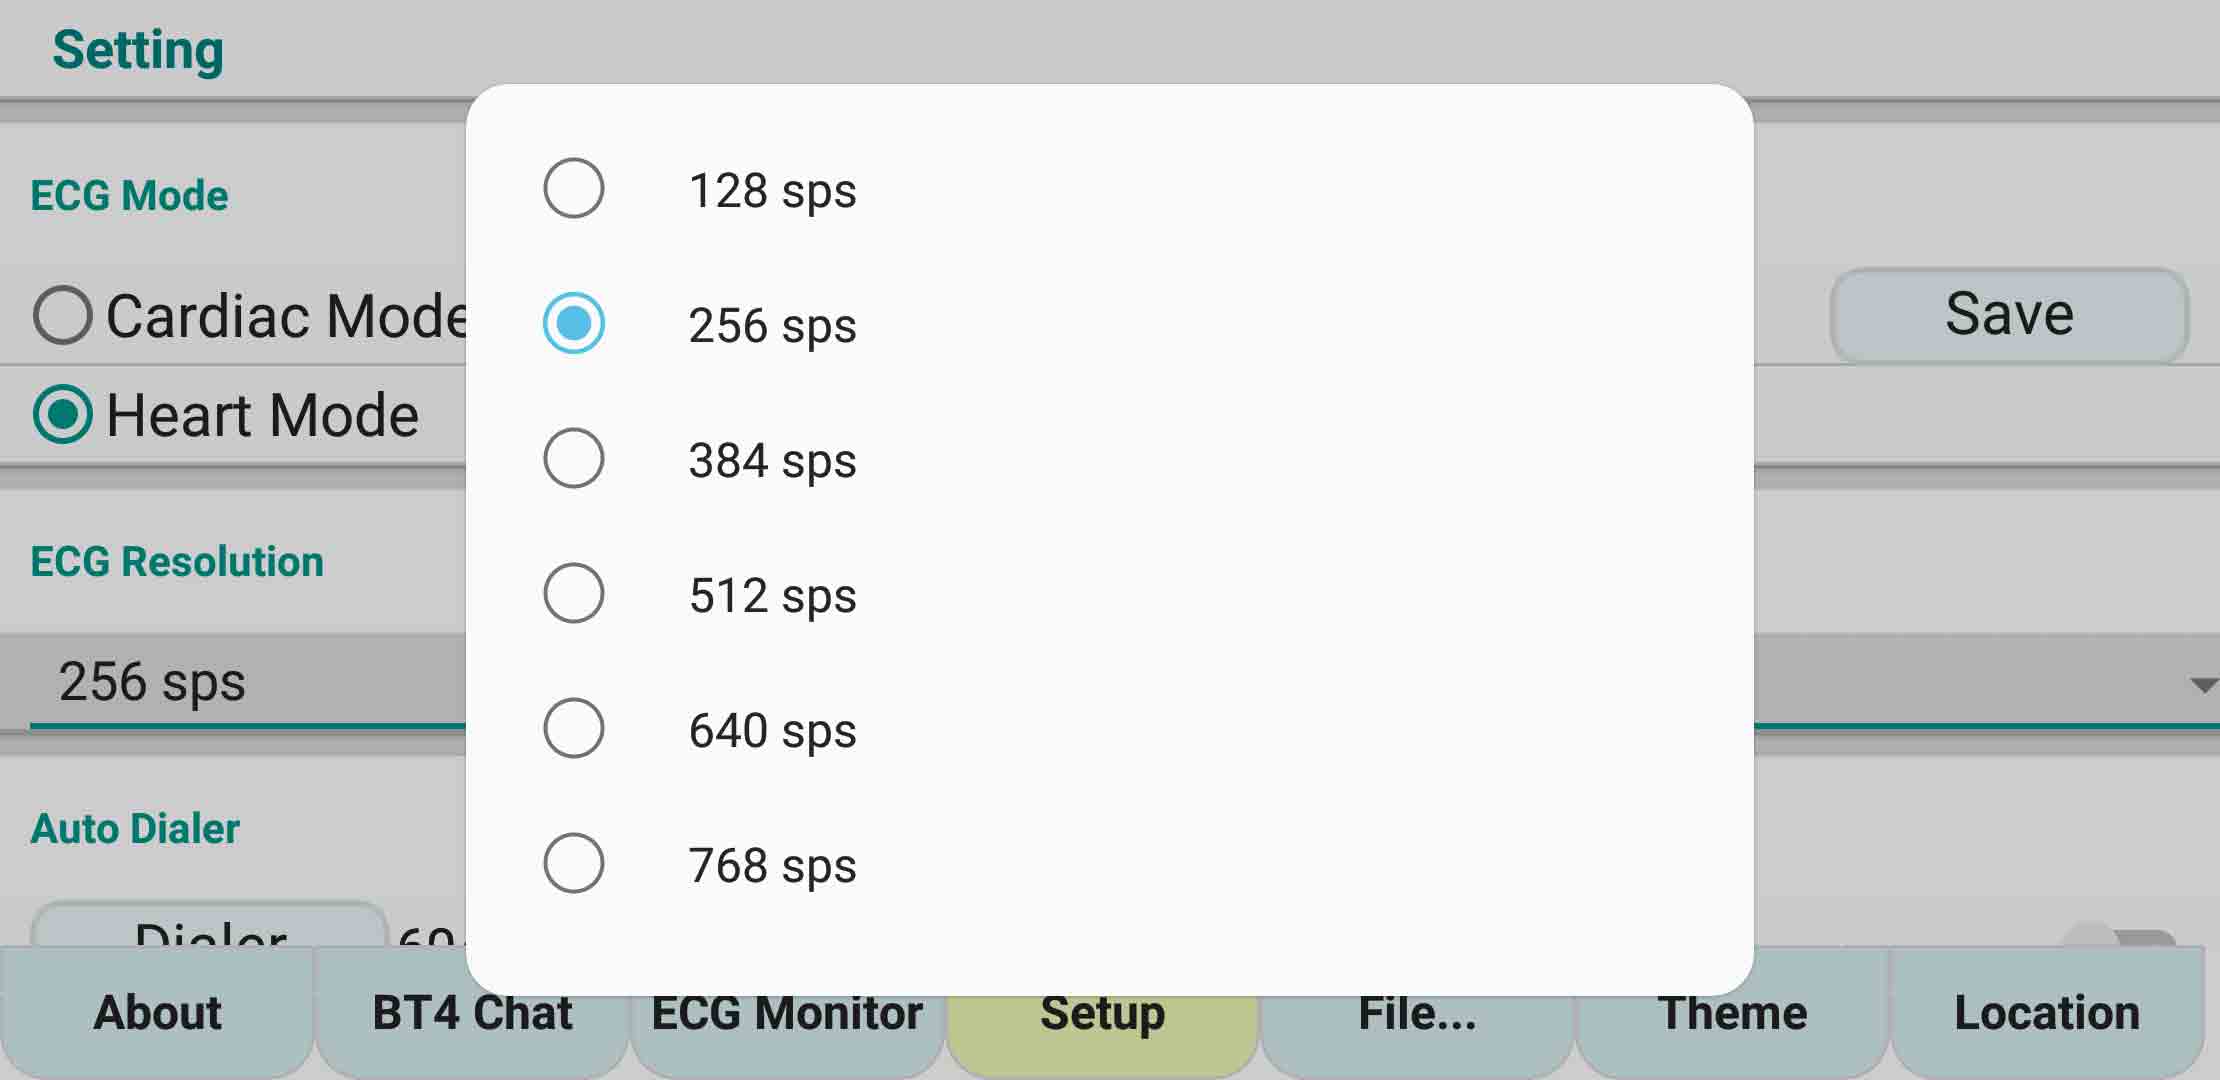
ecgMonitor – ‘ecg Monitor’ page – ECG Resolution Selection
ECG Resolution Selection- 128sps, 256sps, 384sps, 512sps, 640sps, 768sps
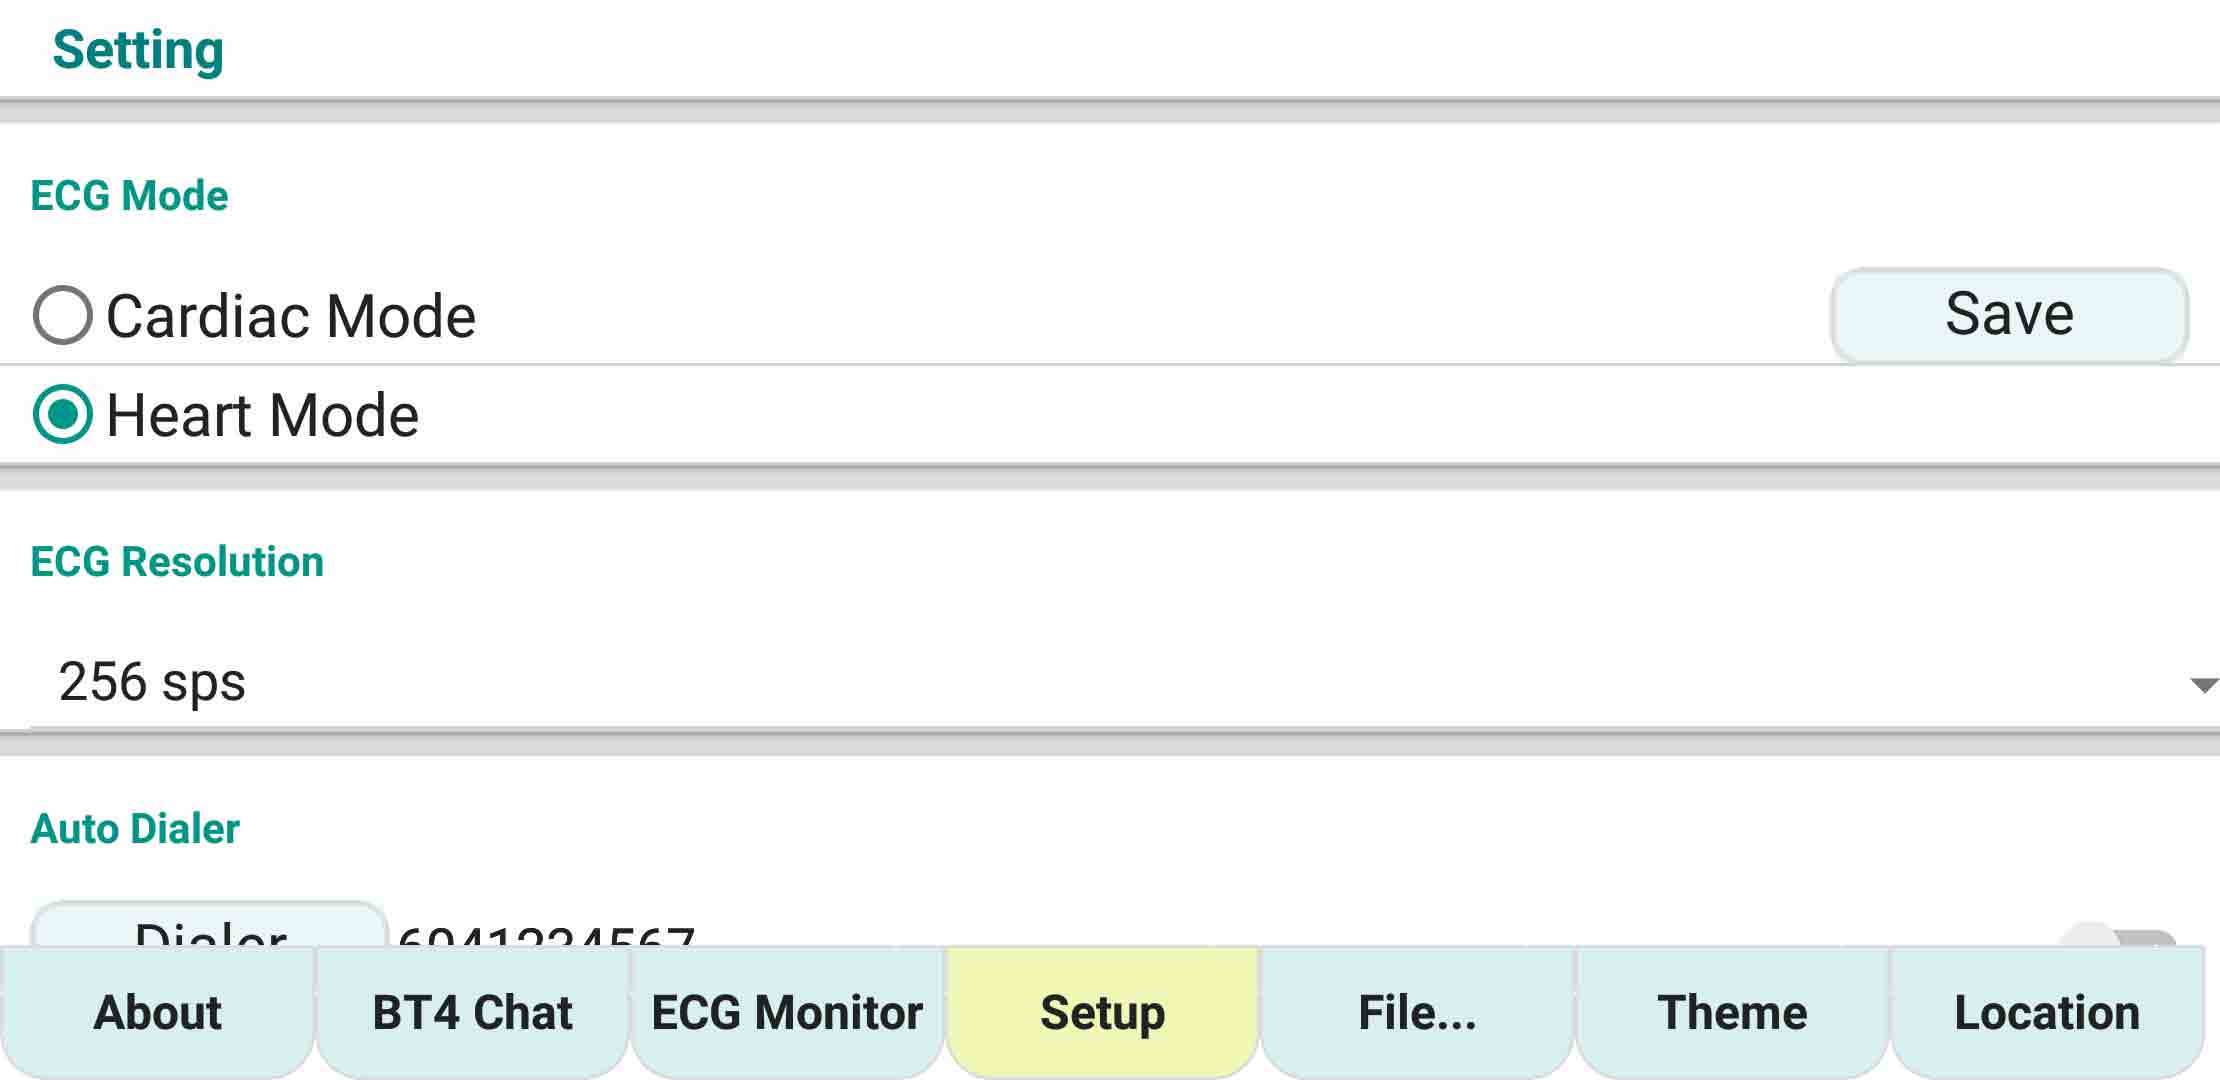
ecgMonitor – ‘Setup’ page – ECG Mode – Cardiac Mode, Heart Mode
ECG Mode – Cardiac Mode, Heart Mode
ECG Resolution Selection – 128sps, 256sps, 384sps, 512sps, 640sps, 768sps
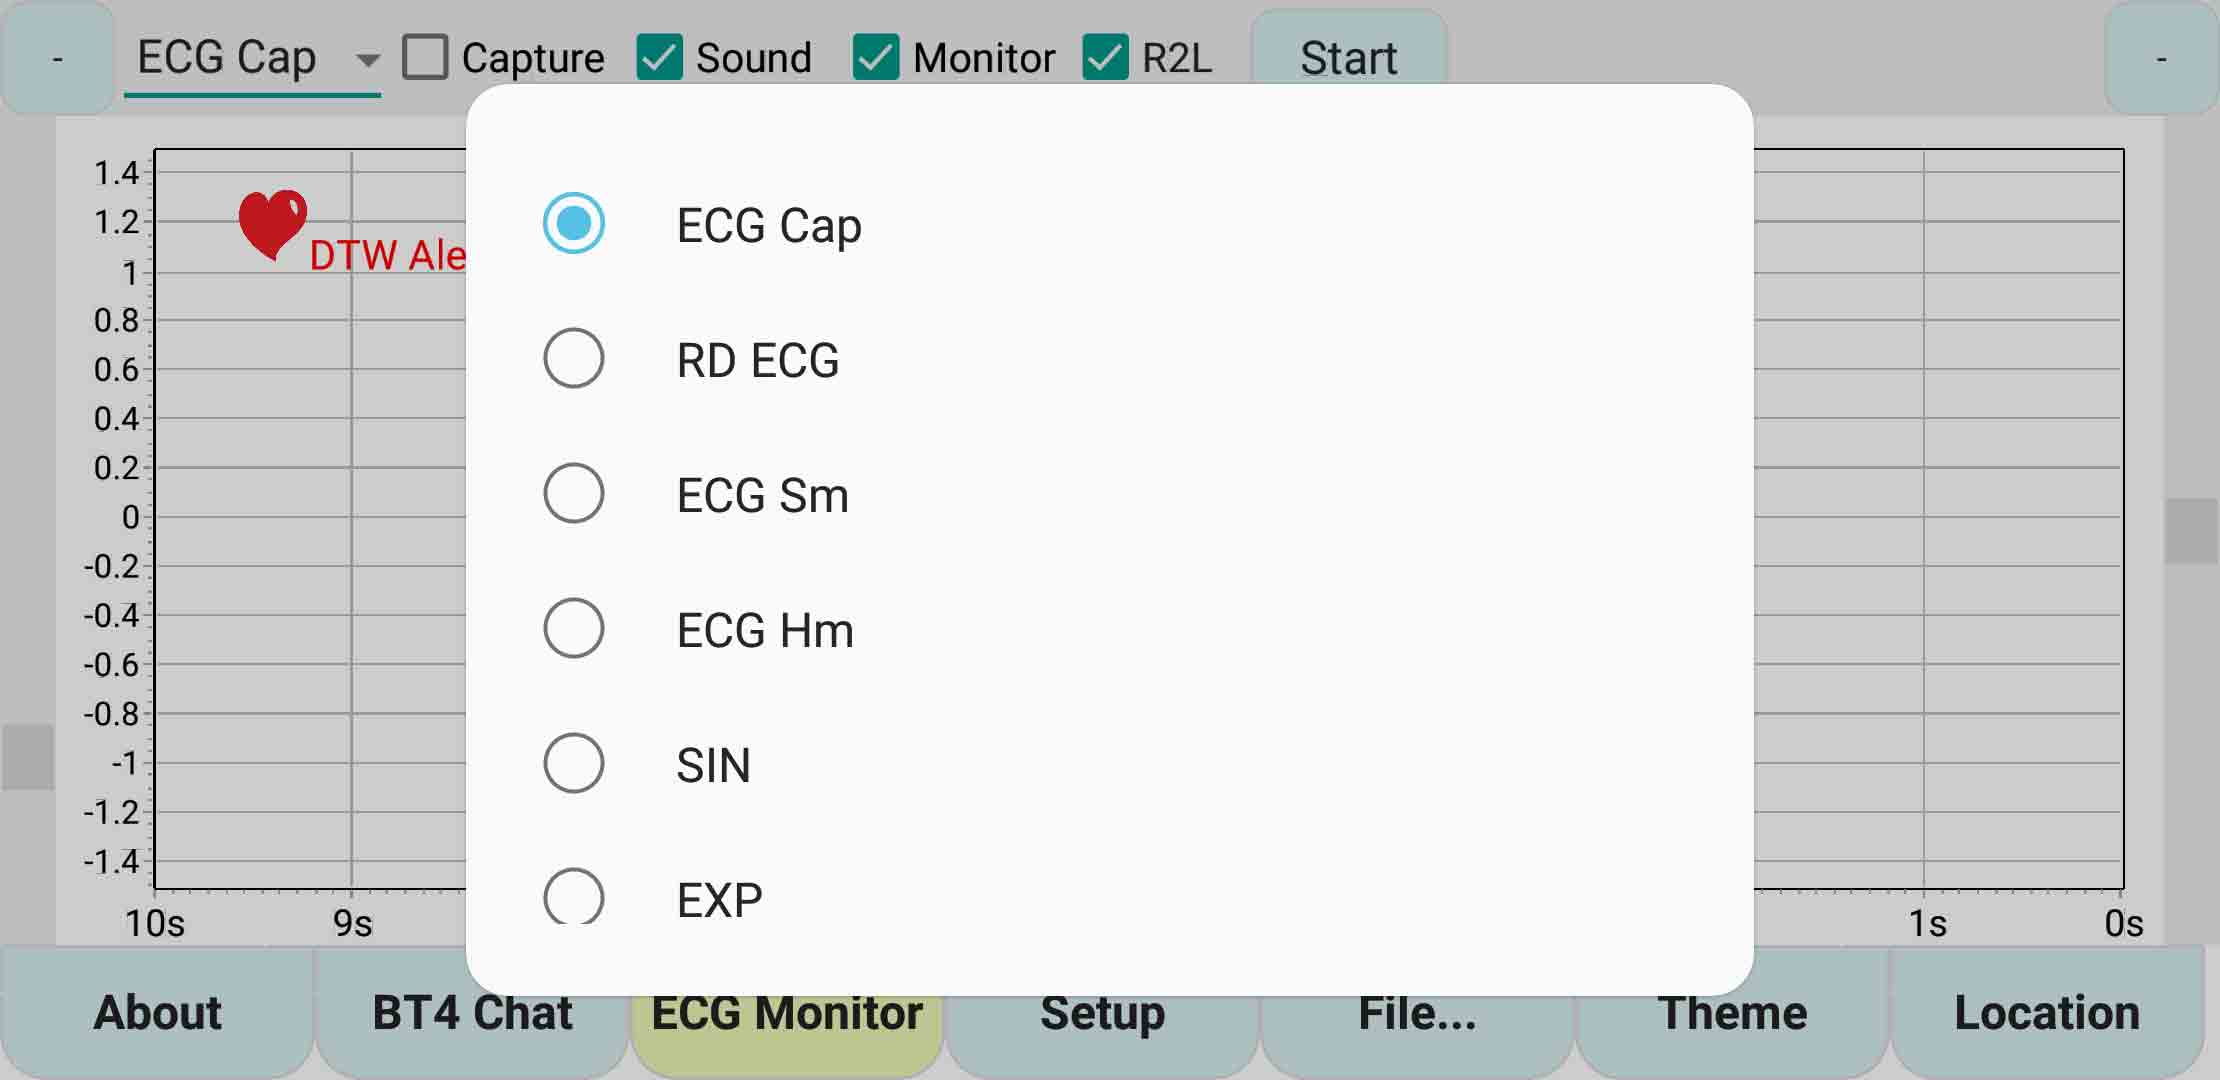
ecgMonitor – ‘Setup’ page – Capture Mode Selection
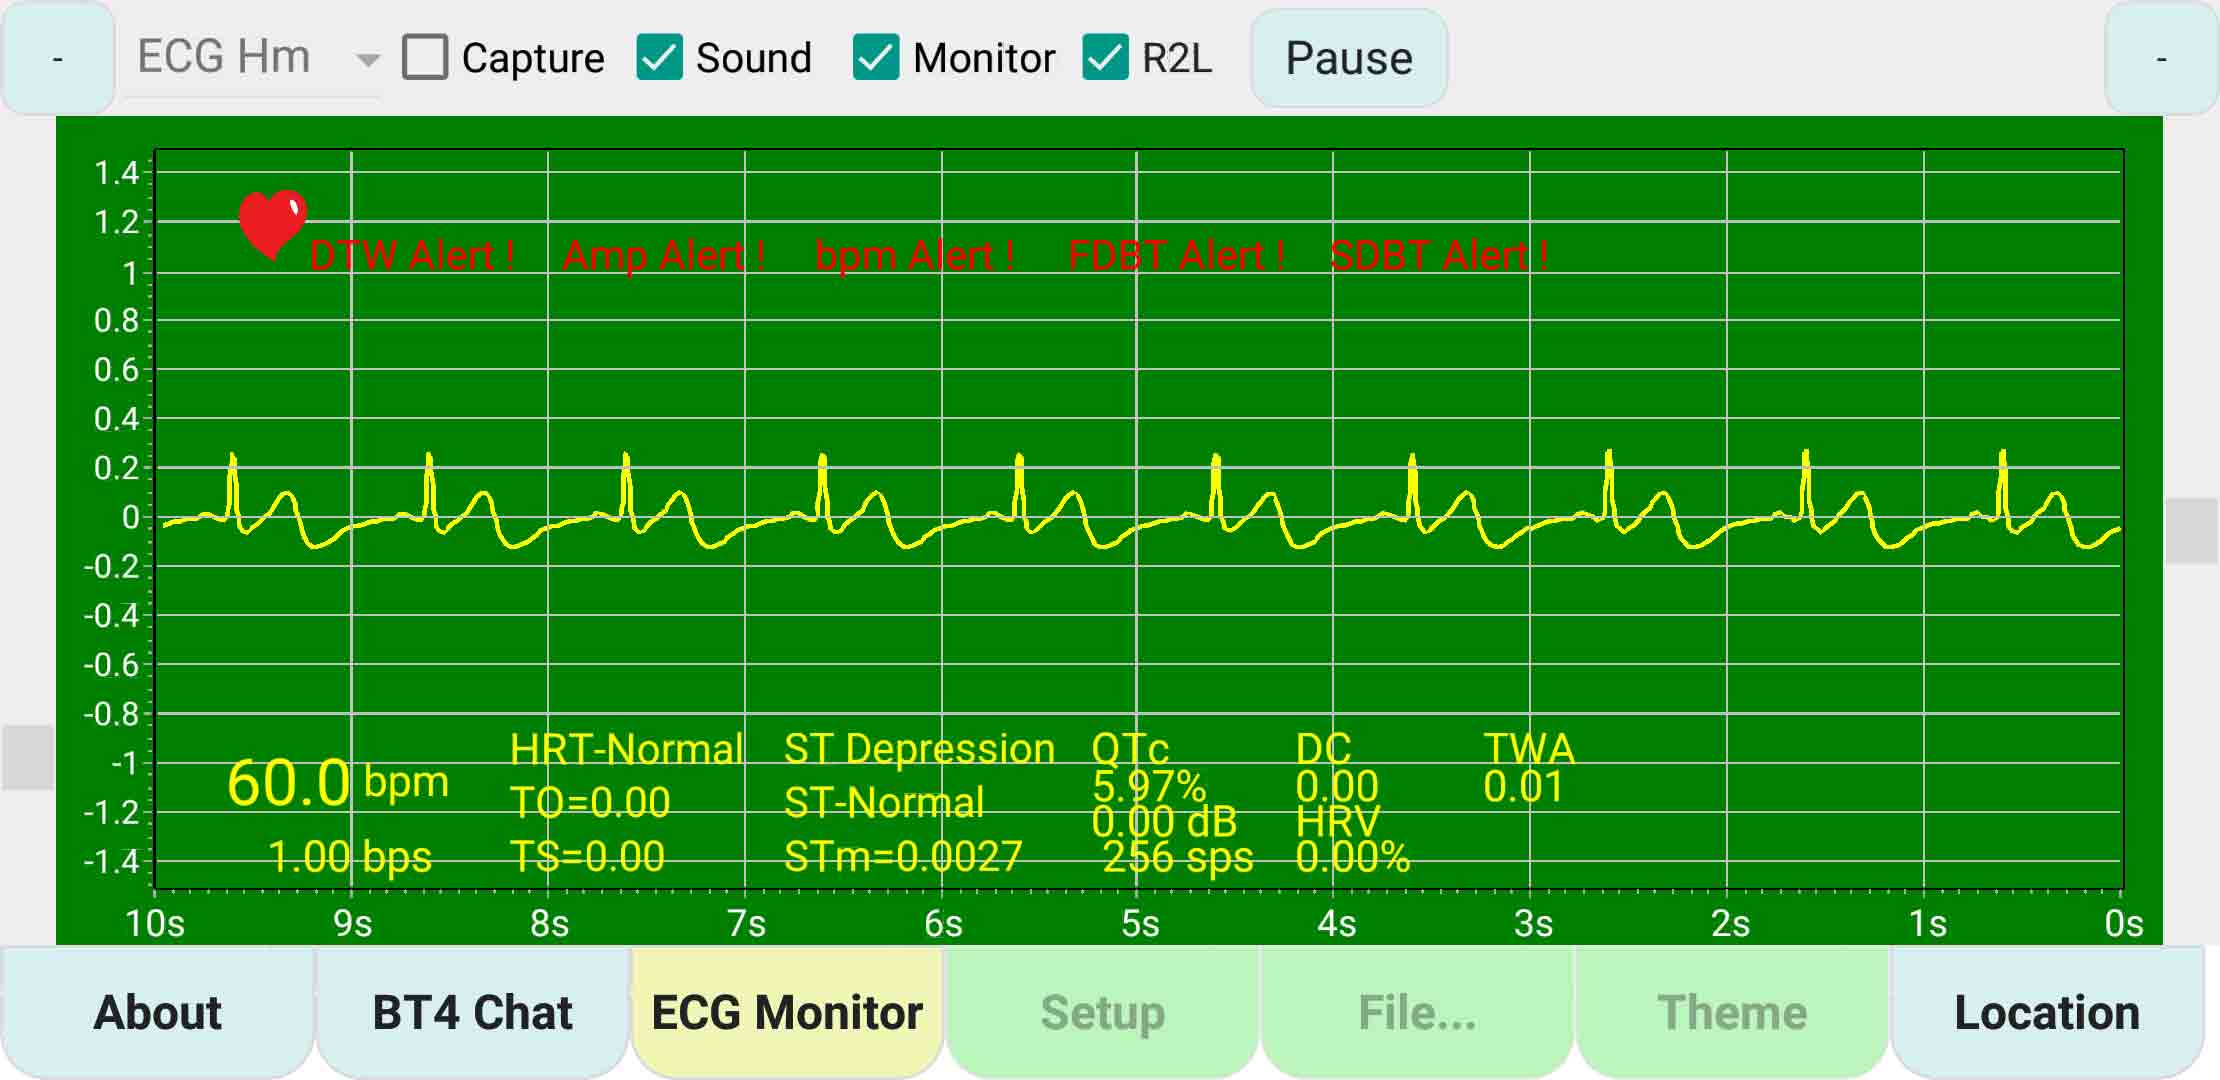
Capture Mode Selection- ECG Cap, RD ECG, ECG Sm, ECG Hm, SIN, EXP
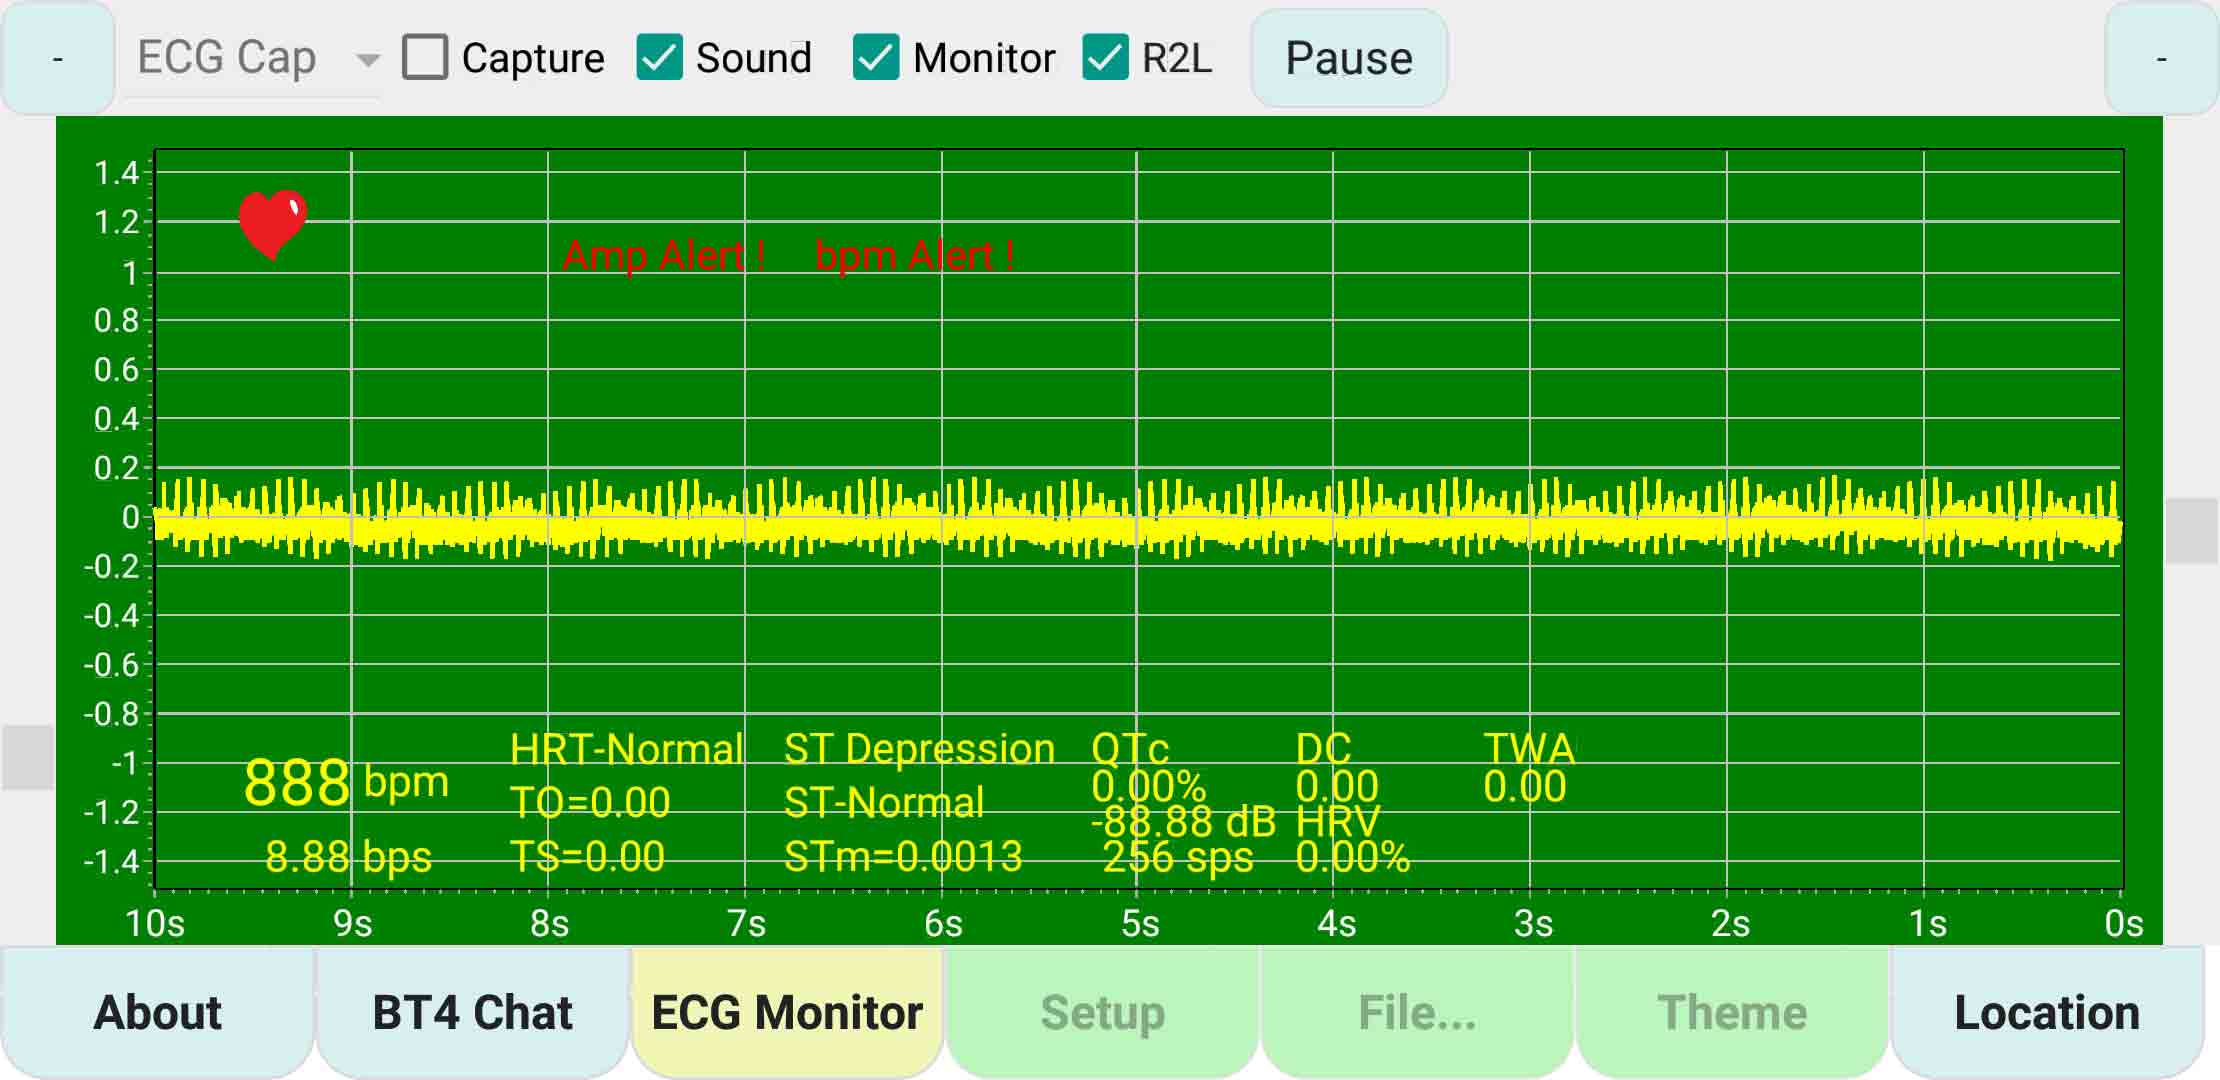
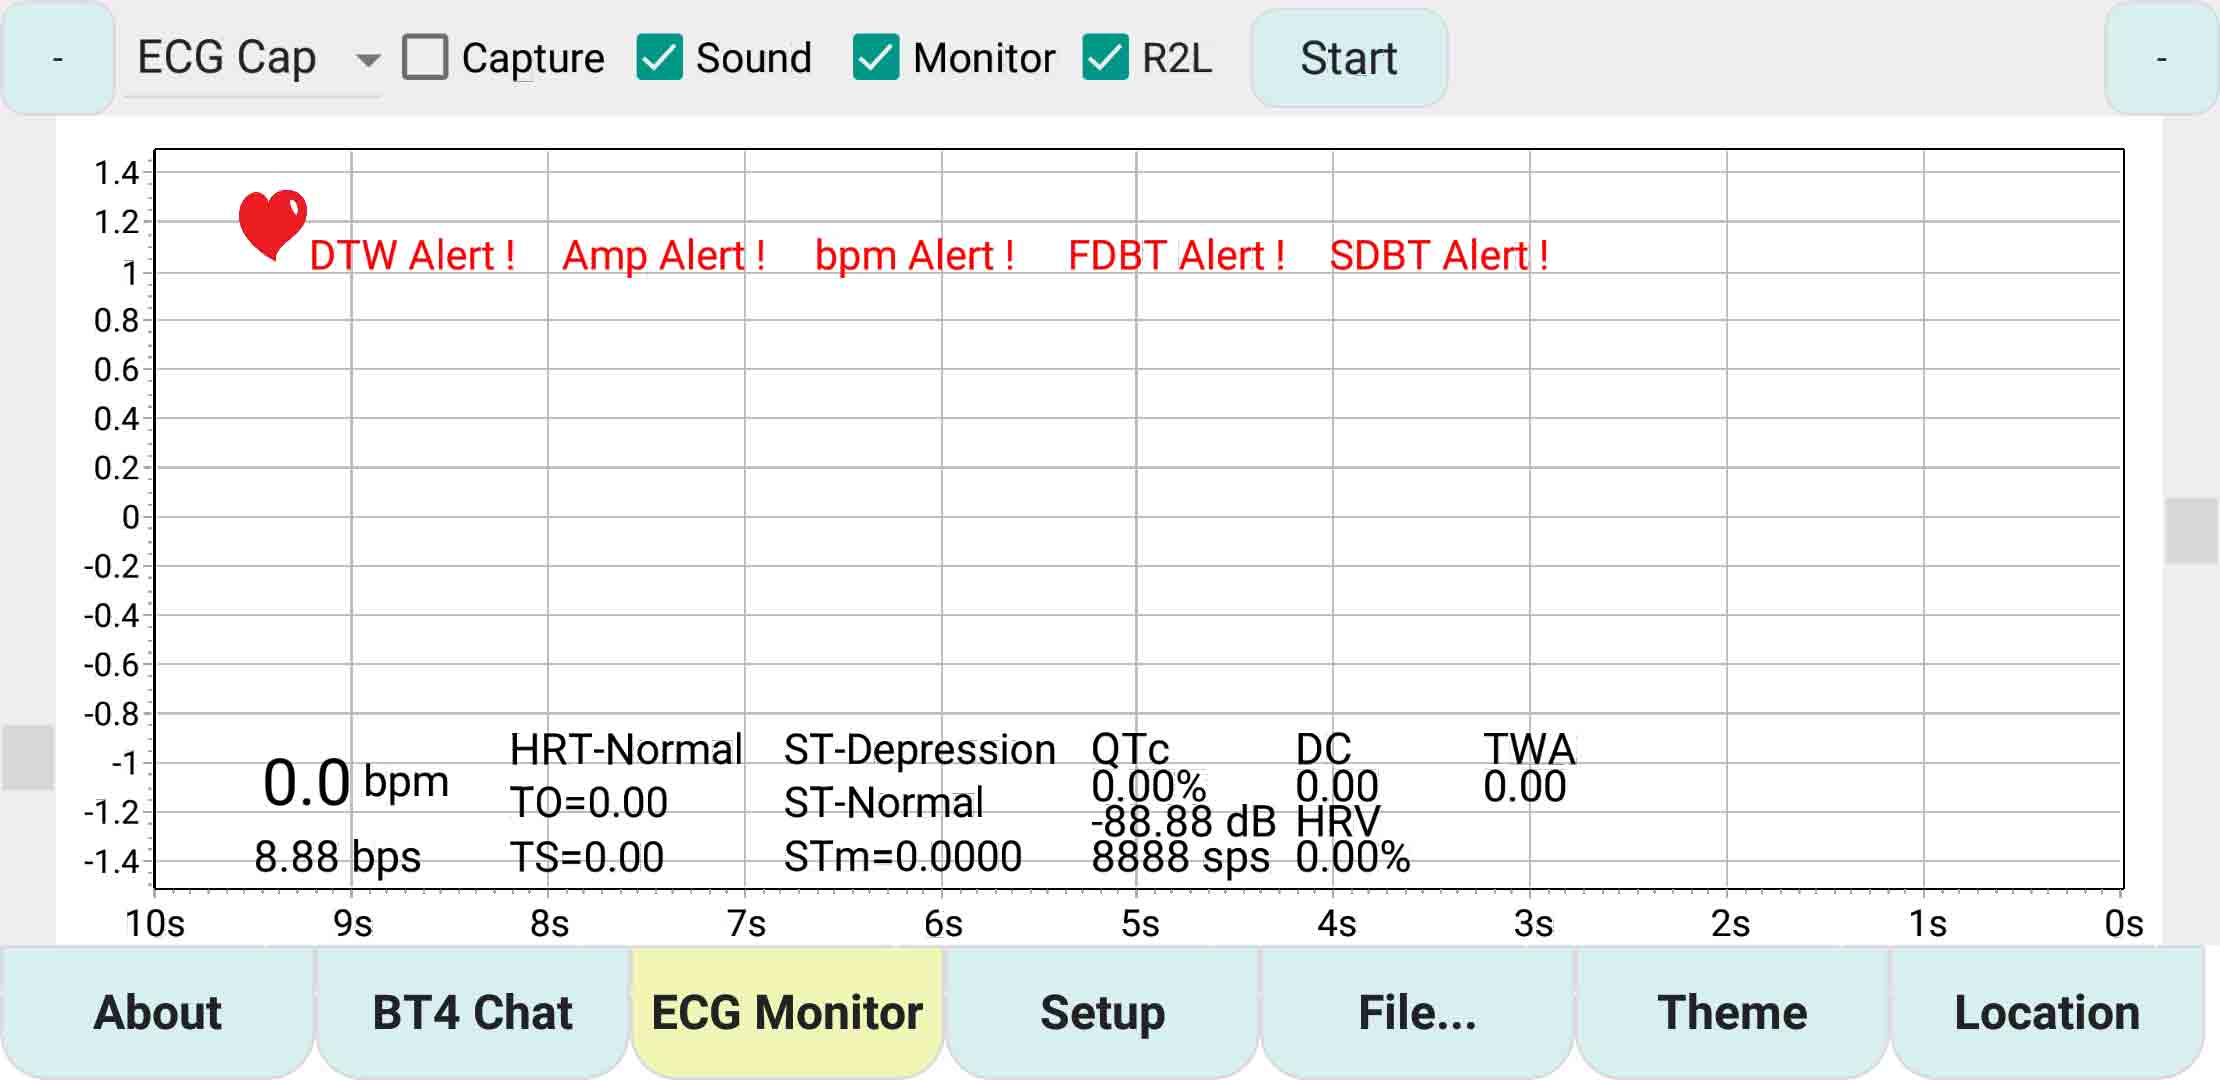
ecgMonitor – ‘ecg Monitor’ page
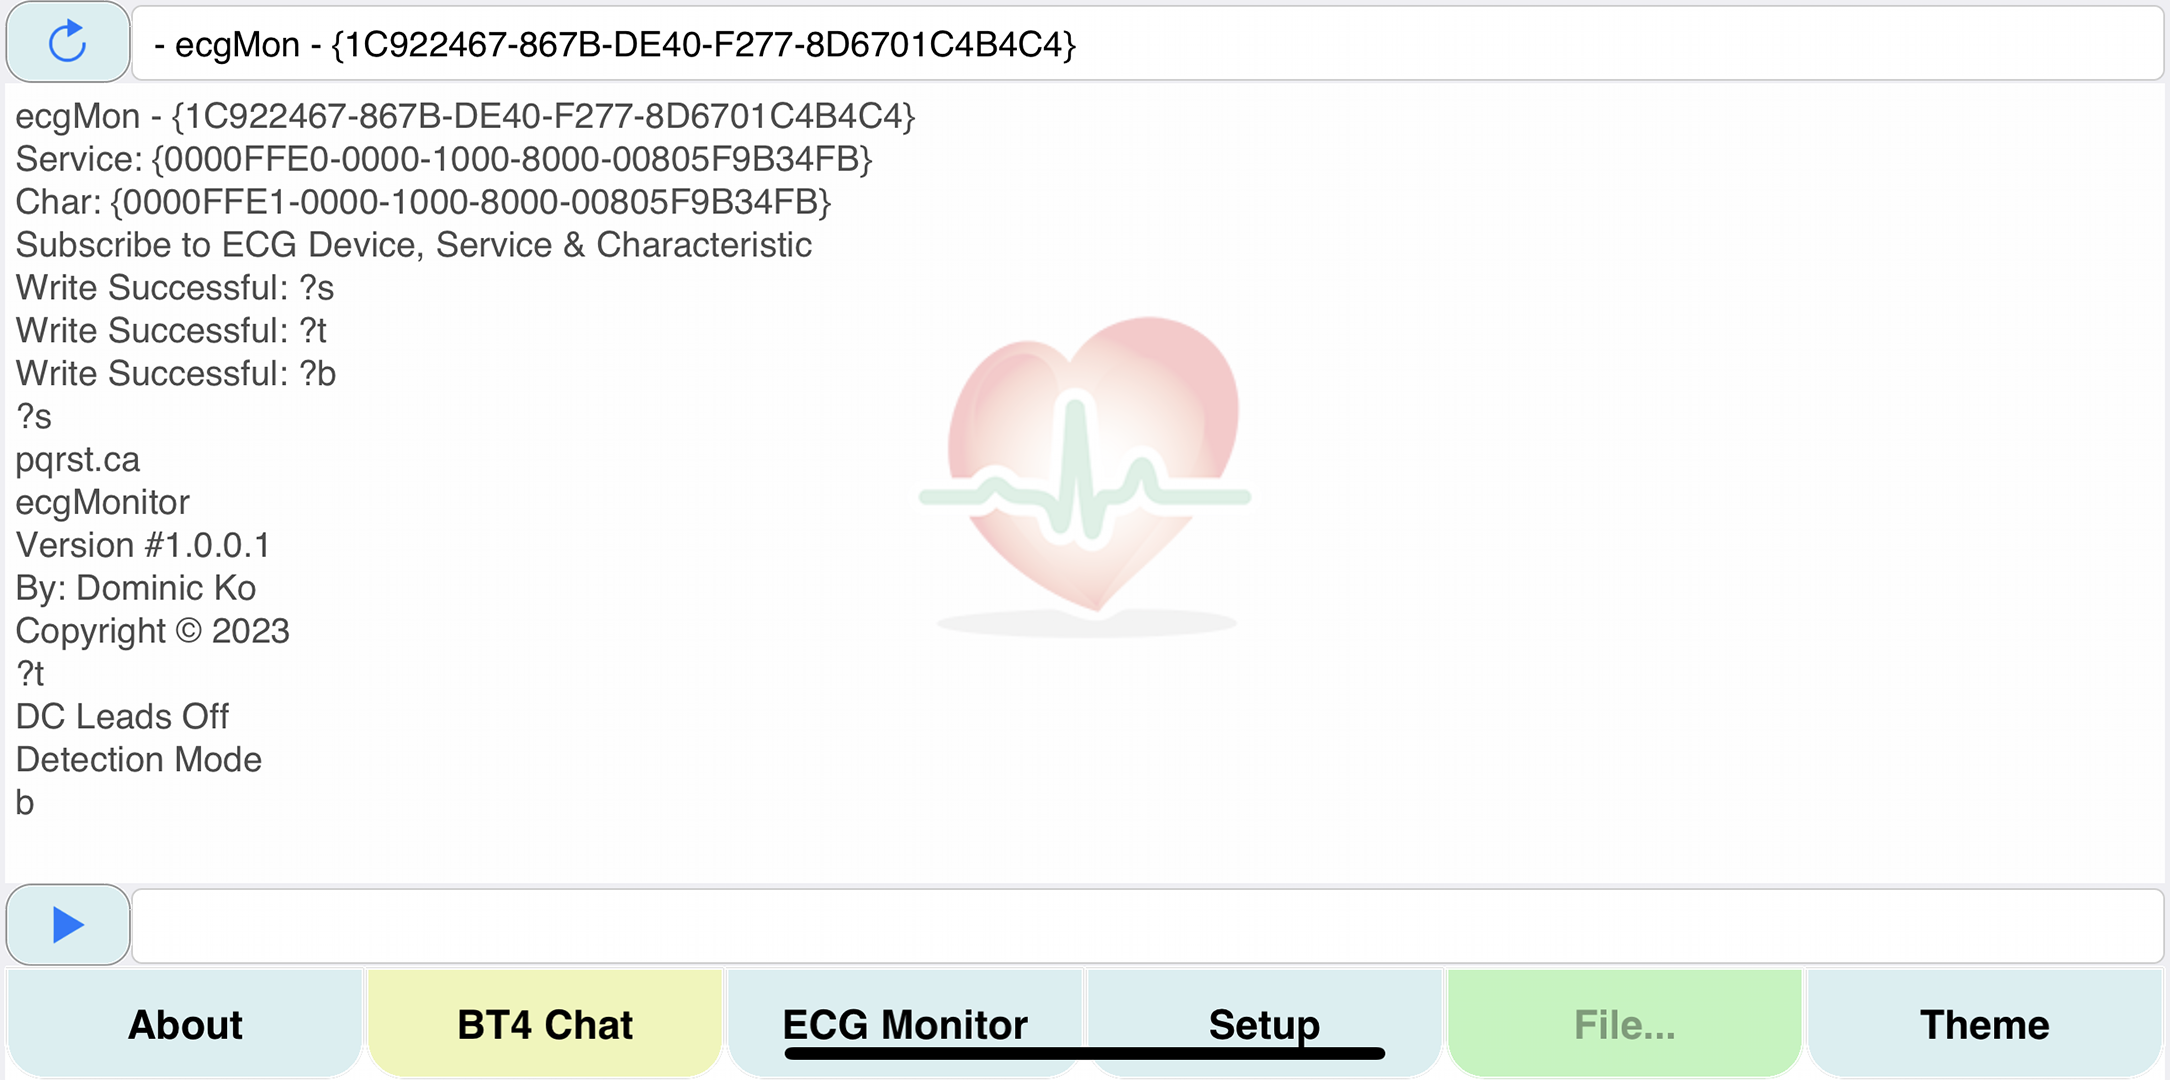
ecgMonitor – ‘BT4 Chat’ page – logon
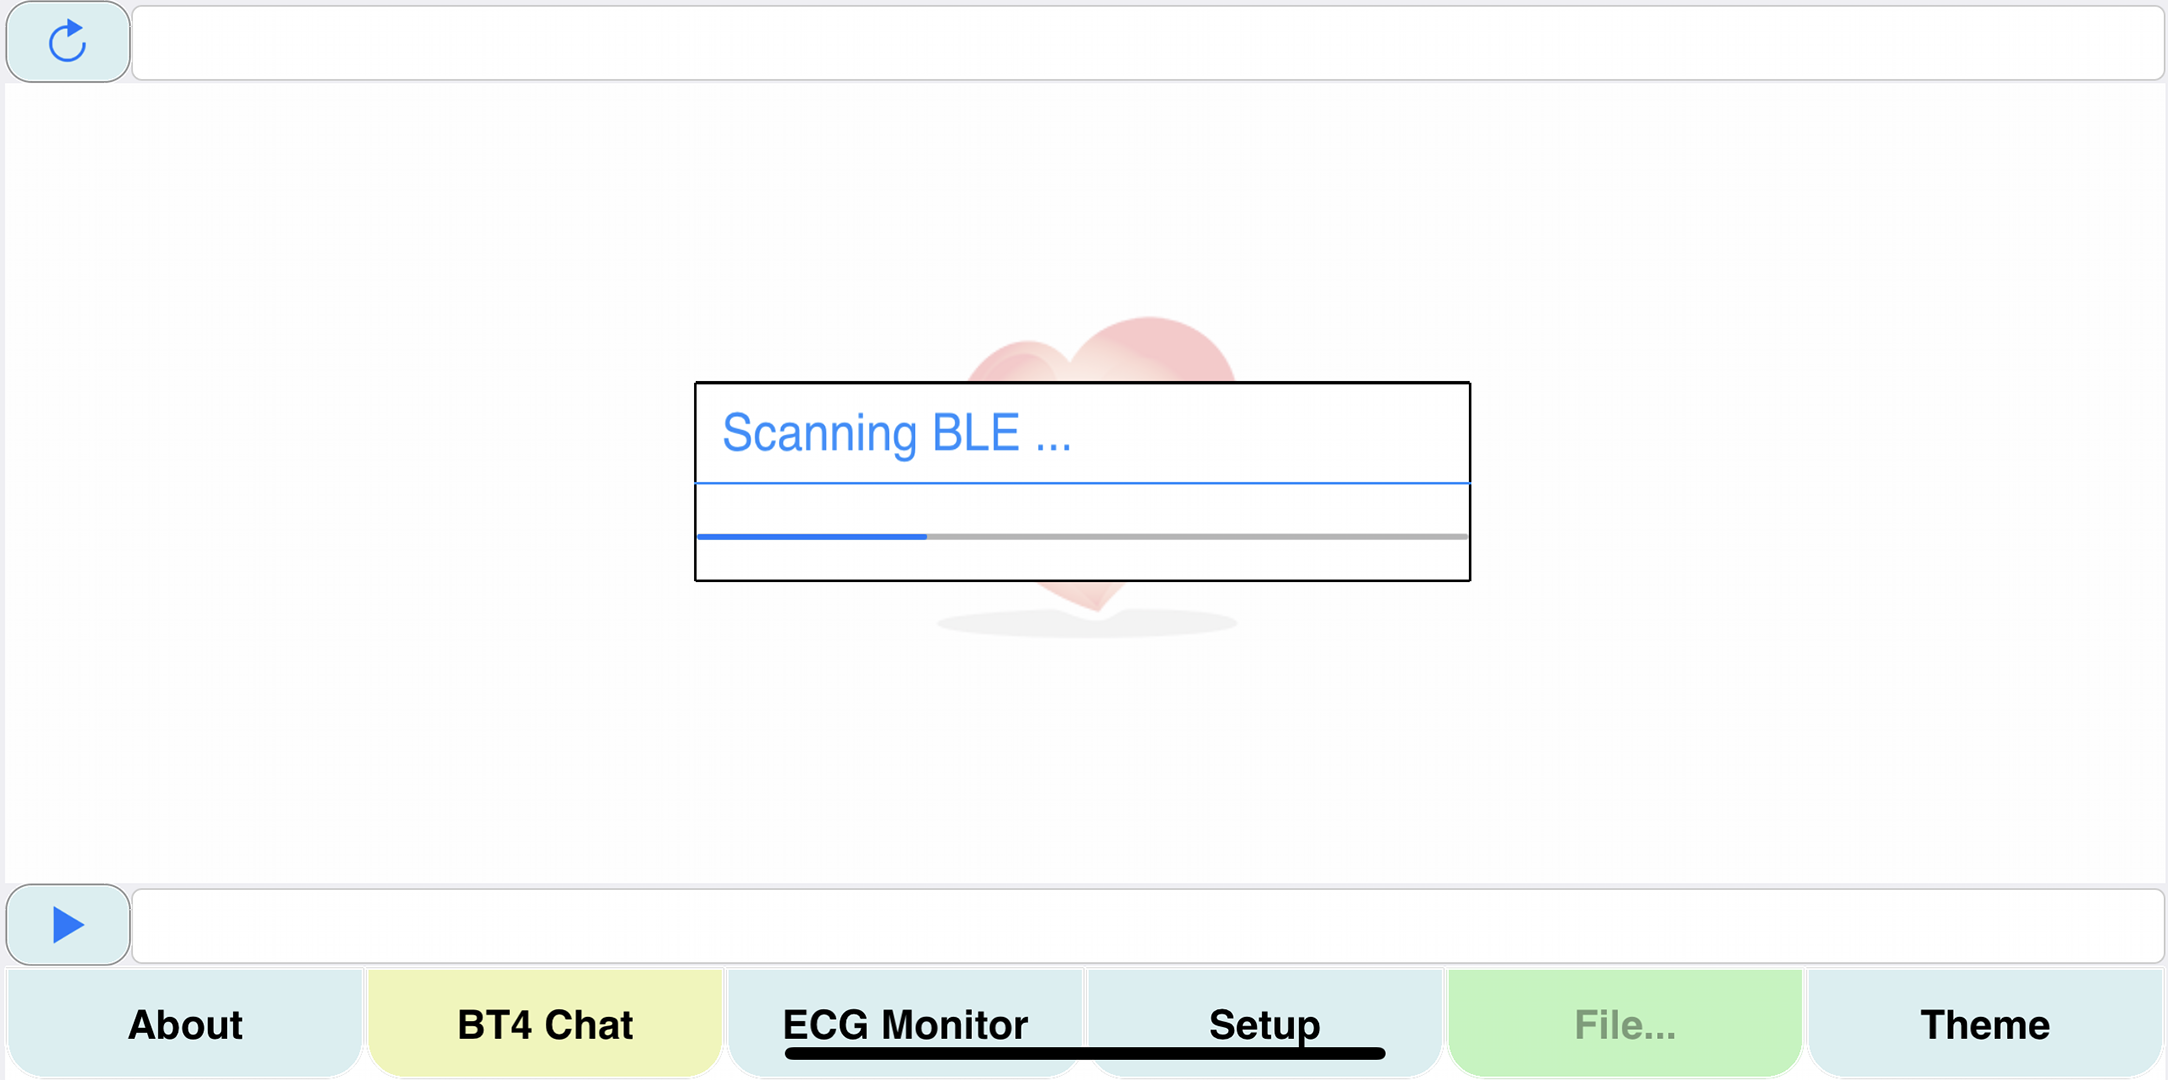
ecgMonitor – ‘BT4 Chat’ page – Scanning BLE
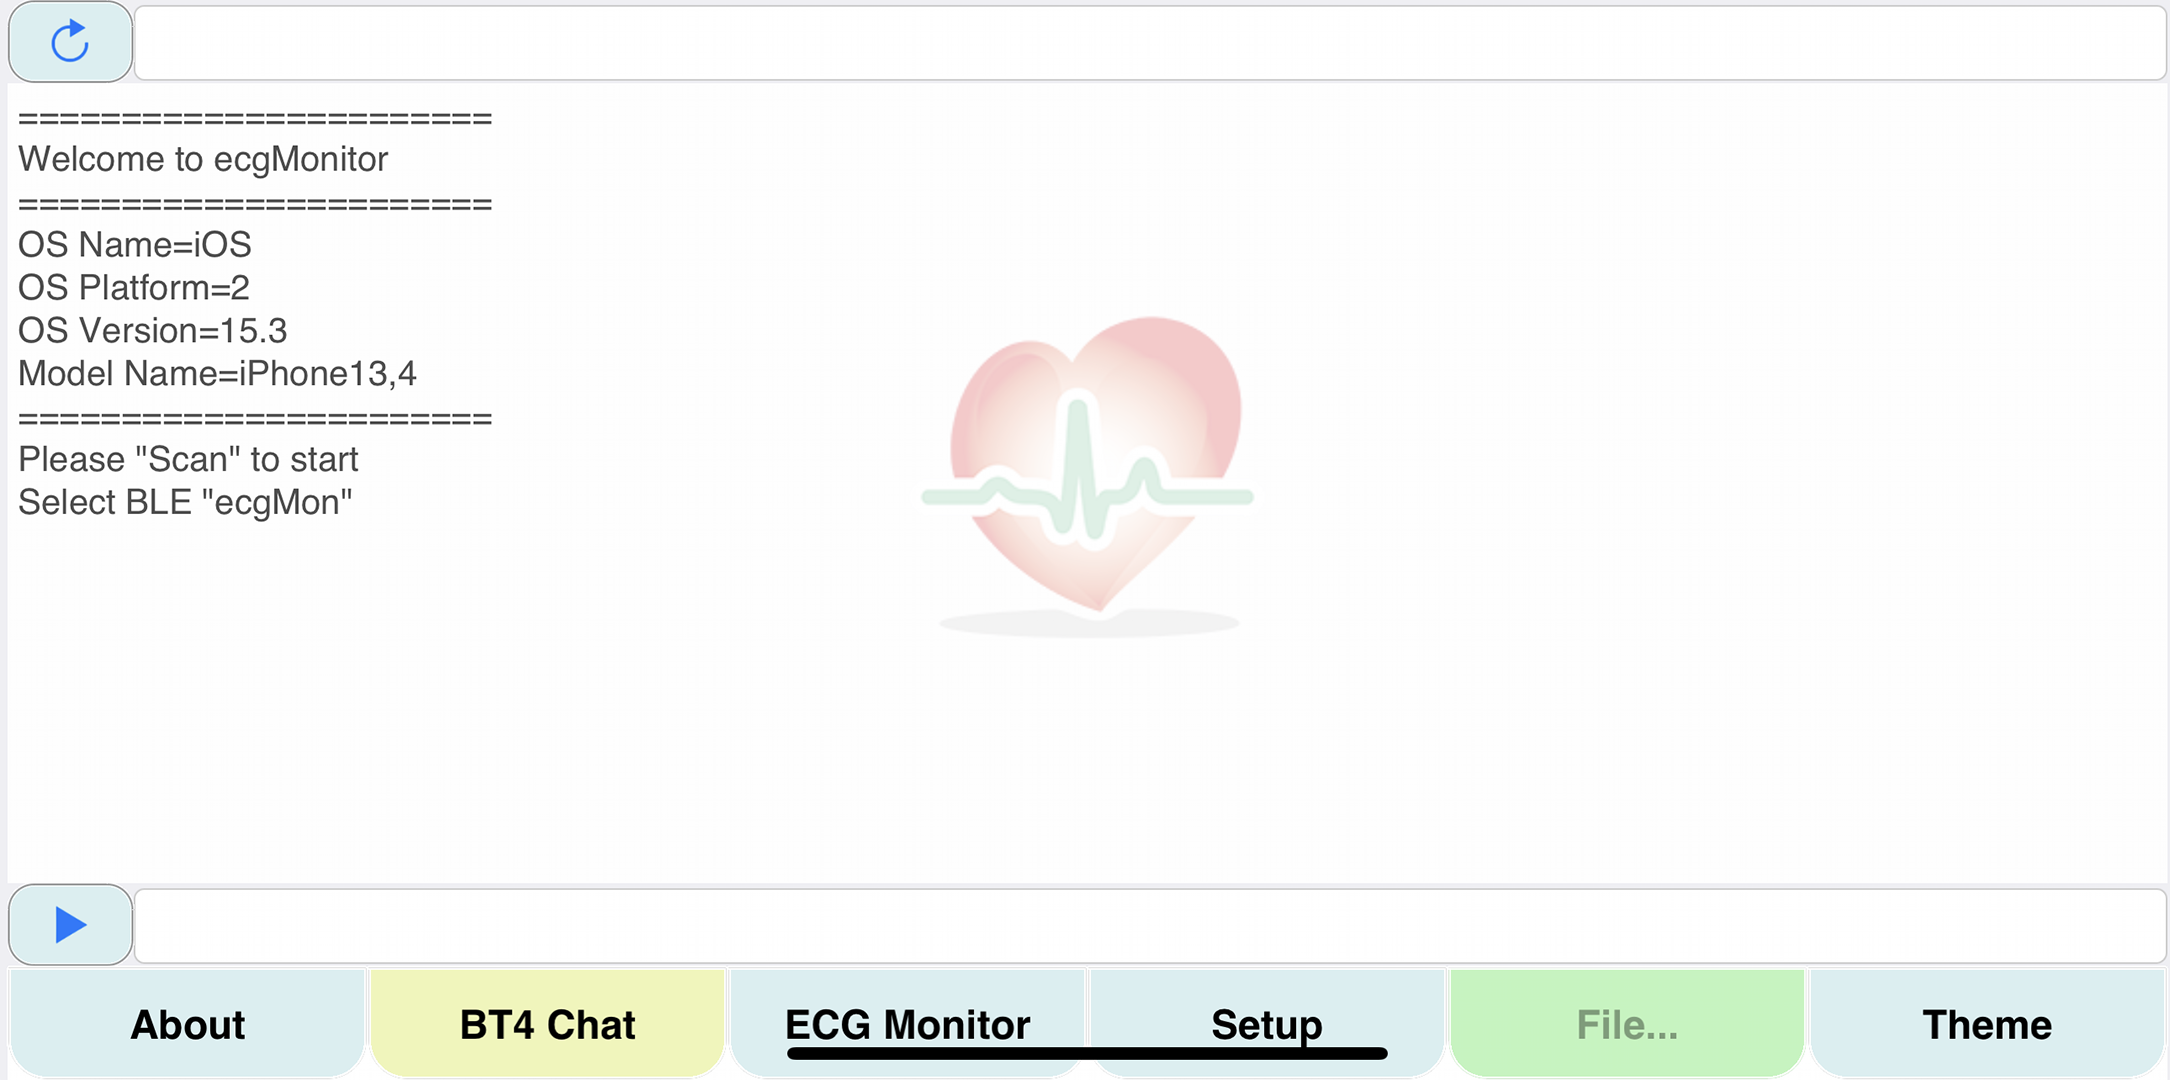
ecgMonitor – ‘BT4 Chat’ page – Welcome
ecgMonitor – ‘About’ page
Software Development
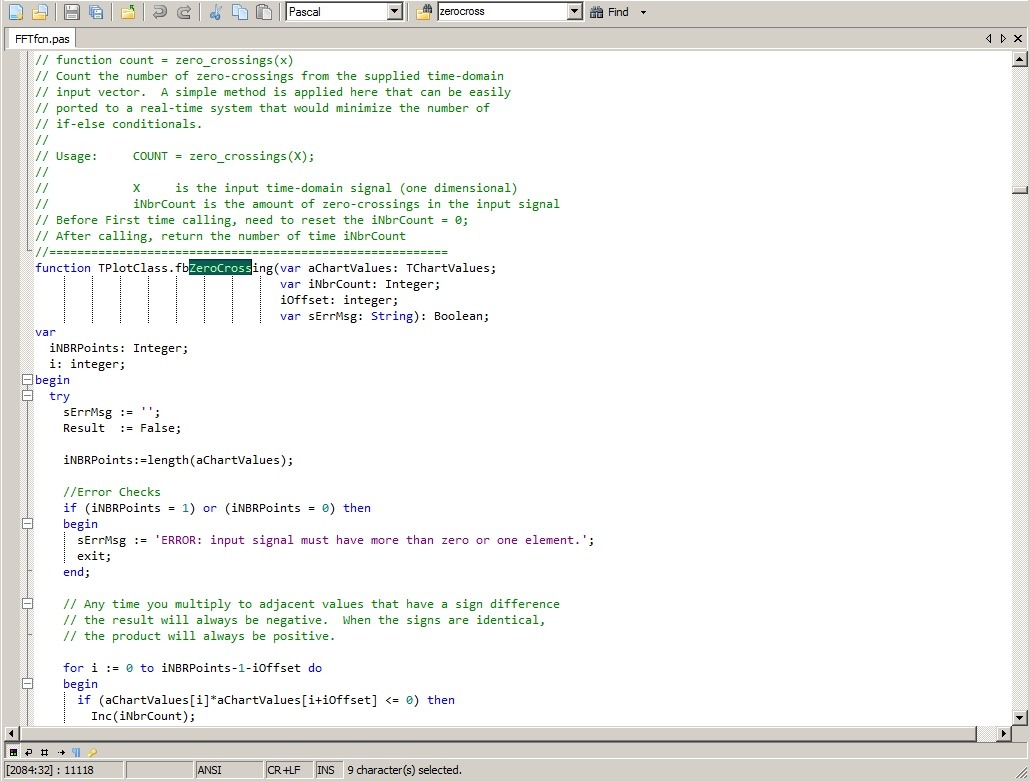
Software Development – Zero Crossing
– fbZeroCrossing is used to calculate the time interval between each pulse
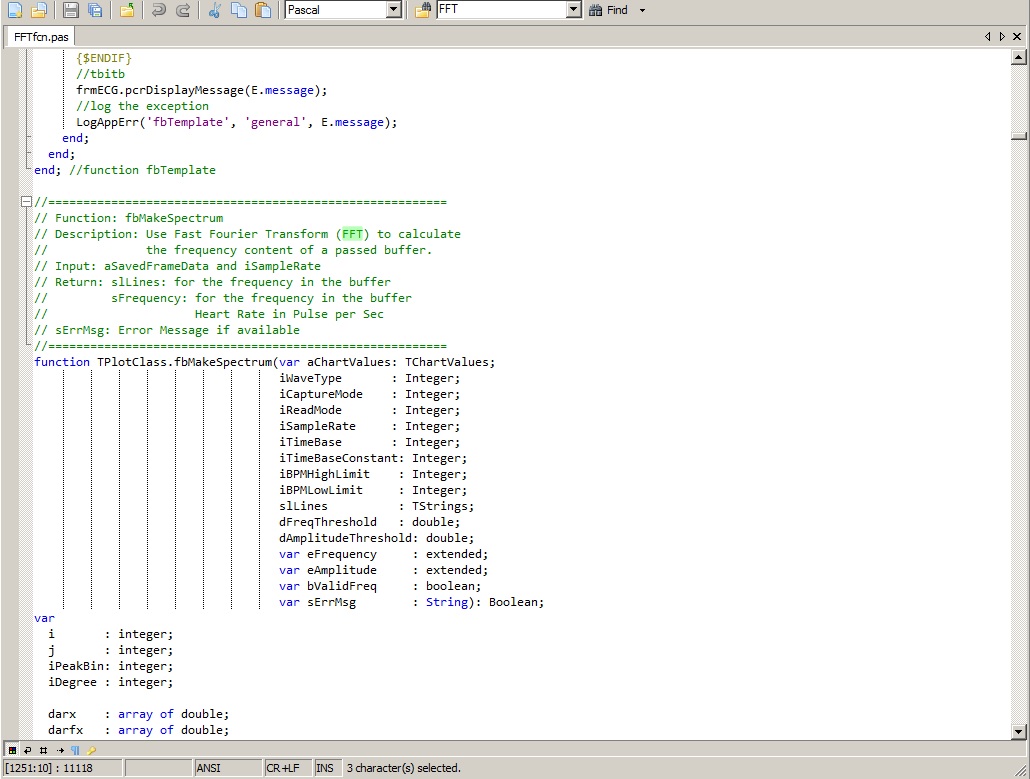
Software Development – Fast Fourier Transformation
– fbMakeSpectrum for Fast Fourier Transformation to calculation of pulse interval.
August 2015
Software Design
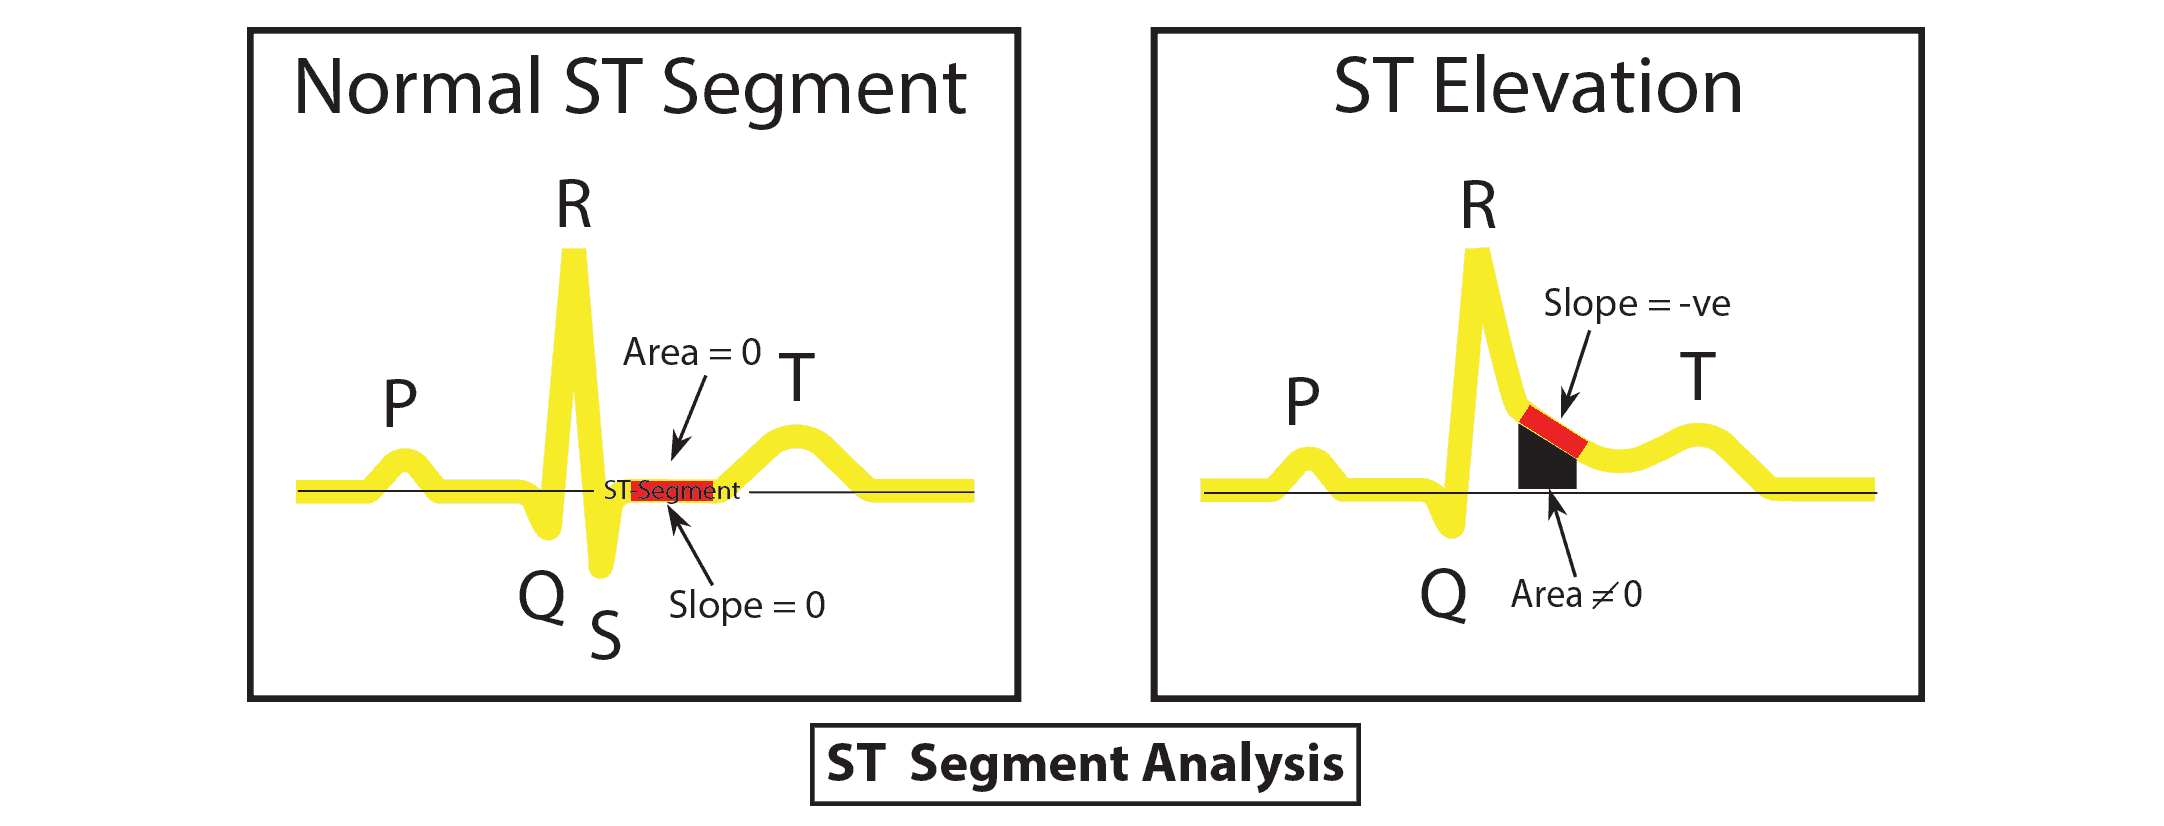
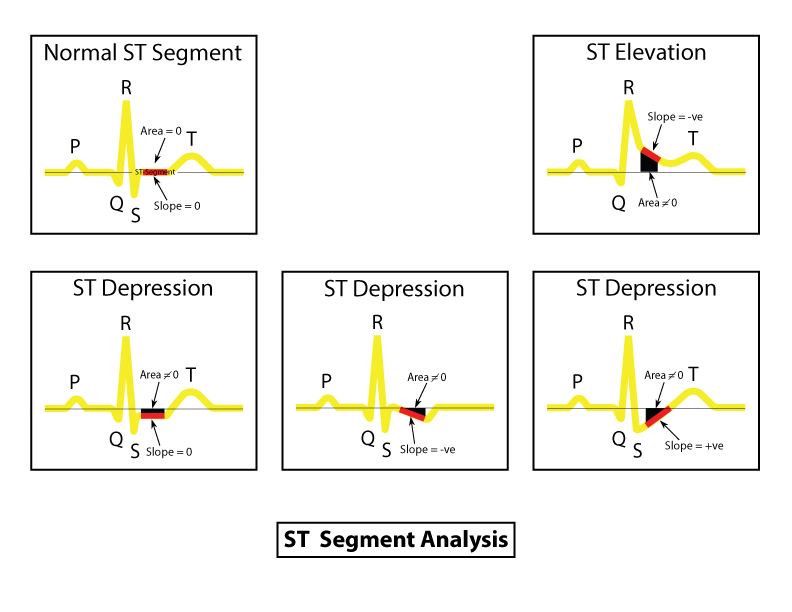
ST – Segment Analysis
– Normal ST Segment
– ST Elevation
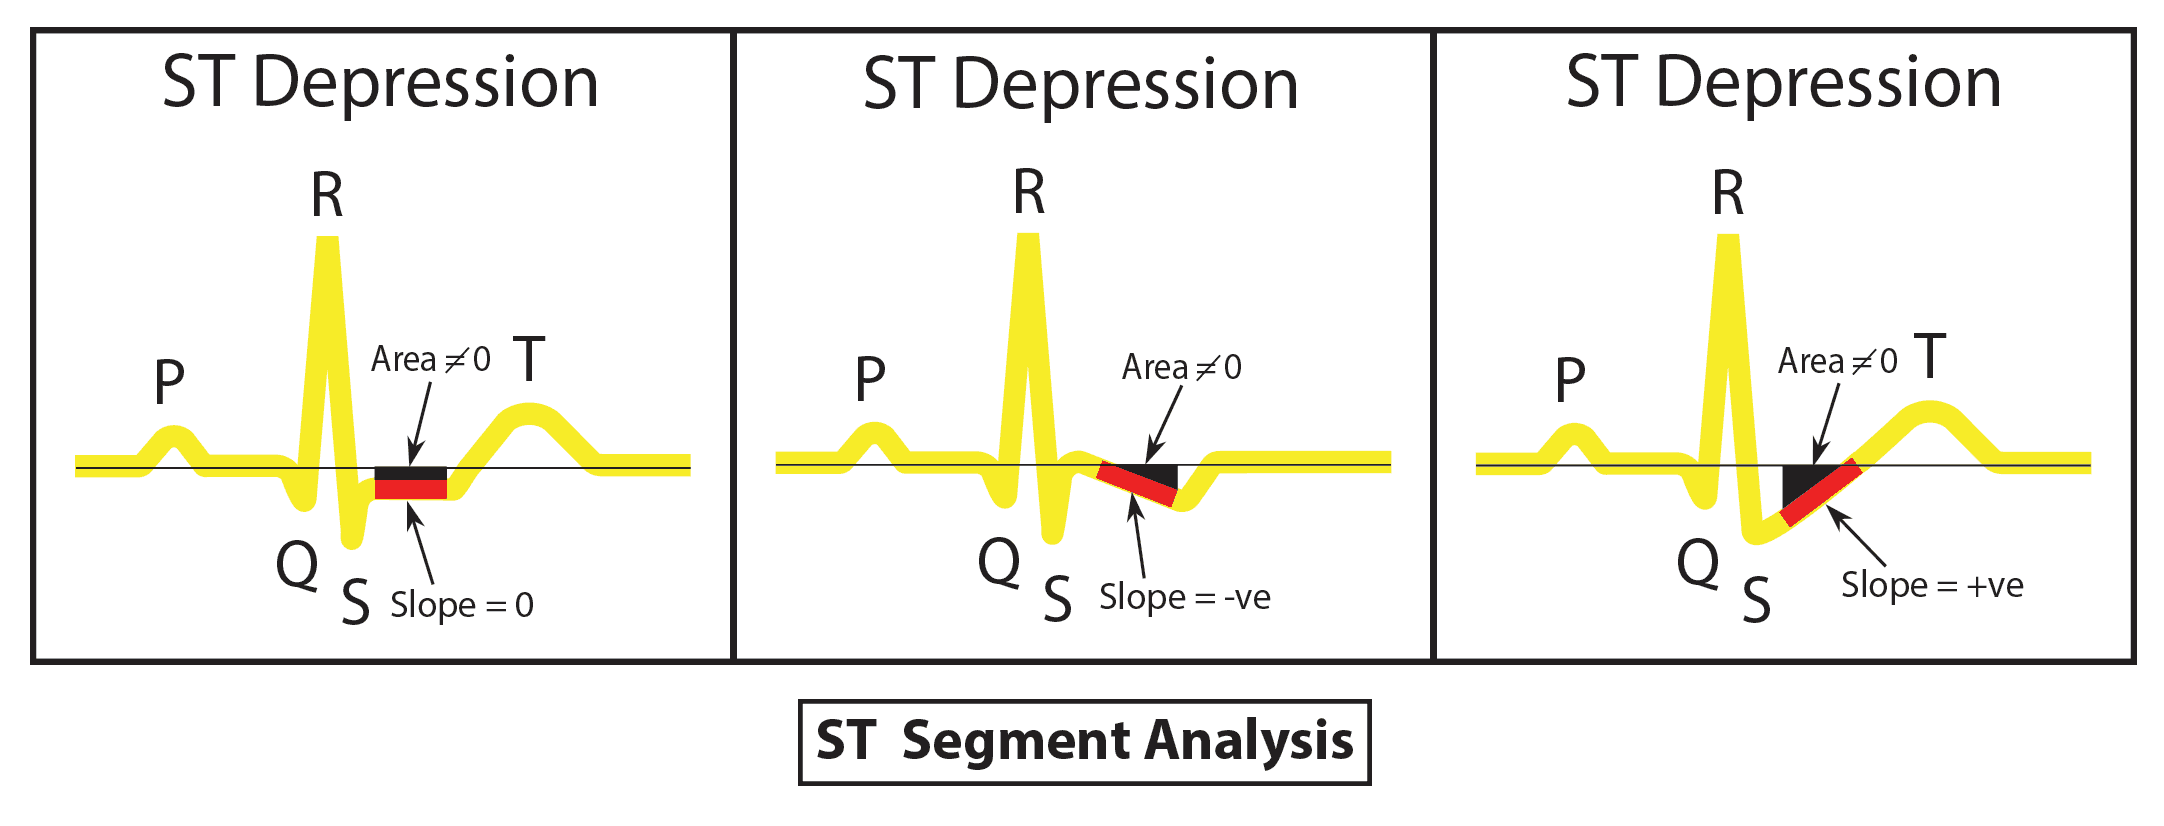
ST – Depression
ST – Analysis
– ST Segment Analysis (Elevation and Depression)
– ST Segment Analysis (Three difference types)
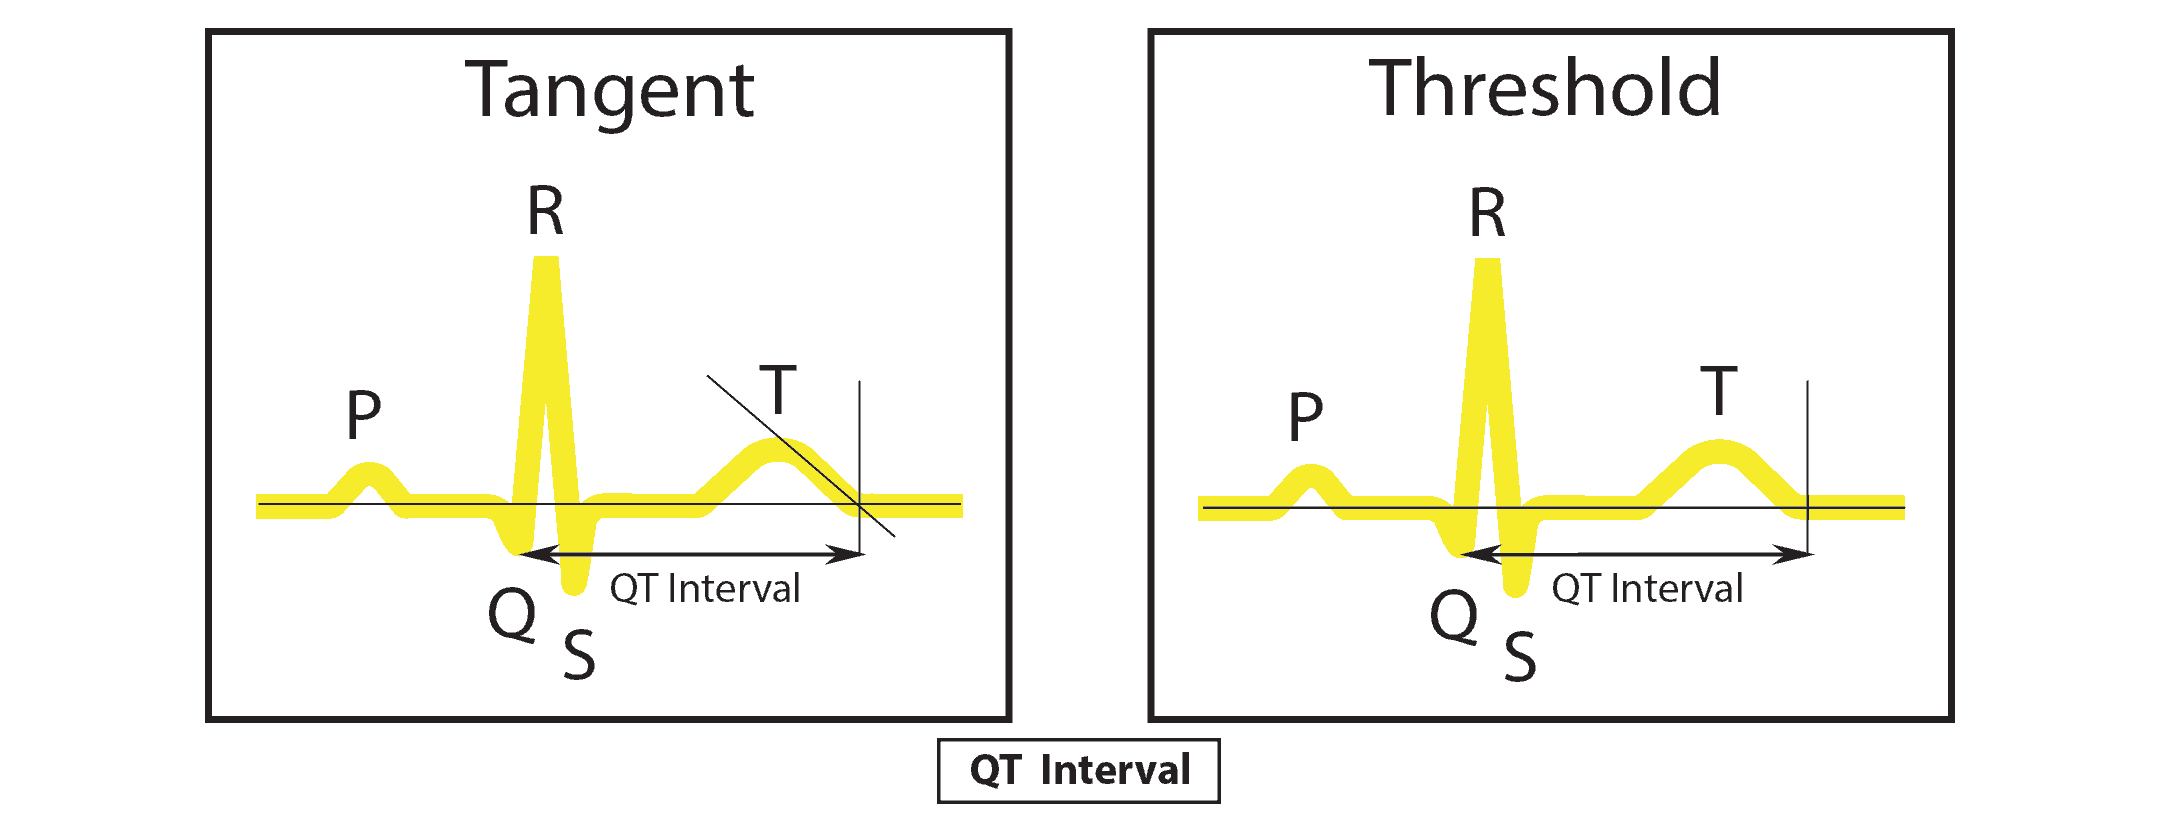
QT-Analysis
– Tangent Method
– Threshold Method
List of Bibliography – Page 1
1. Project of open-source software platform for sudden cardiac death ( SCD ) risk stratification and advanced ECG analysis – Semantic Scholar. semanticscholar.org. https://www.semanticscholar.org/paper/Project-of-open-source-software-platform-for-sudden-Rafa-Kotas/3c4542632aa3e513e736f3fee1d1ce94563018fd. Published 2013. Accessed November 29, 2018.
2. Detecting a Heart Attack with an EKG | Study.com. Study.com. https://study.com/academy/lesson/detecting-a-heart-attack-with-an-ekg.html. Accessed November 29, 2018.
3. Heart attack – Symptoms and causes. Mayo Clinic. https://www.mayoclinic.org/diseases-conditions/heart-attack/symptoms-causes/syc-20373106. Published May 30, 2018. Accessed November 29, 2018.
4. Chest Pain. CDEM Curriculum. https://cdemcurriculum.com/chest-pain/. Published August 29, 2015. Accessed November 29, 2018.
5. ST Segment Monitoring ST / AR Algorithm IntelliVue Patient Monitor and Information Center , Application Note – Semantic Scholar. semanticscholar.org. https://www.semanticscholar.org/paper/ST-Segment-Monitoring-ST-%2F-AR-Algorithm-IntelliVue-St-Algorithm/ee6f9d4367d90781b7dacfa424c5b55038d6dbe0. Accessed November 29, 2018.
6. QT interval. QT interval. https://en.wikipedia.org/wiki/QT_interval. Published January 12, 2019. Accessed January 12, 2019.
7. Ed Burns D, Dr Ed BurnsDr Ed Burns . Emergency Physician in Pre-hospital and Retrieval Medicine in Sydney, Australia. He has a passion for ECG interpretation and medical education. Ed is the force behind the LITFL ECG library | + Edward Burns | @edjamesburns A. QT Interval • LITFL Medical Blog • ECG Library Basics. Life in the Fast Lane. https://litfl.com/qt-interval-ecg-library/. Published August 1, 2018. Accessed November 29, 2018.
List of Bibliography – Page 2
8. A Mobile Device Based ECG Analysis System. semanticscholar.org. https://pdfs.semanticscholar.org/9434/2227b5e415d08816a6cd6932586c92767914.pdf. Published November 1, 2008. Accessed November 29, 2018.
9. Szczepanski A, Saeed K. A Mobile Device System for Early Warning of ECG Anomalies. MDPI. https://www.mdpi.com/1424-8220/14/6/11031. Published June 20, 2014. Accessed November 29, 2018.
10. Deceleration capacity of heart rate as a predictor of mortality after myocardial infarction: cohort study. – Semantic Scholar. semanticscholar.org. https://www.semanticscholar.org/paper/Deceleration-capacity-of-heart-rate-as-a-predictor-Bauer-Kantelhardt/fbcb7966c84f92473957257ae873d0524b70f060. Published 2006. Accessed November 29, 2018.
11. Mustafa Ahmed D, Jason L. Guichard, MD, PhD D. What is NSTEMI? What You NEED to Know • MyHeart. MyHeart. https://myheart.net/articles/nstemi/. Published November 20, 2014. Accessed November 29, 2018.
12. Heart Rate Turbulence: Standards of Measurement, Physiological Interpretation, and Clinical Use. onlinejacc.org. http://www.onlinejacc.org/content/52/17/1353. Published October 17, 2008. Accessed November 29, 2018.
13. BD and Verrier RL N. Modified moving average analysis of T-wave alternans to predict ventricular fibrillation with high accuracy. ncbi.nlm.nih.gov. https://www.ncbi.nlm.nih.gov/pubmed/11796662. Accessed November 29, 2018.
14. Measuring the T Wave of the Electrocardiogram; The How and Why. measurement.sk. http://www.measurement.sk/2009/S1/Oosterom.pdf. Published 2009. Accessed November 29, 2018.
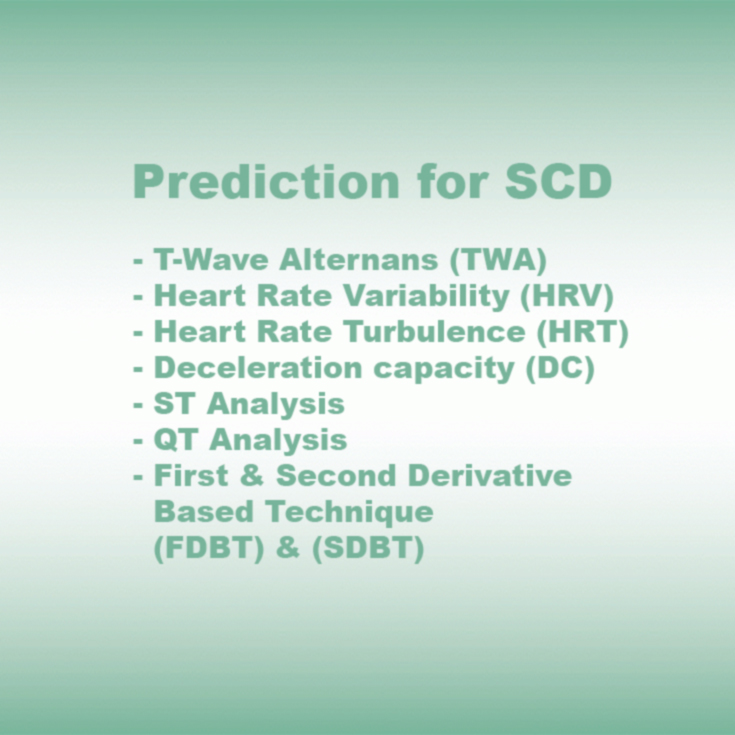
Prediction for SCD
– T-Wave Alternans (TWA)
– Heart Rate Variability (HRV)
– Heart Rate Turbulence (HRT)
– Deceleration capacity (DC)
– ST Analysis
– QT Analysis
– First & Second Derivative Based Technique (FDBT) & (SDBT)
Bibliography
– Sudden cardiac death (SCD)
– Sudden Cardiac Arrest
– Heart Attack
– Chest Pain
Research & Development
Assembly of ECG Monitor (Third Prototype) – Heart Mode Design
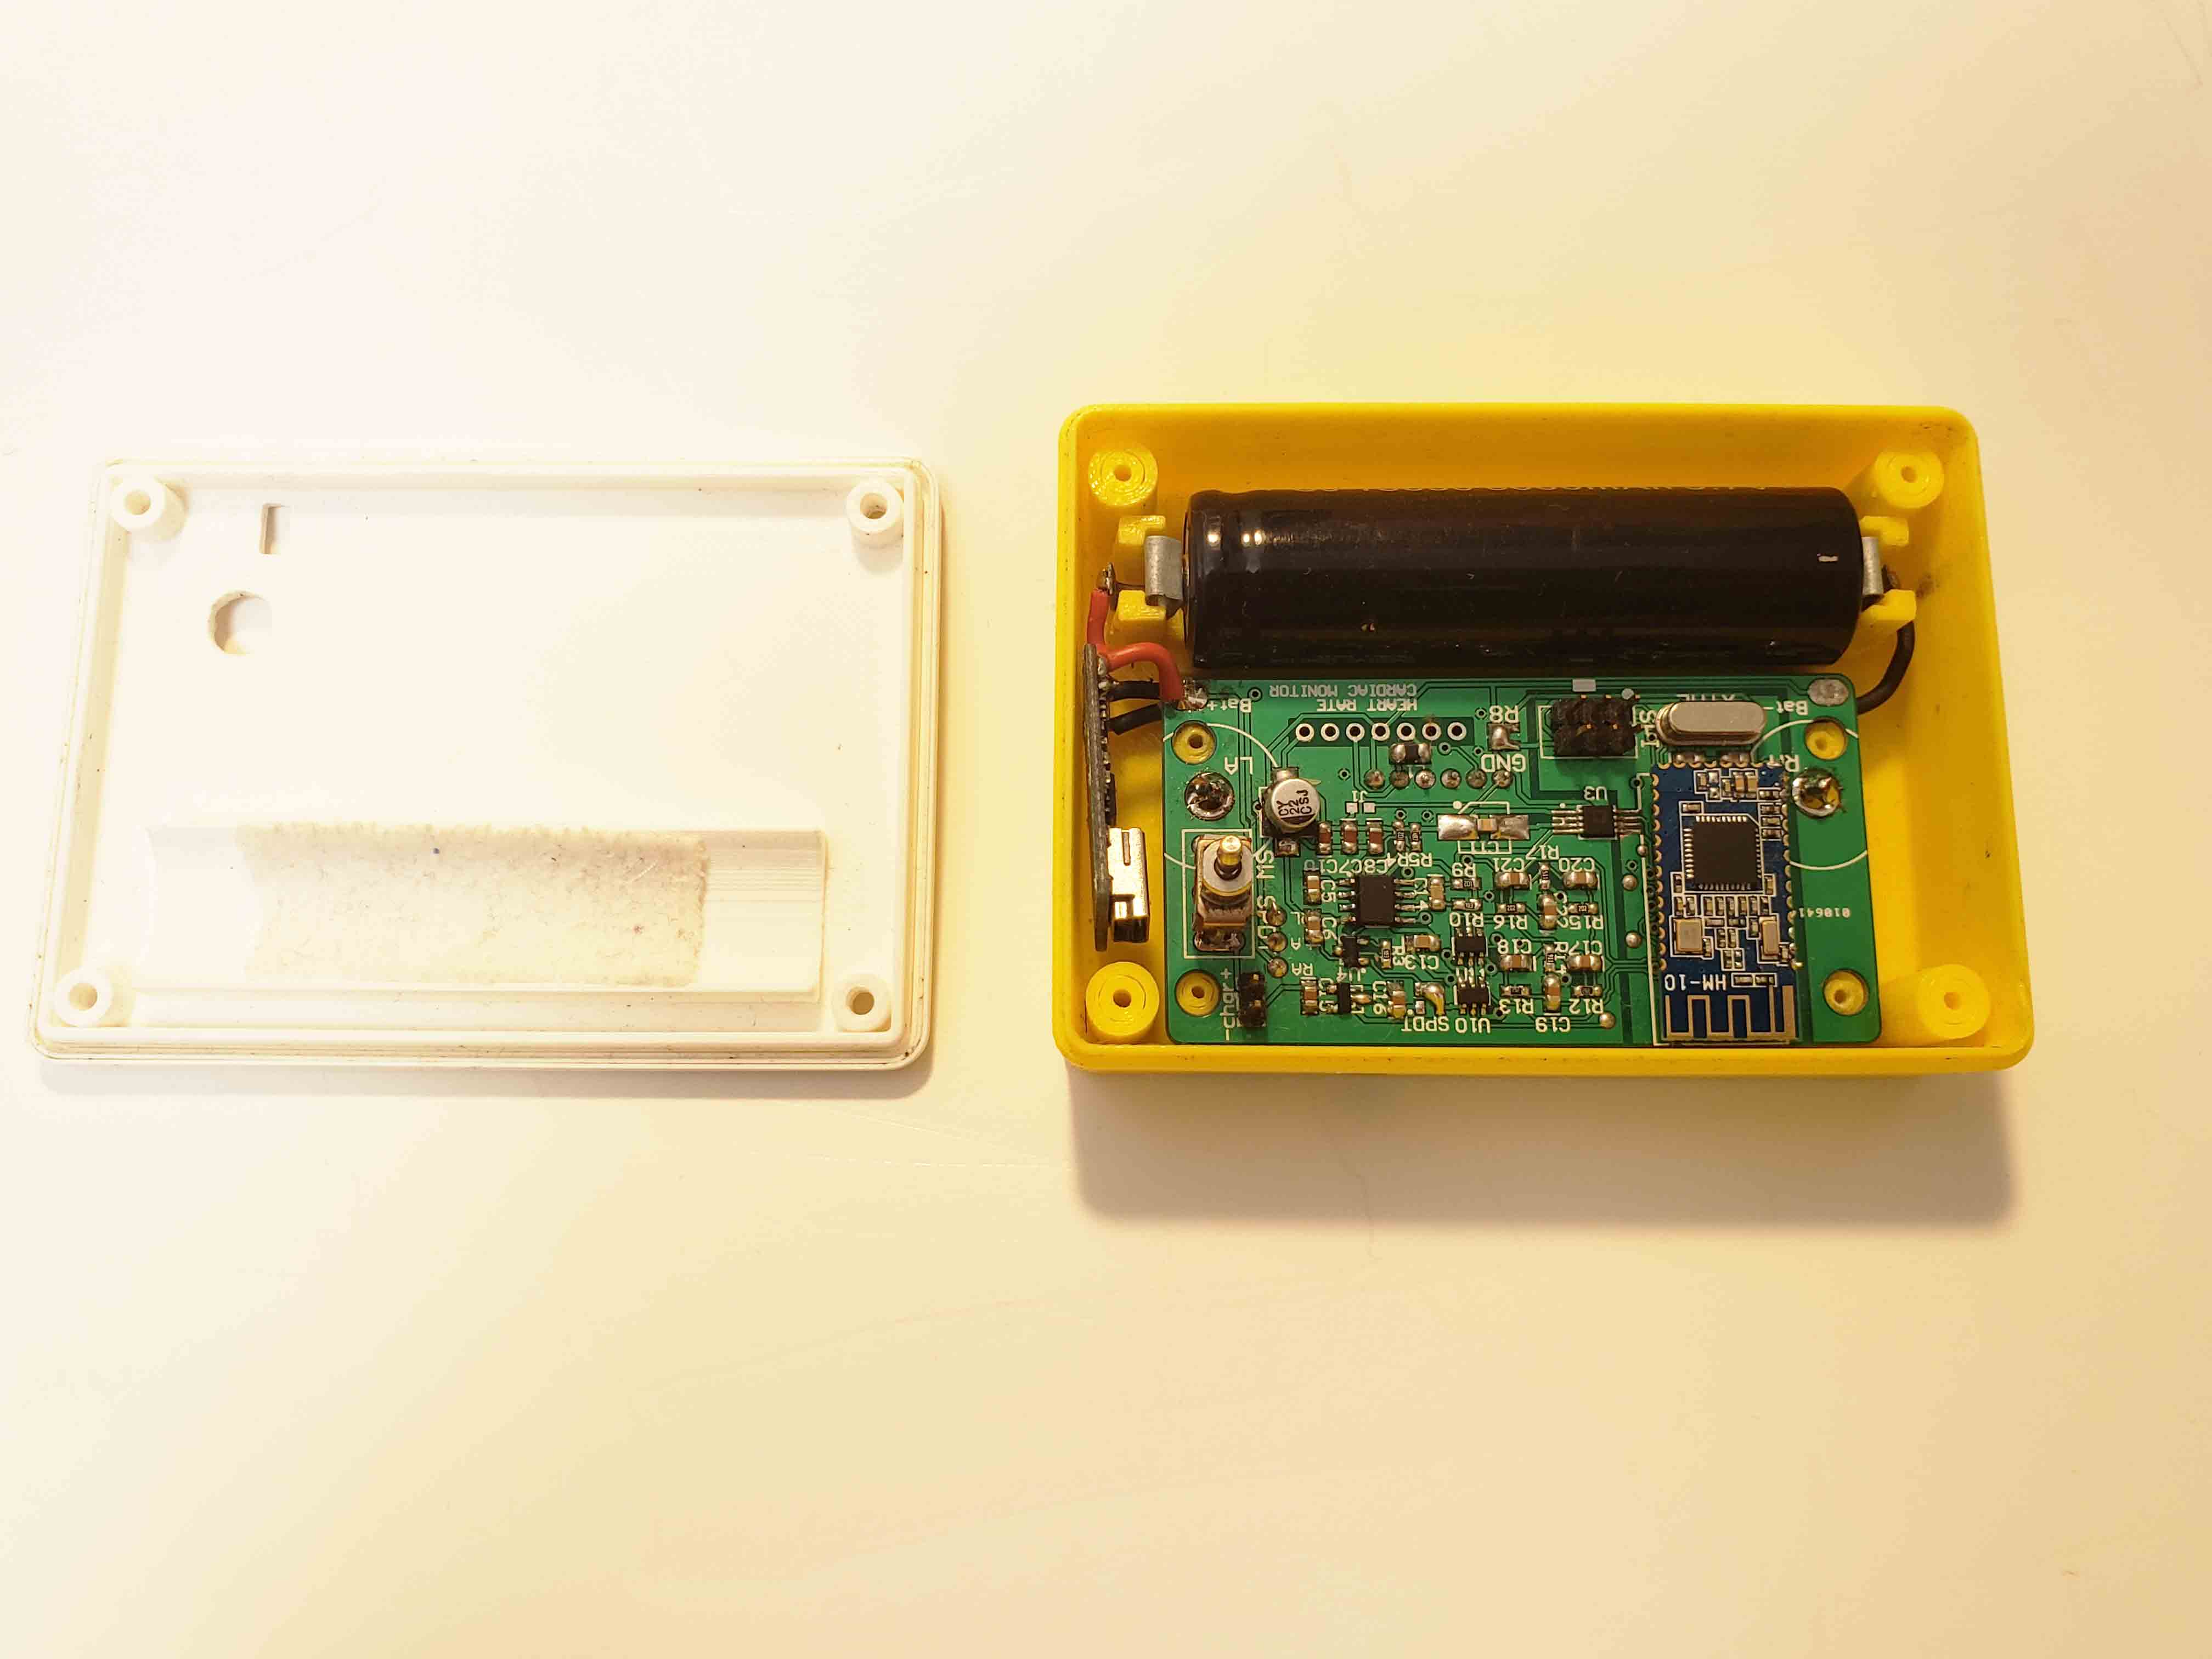
Assembly of ECG Monitor (Third Prototype)
AVR 328 MCU with Bluetooth 2, 16-bit ADC converter are assembled in first housing.
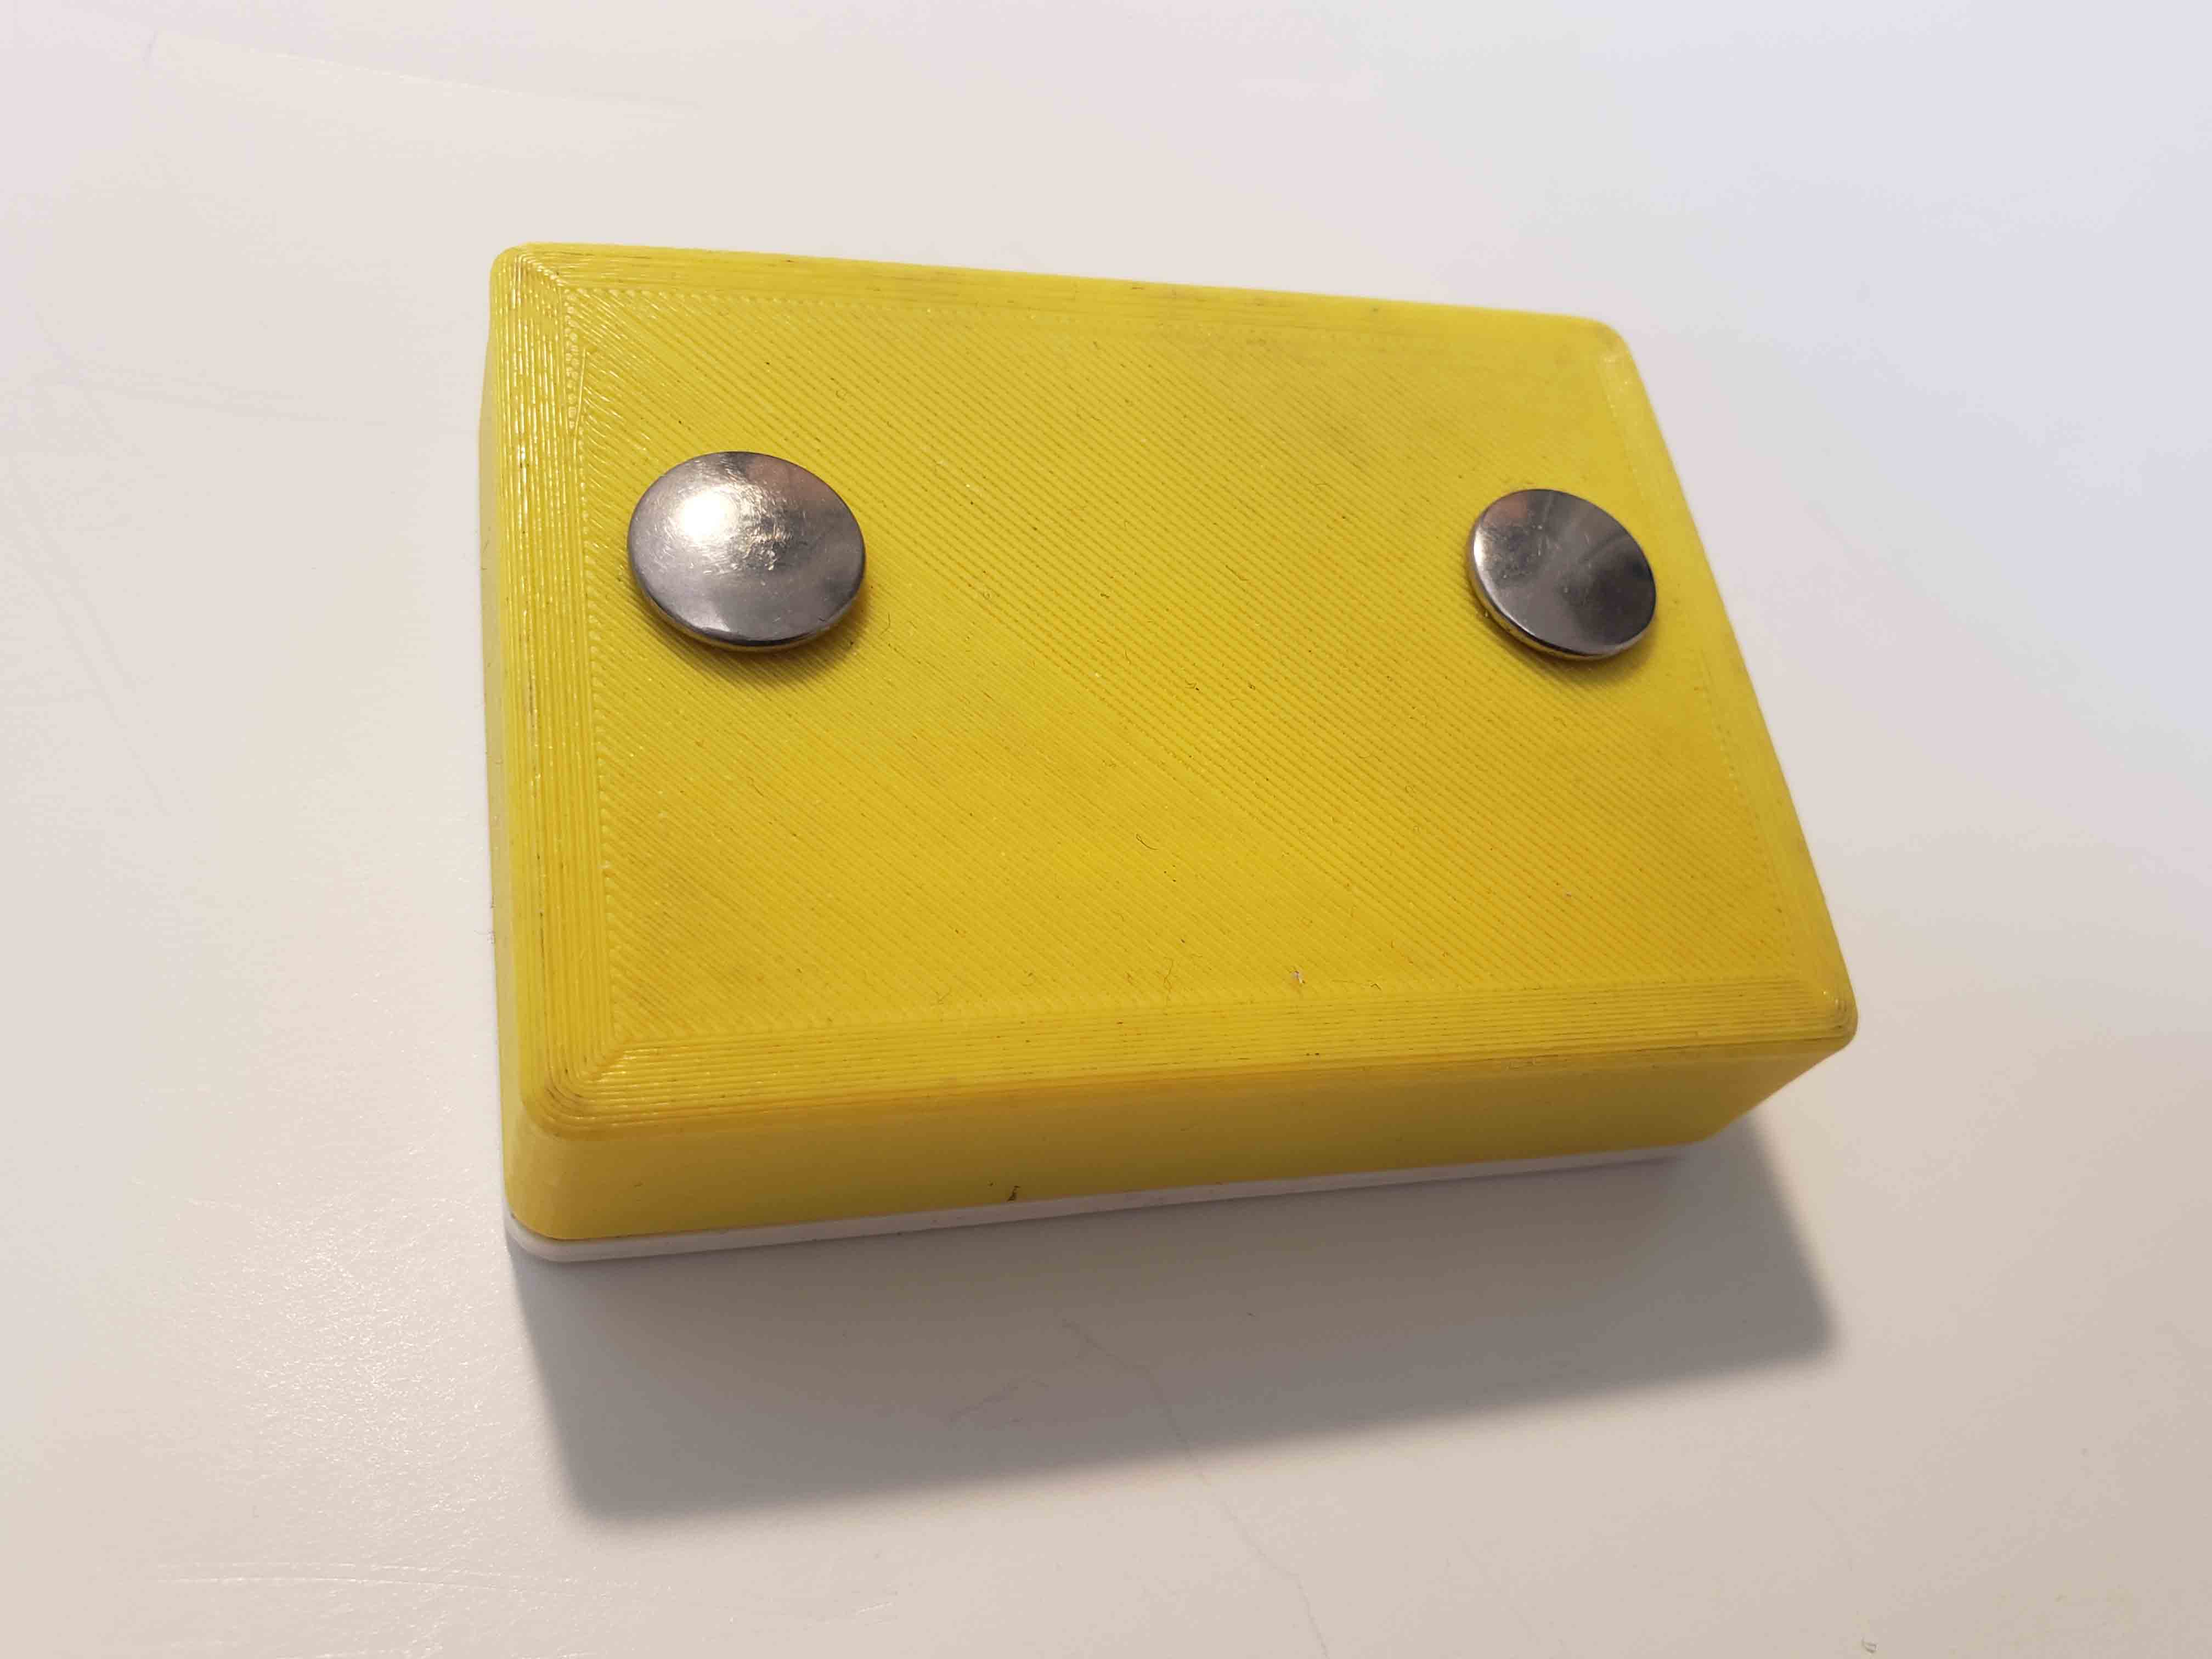
First Prototype
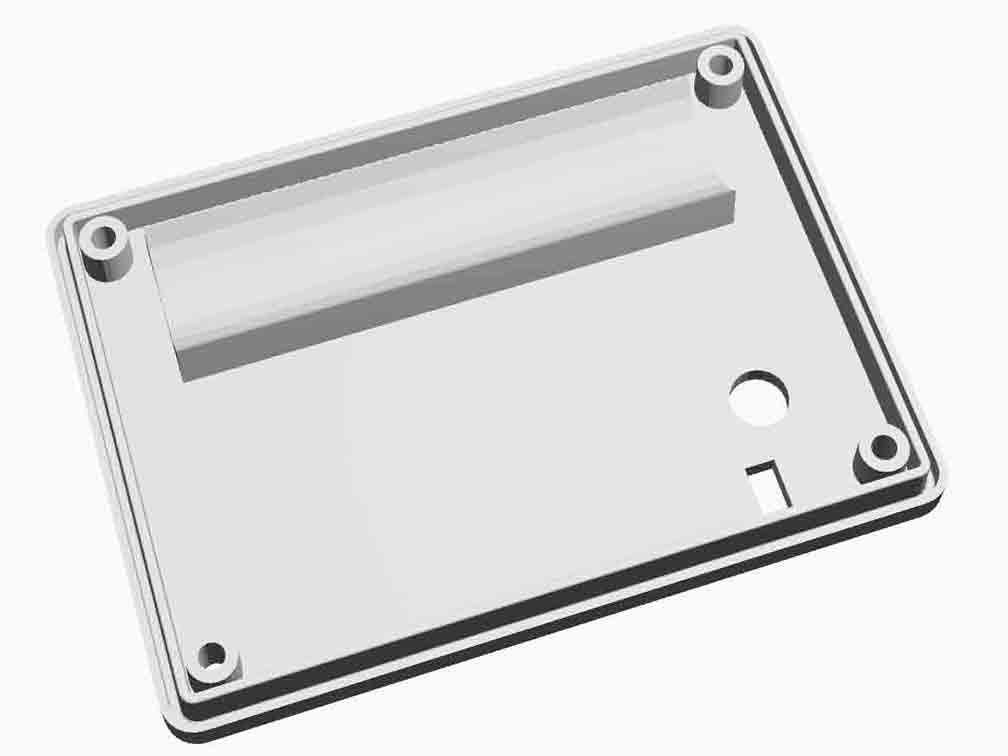
ECG Housing – Top Lid for Third Prototype ECG Monitor
ECG Housing – Bottom Case for Third Prototype ECG Monitor
3D Printing STL file
AutoCAD Housing Design for Third Prototype ECG Monitor
Mechanical Design
ATMega328 BT2 ECG Monitor Prototype
Specification:
AVR: ATMega328
Clock: 7.3728MHz
Bluetooth: BT2
ADC: 16-Bit AD Convertor
Baud Rate: 115200 bps
July 2015
Firmware Design
Hardware Design
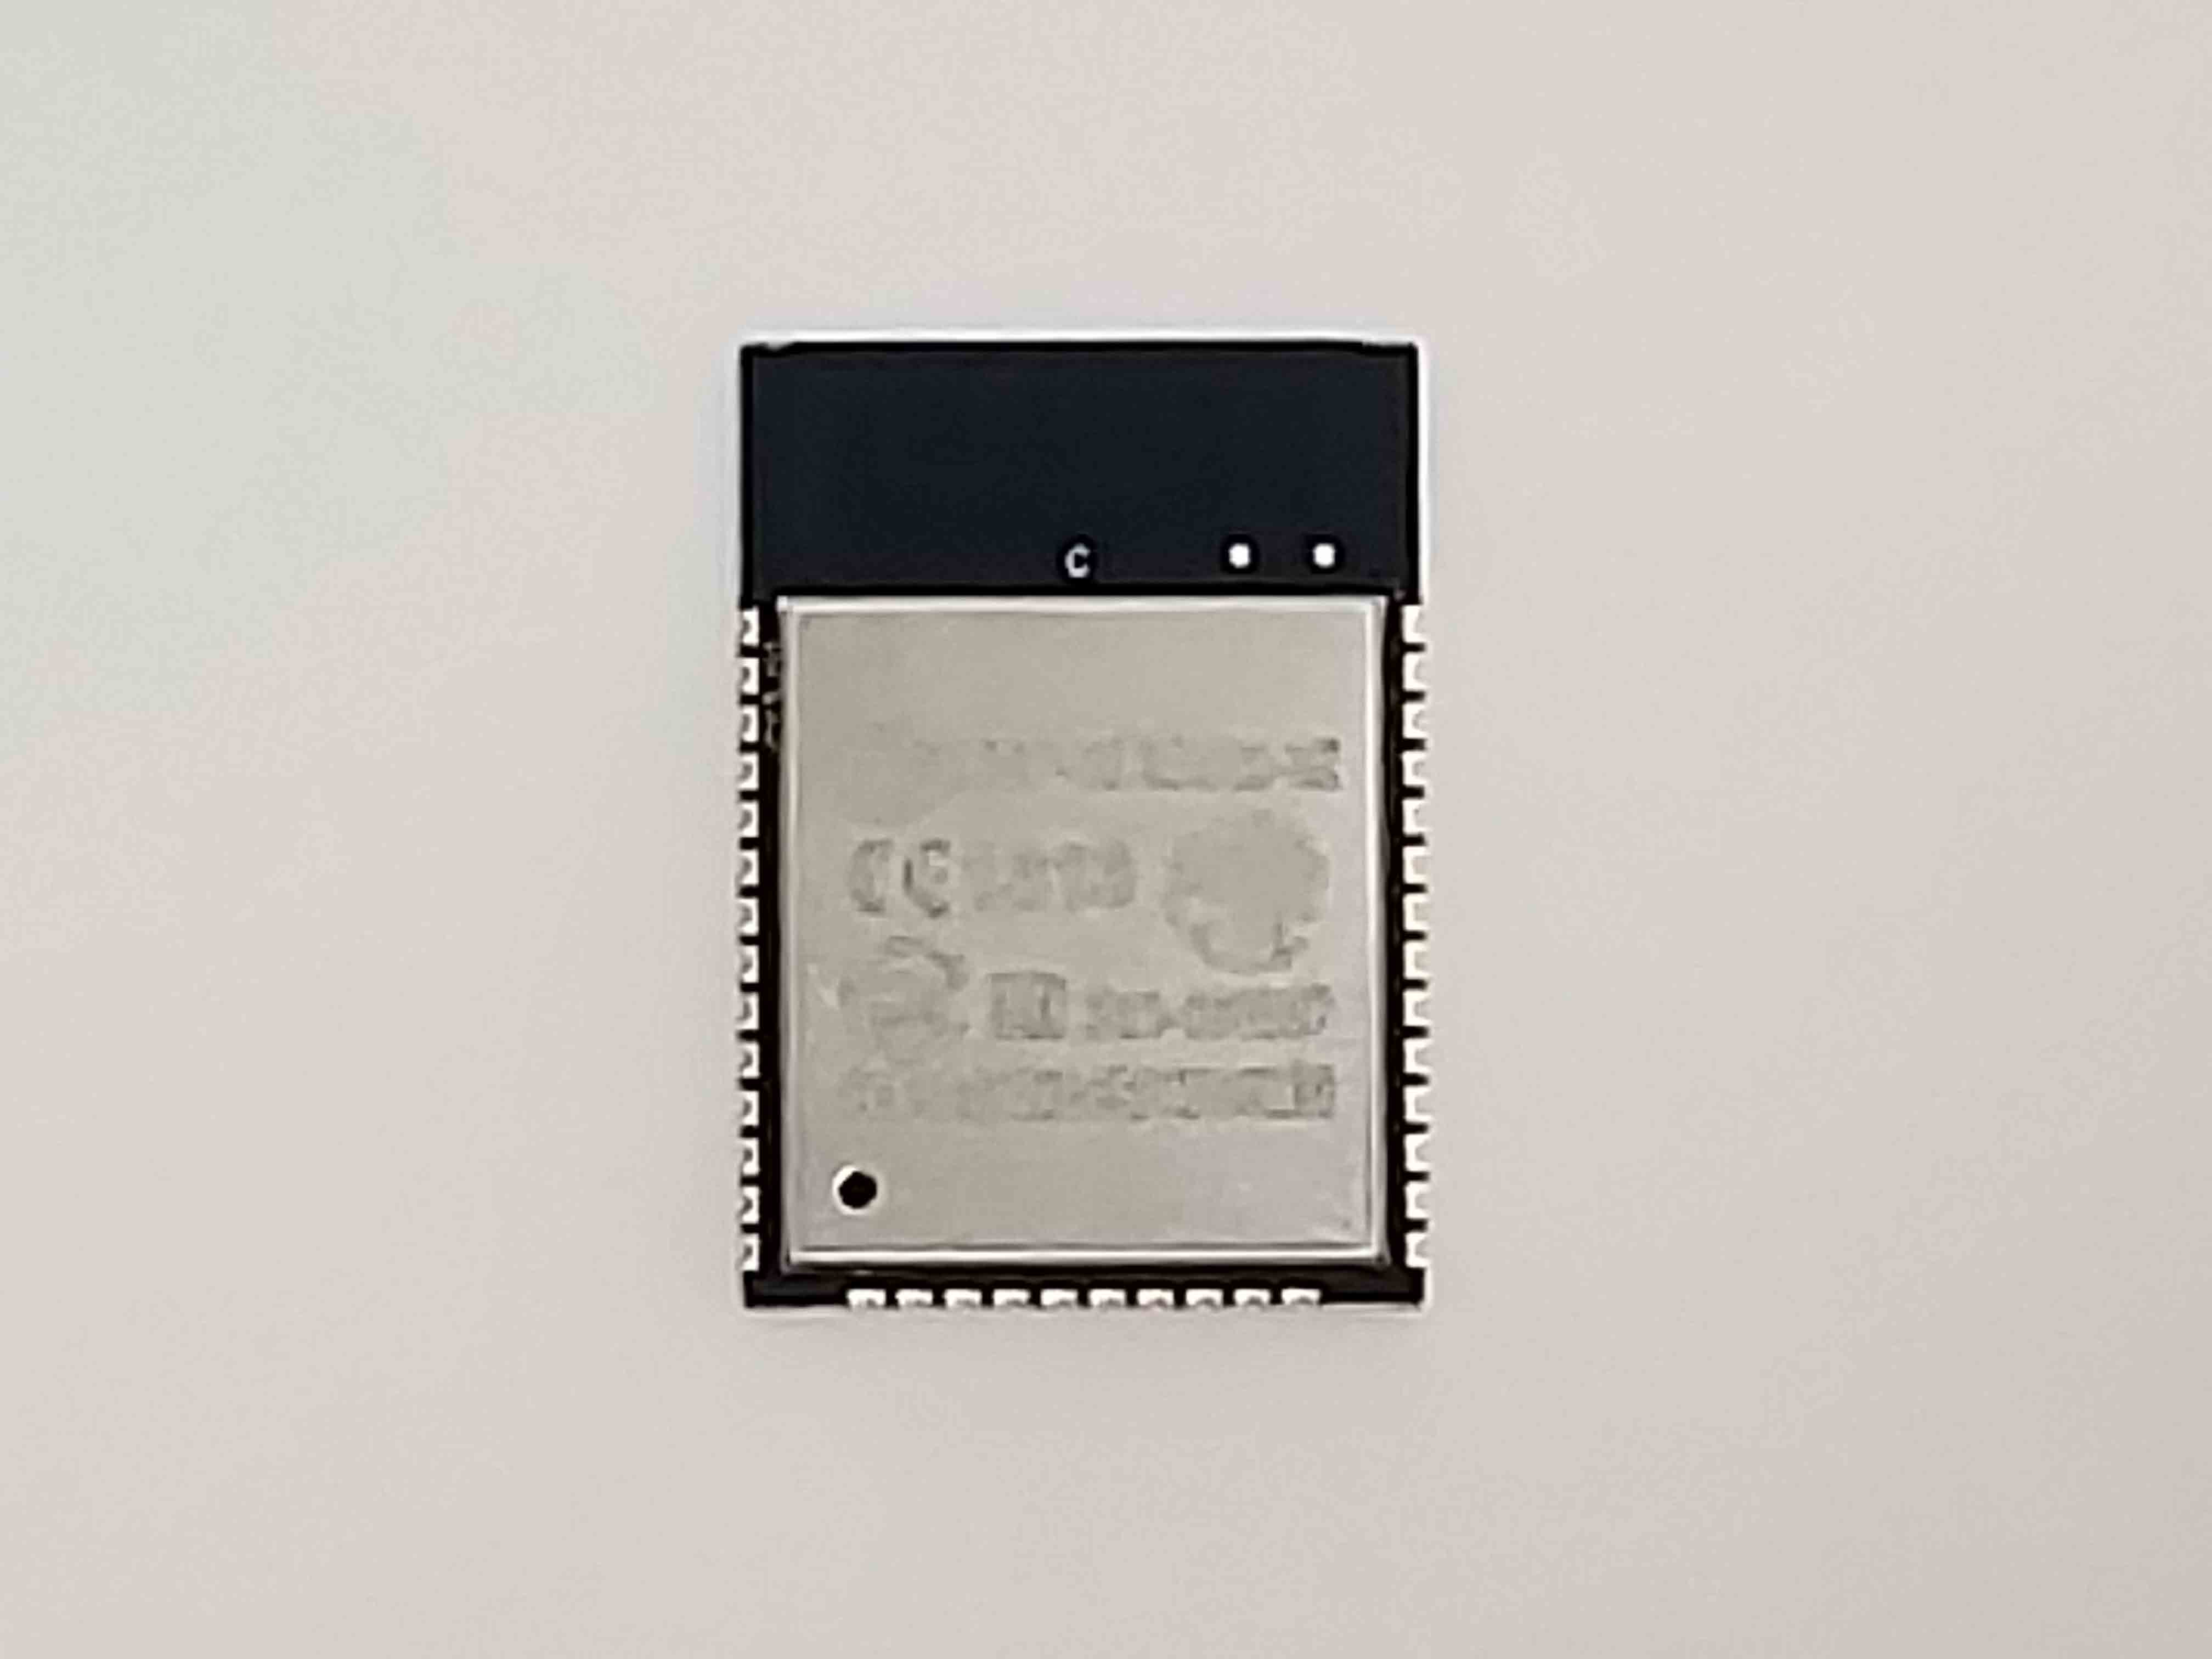
IOT – WIFI Module WROOM32 Unit
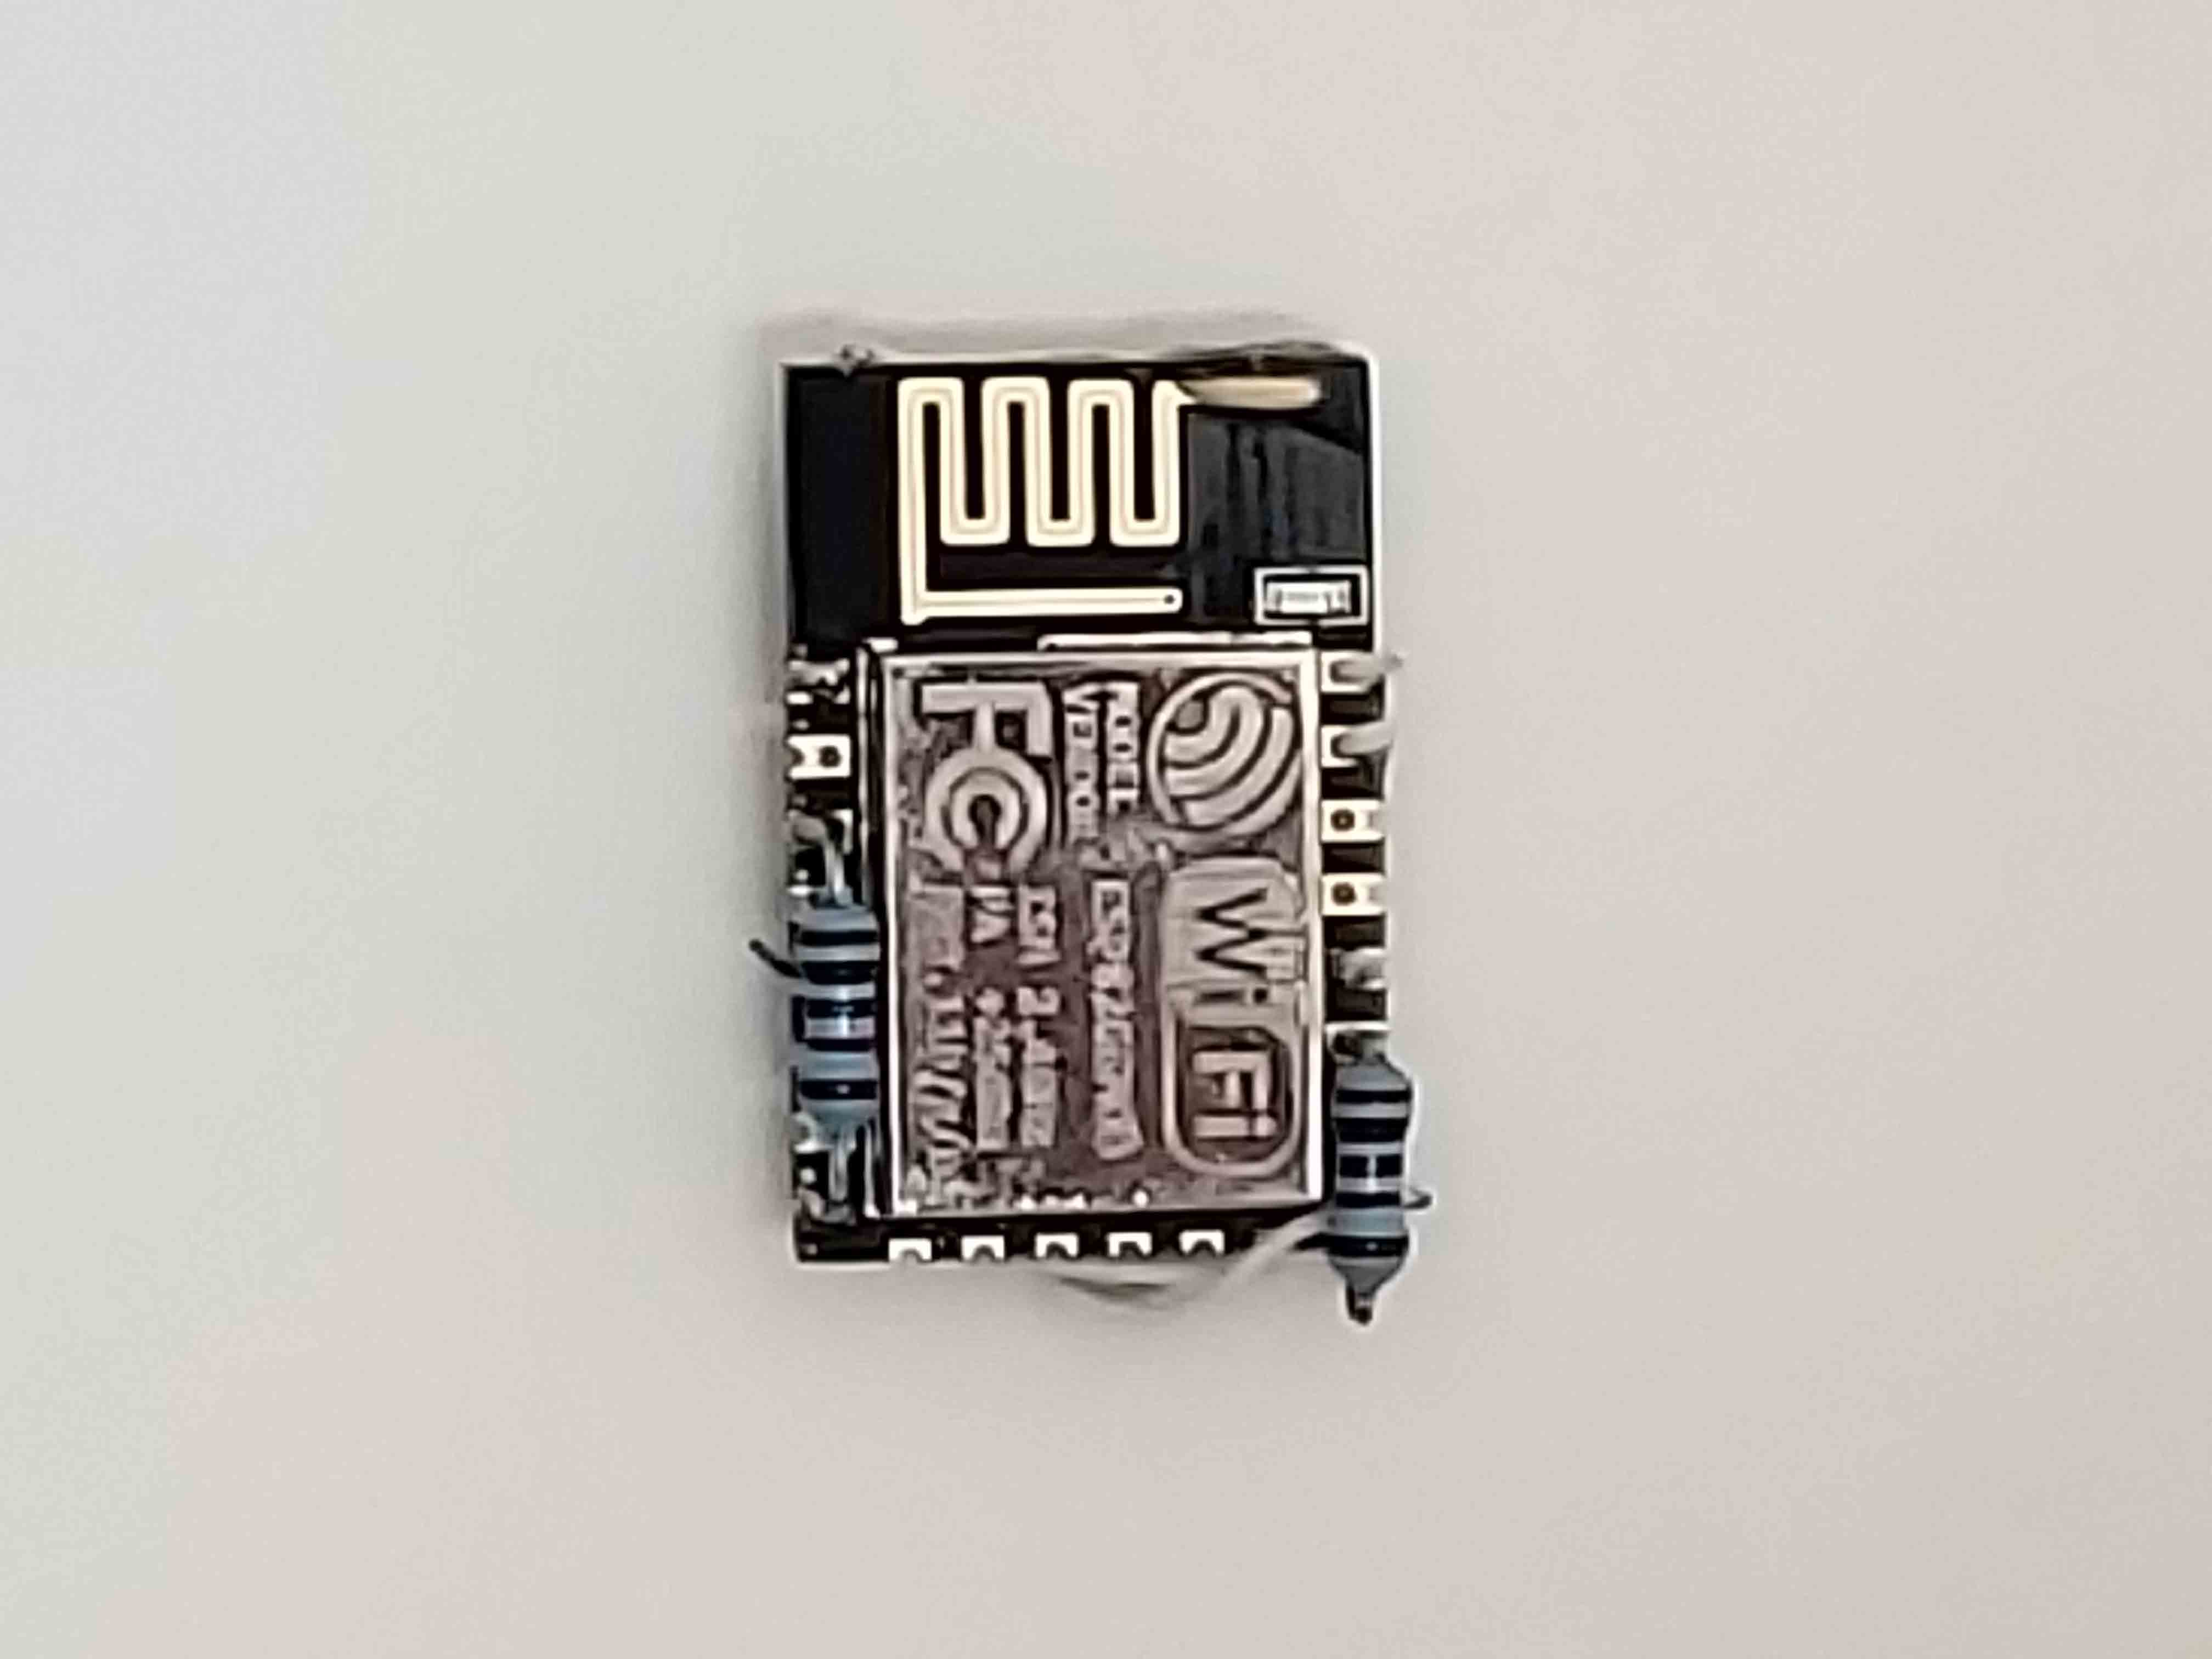
IOT – WIFI Module ESP Unit
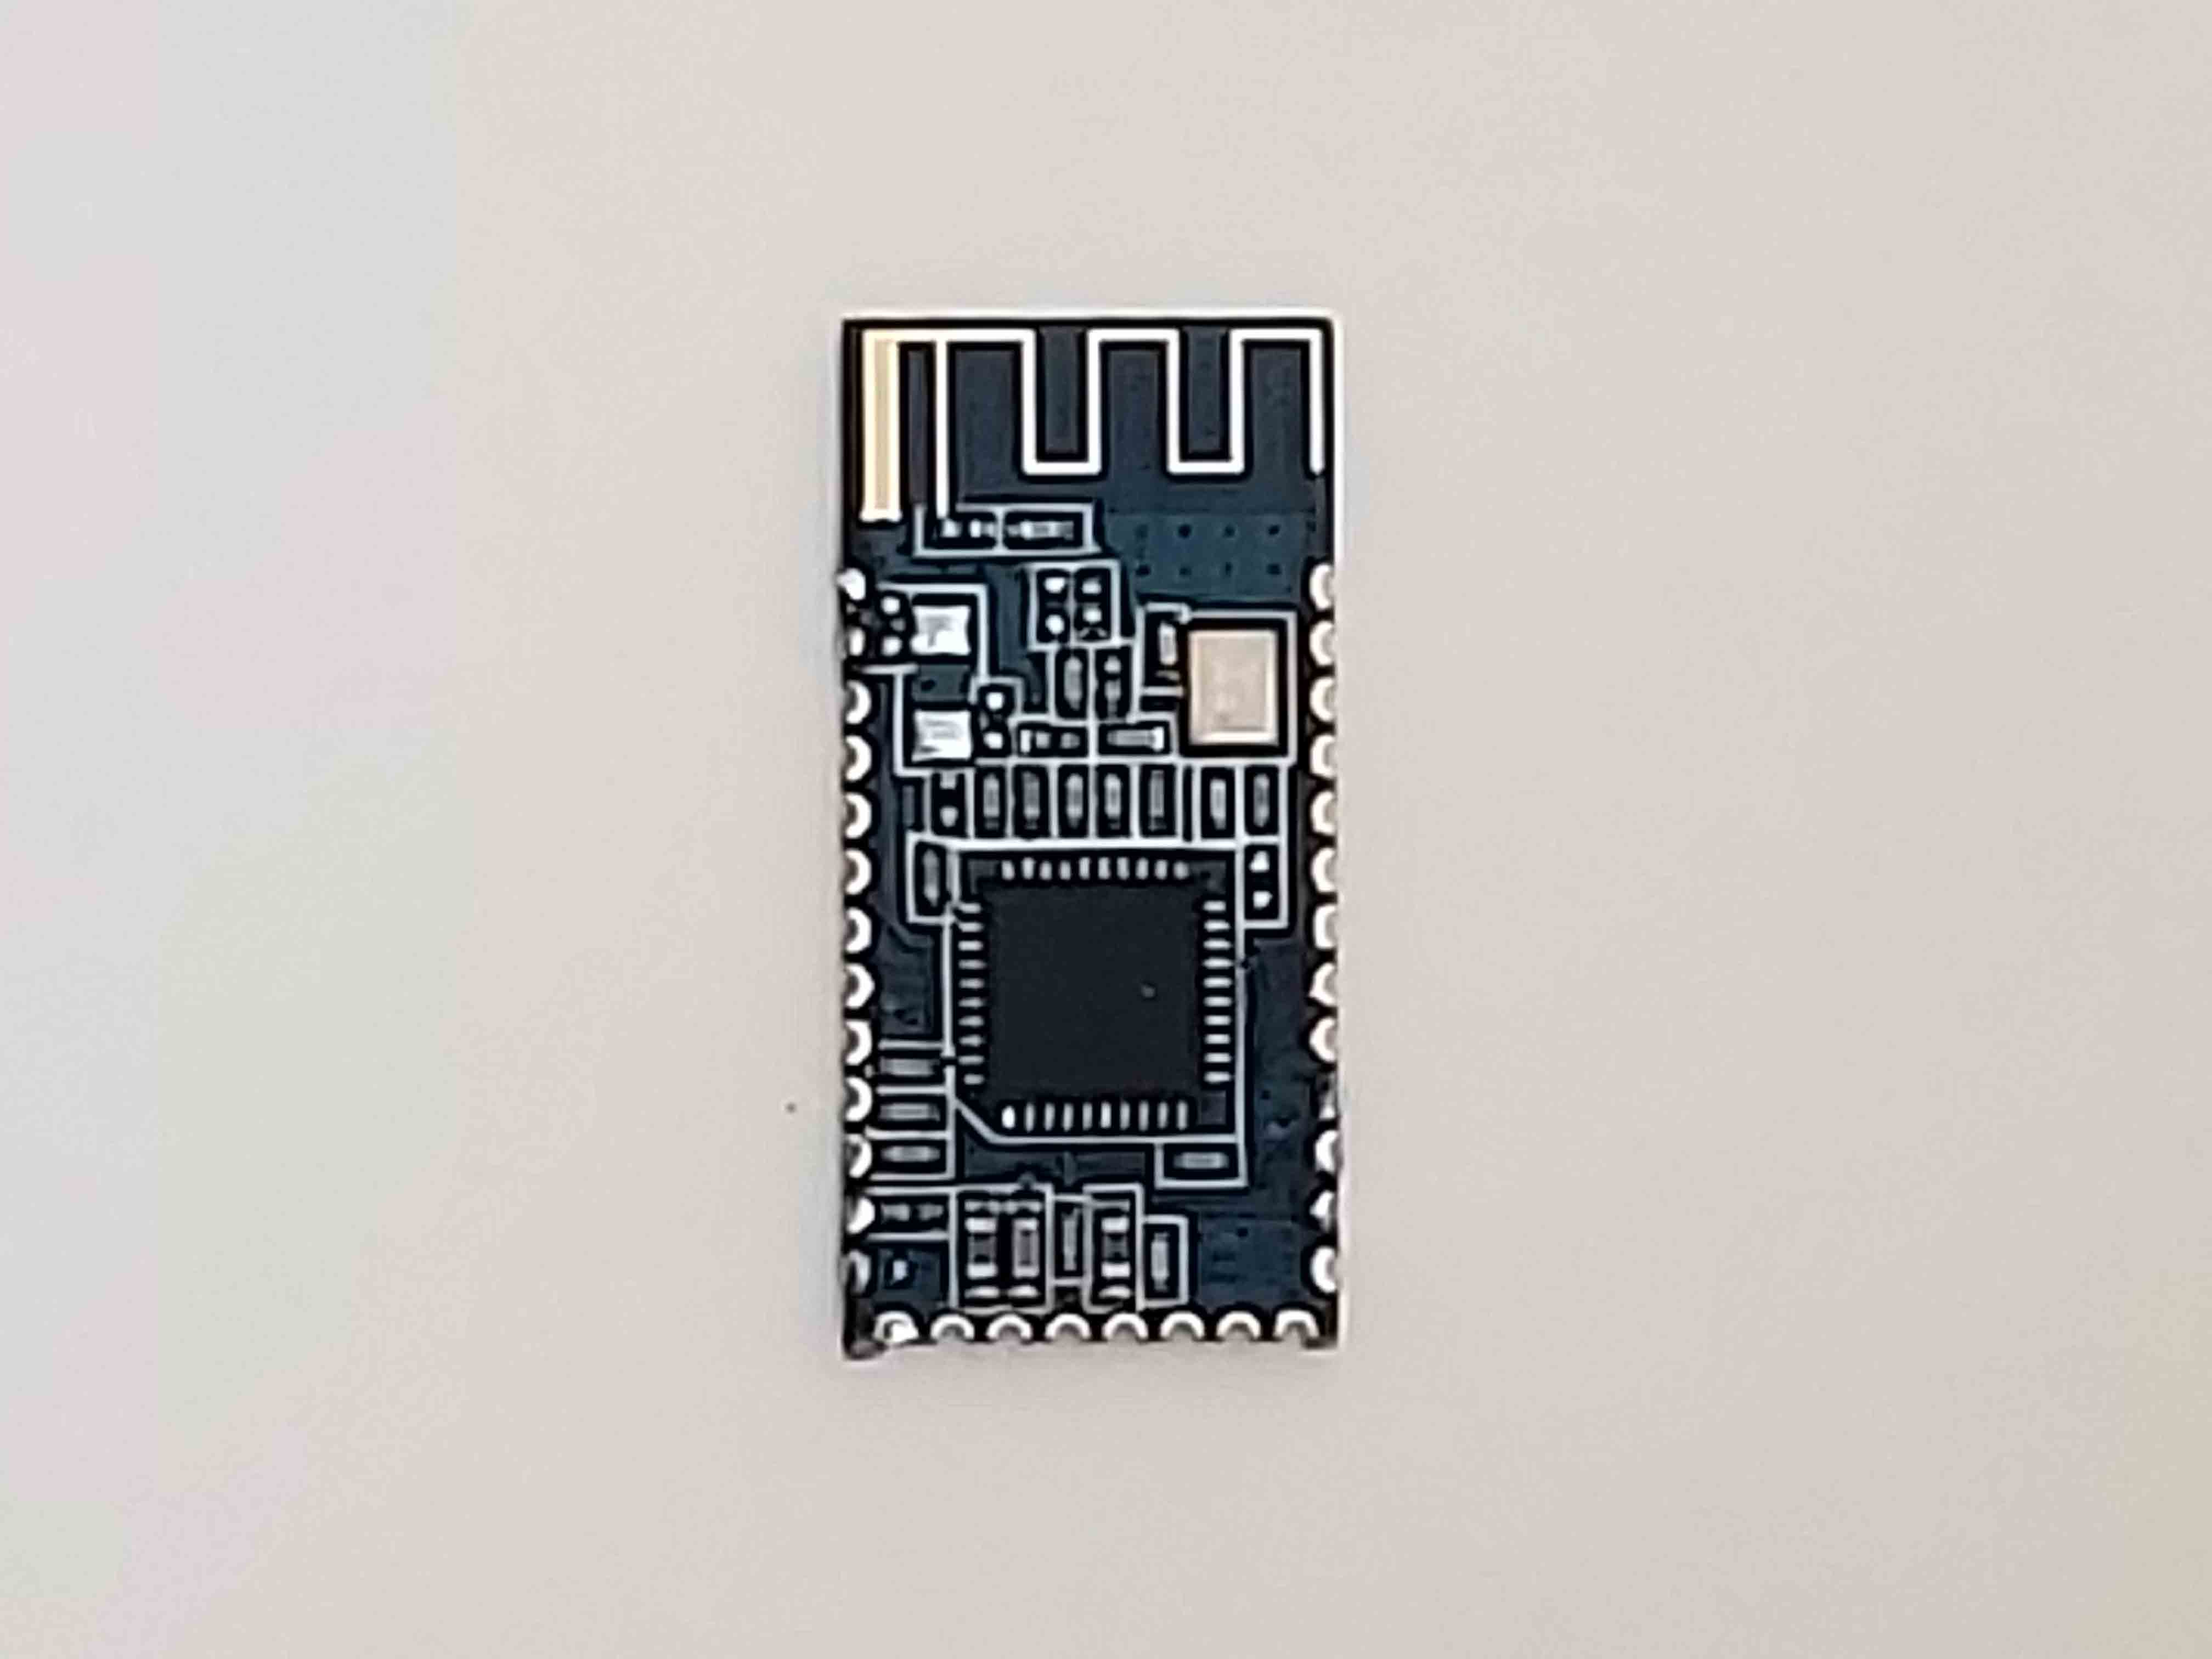
IOT – Bluetooth BT4
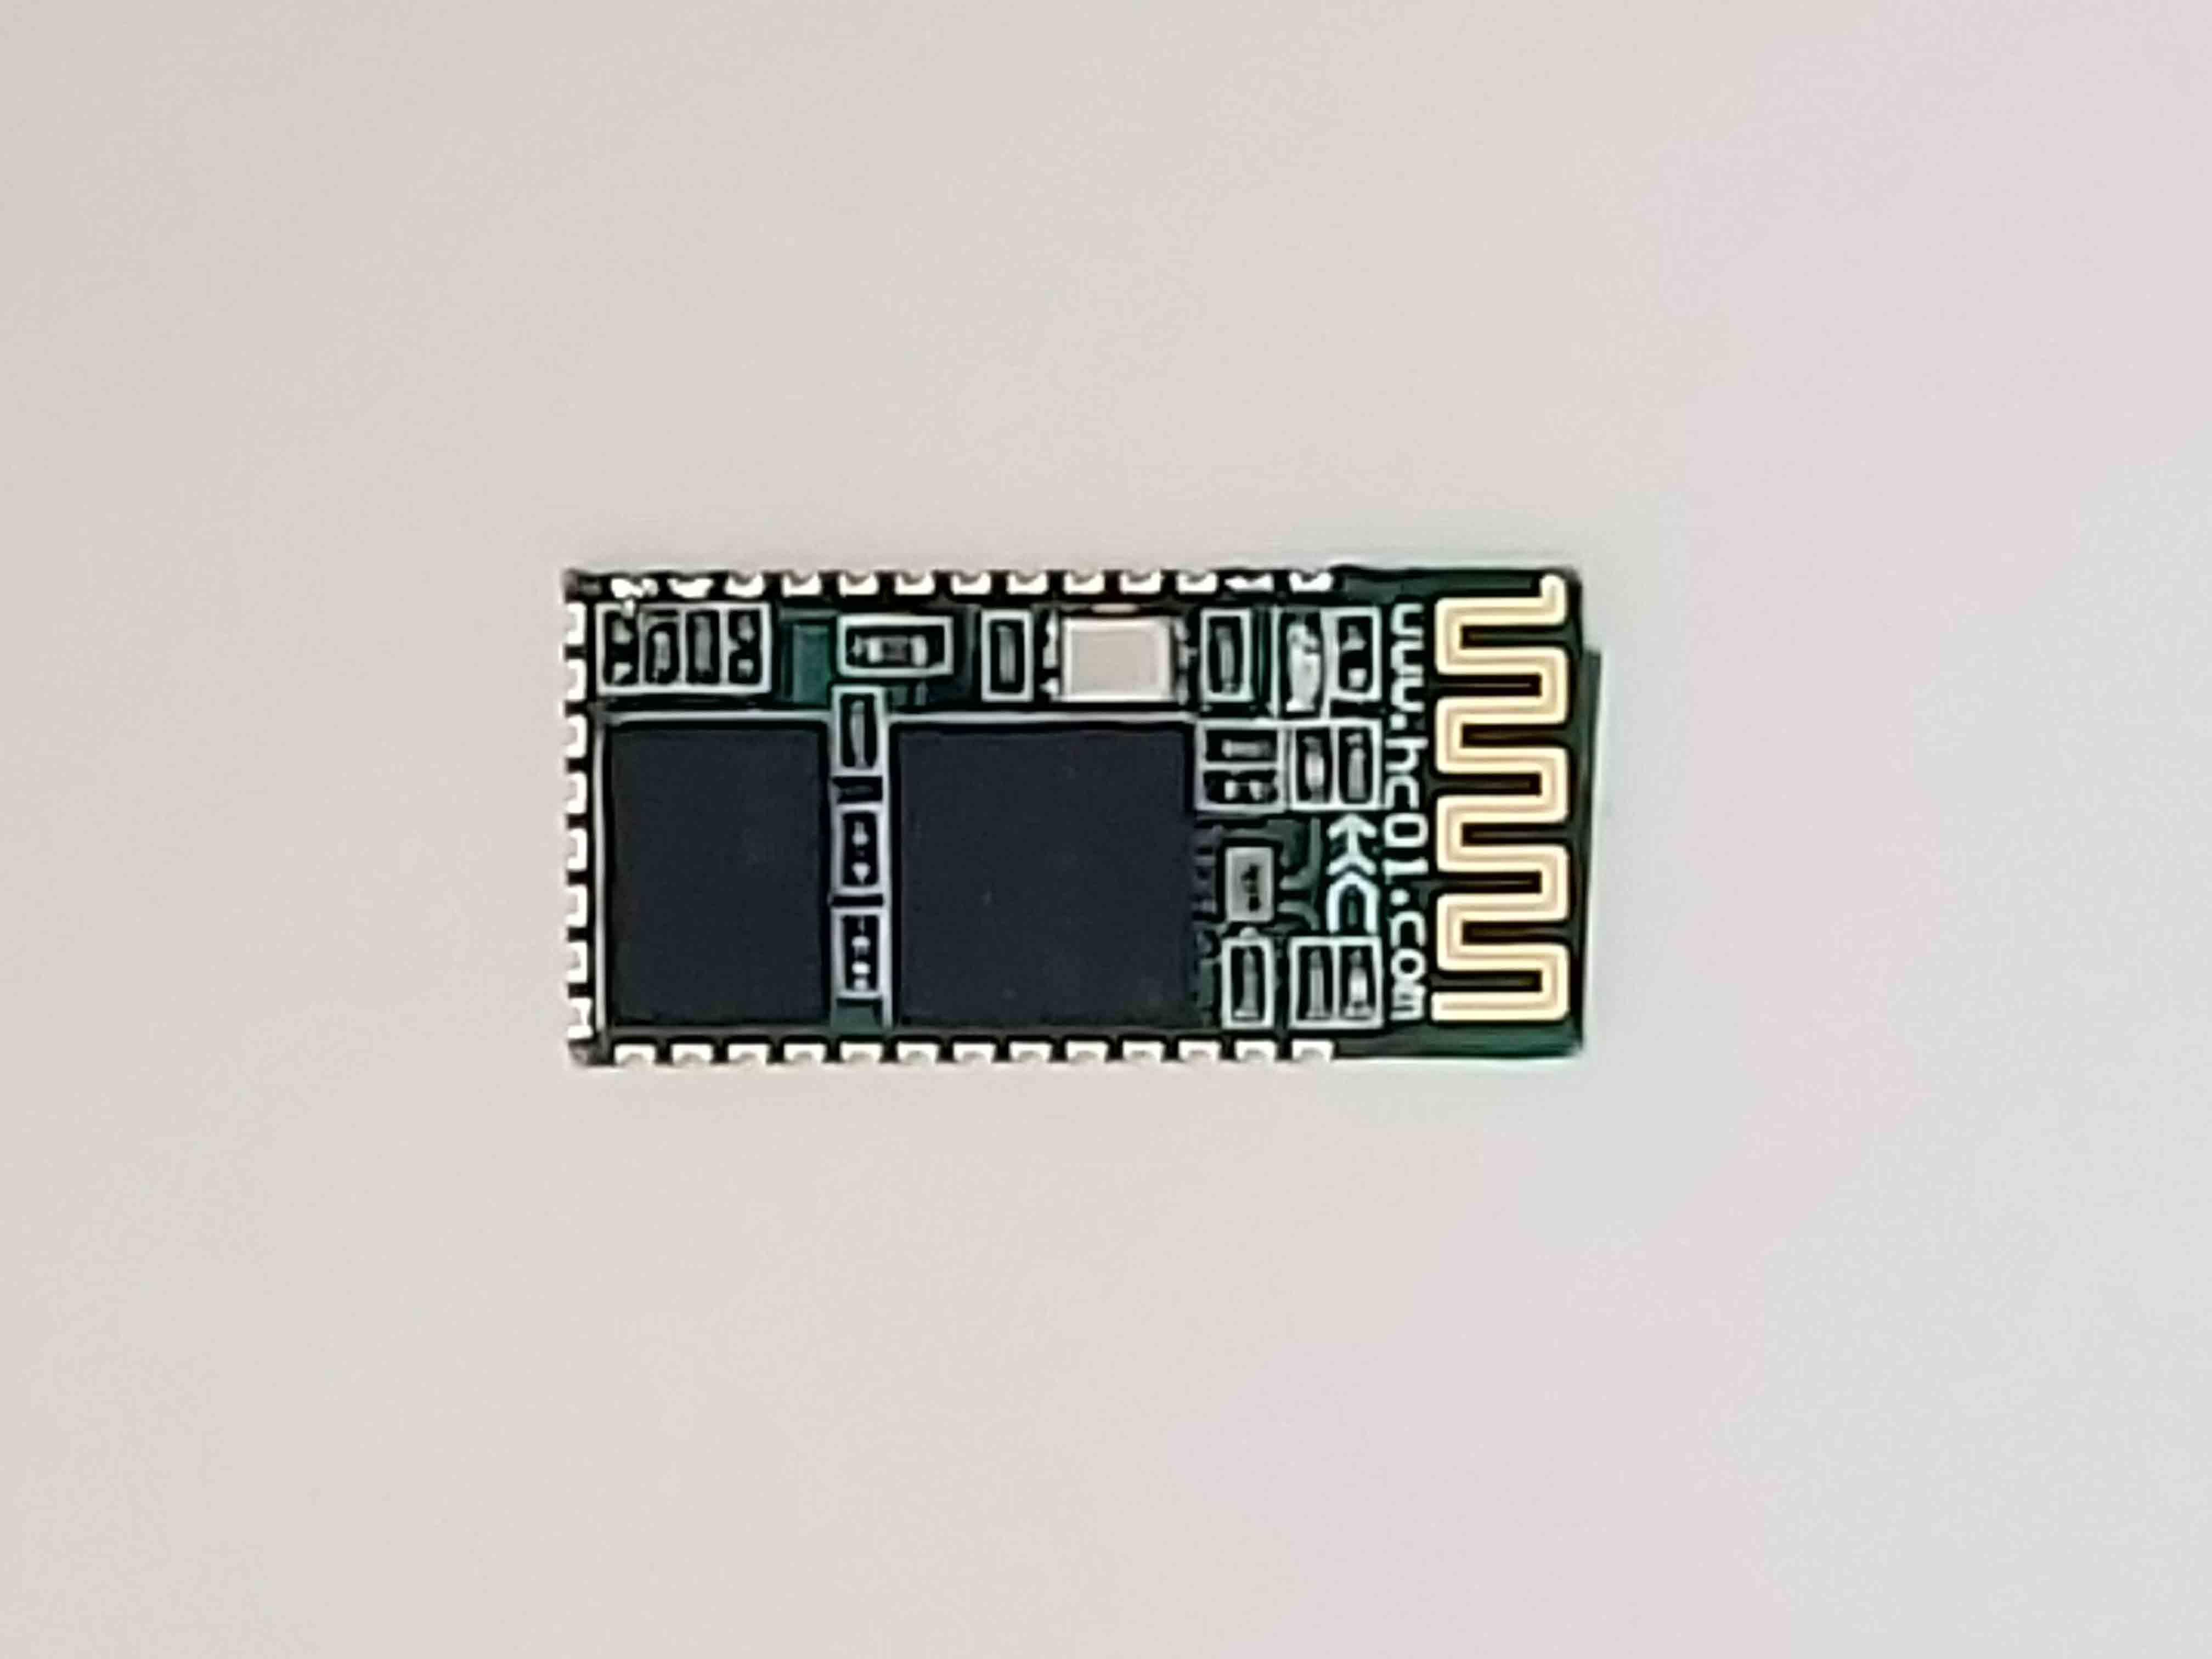
IOT – Bluetooth BT2
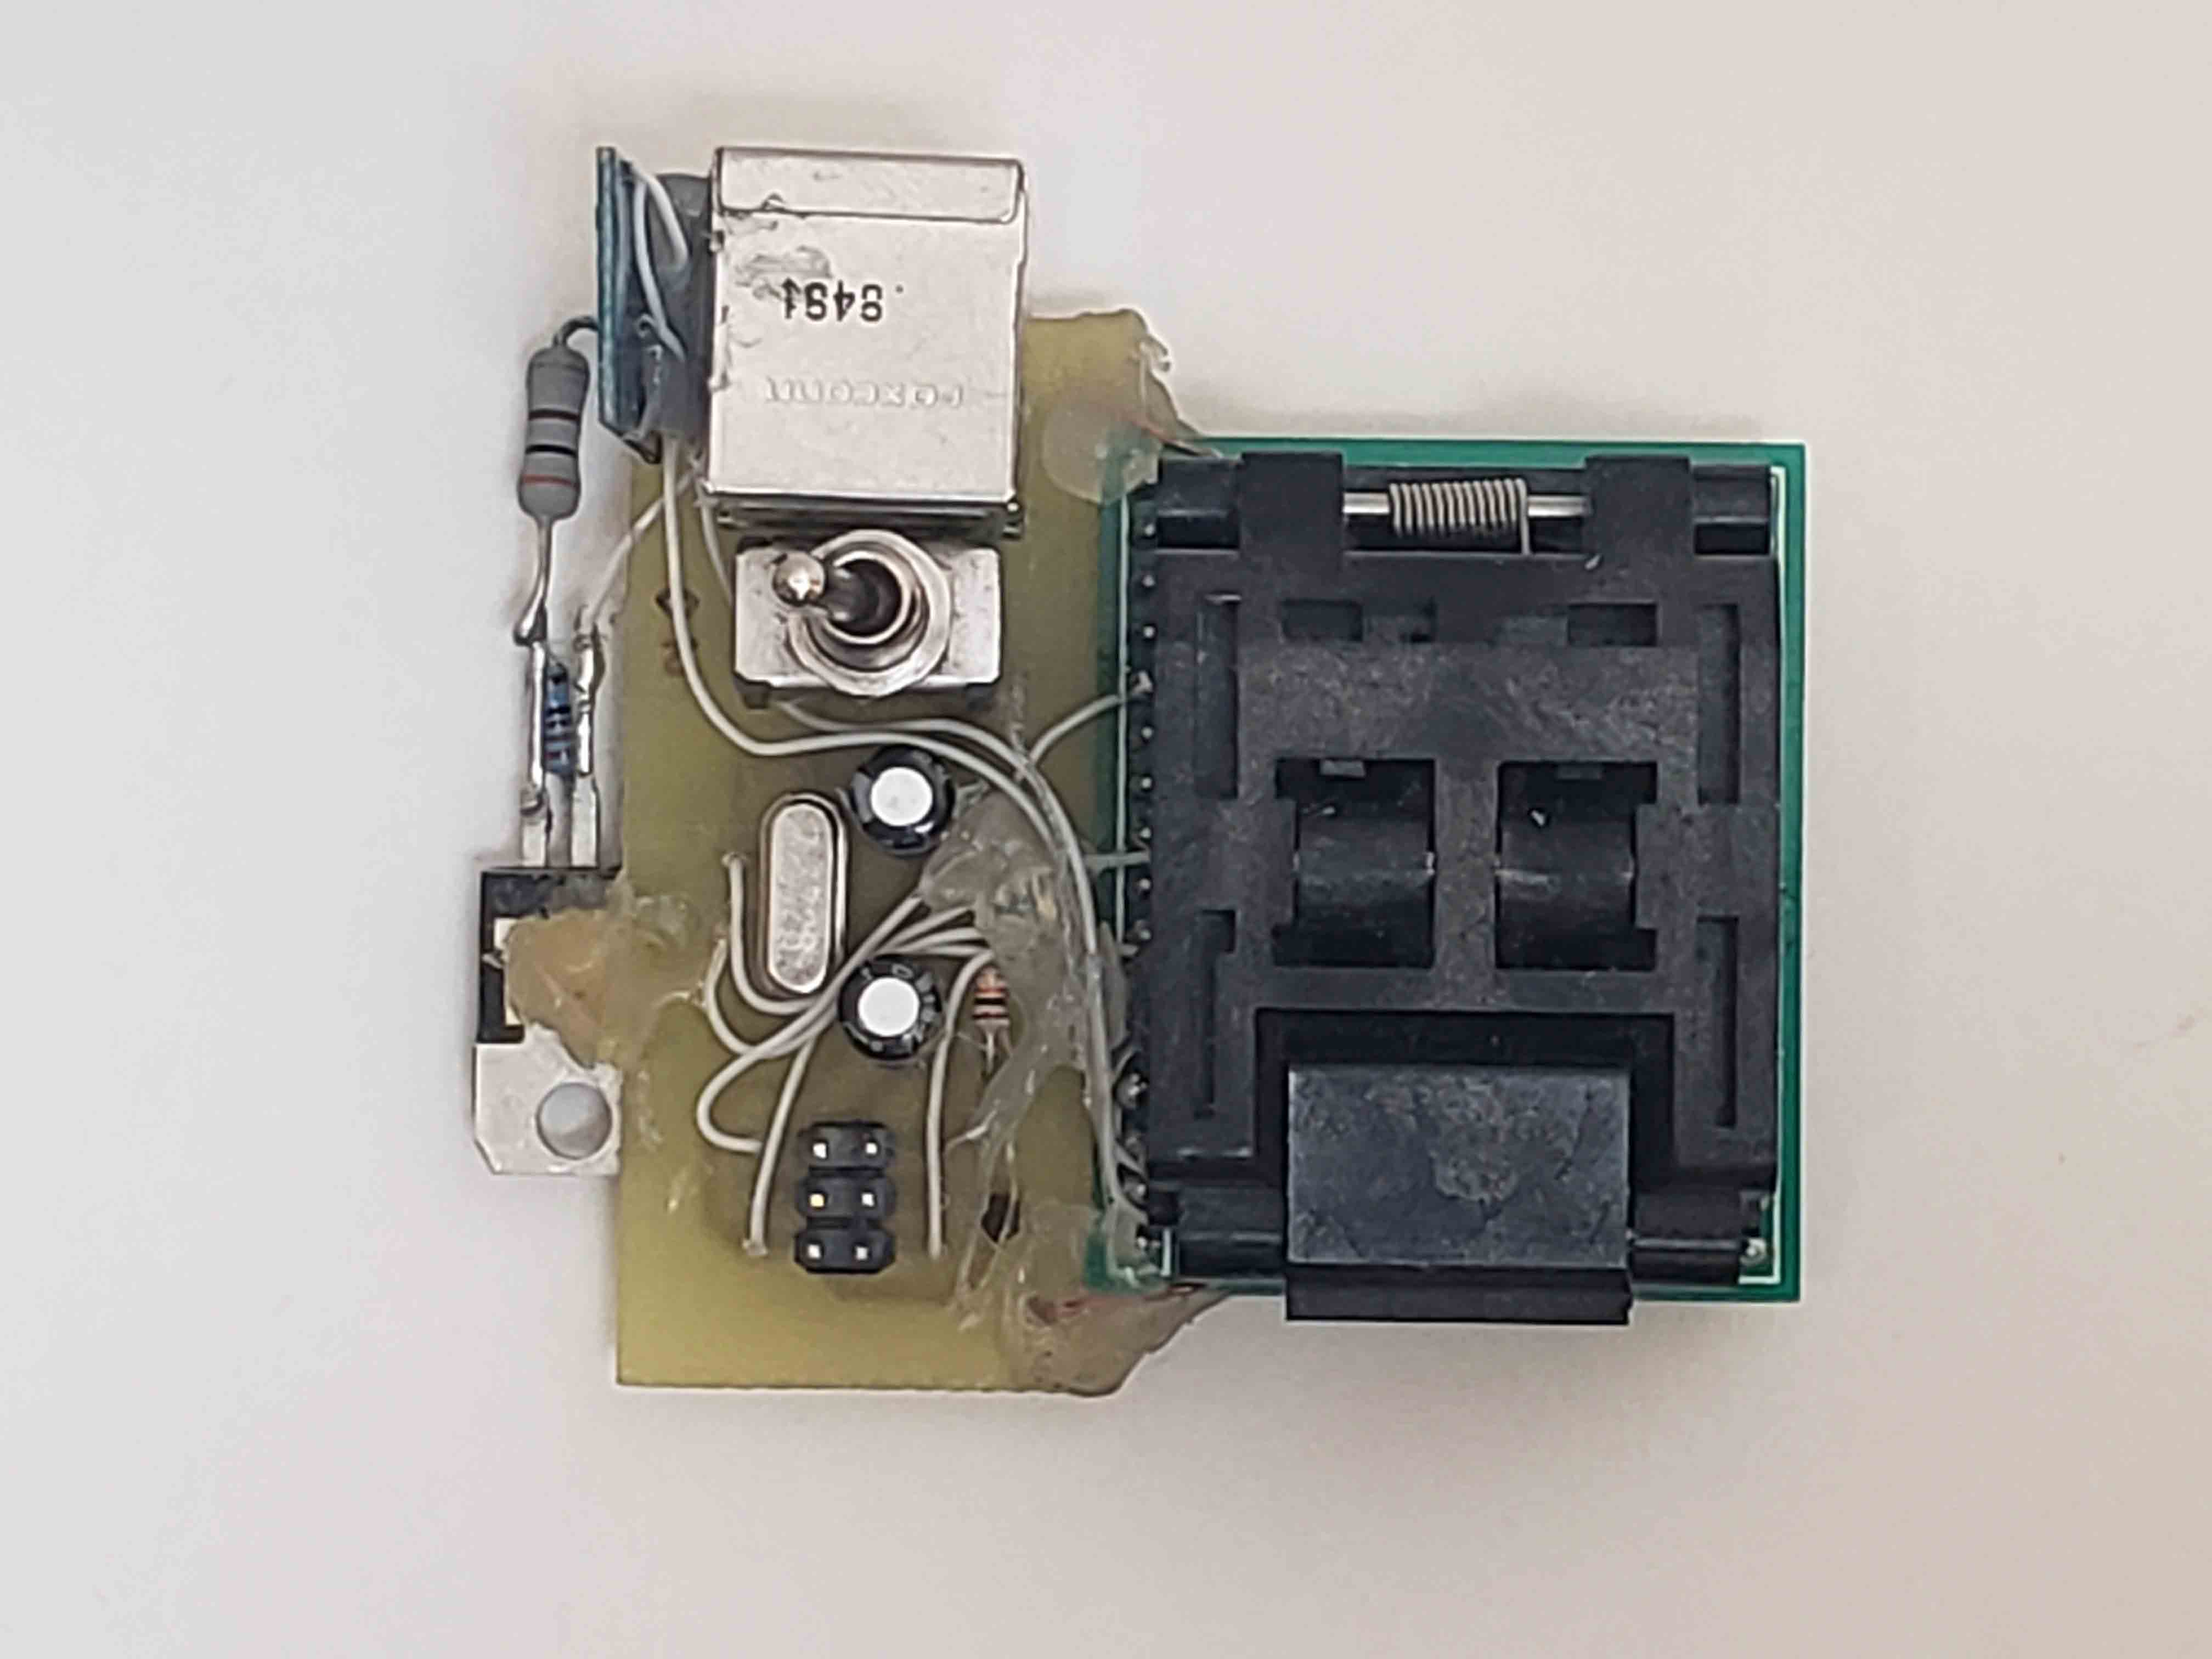
Second ECG Prototype – Programmer – Fig. 2
ATMega MCU is interfacing with BT4 Module and USB power supply.
Second ECG Prototype – Programmer – Fig. 1
ATMega MCU is interfacing with BT4 Module and USB power supply.
August 2014
Concept Design
June 2014
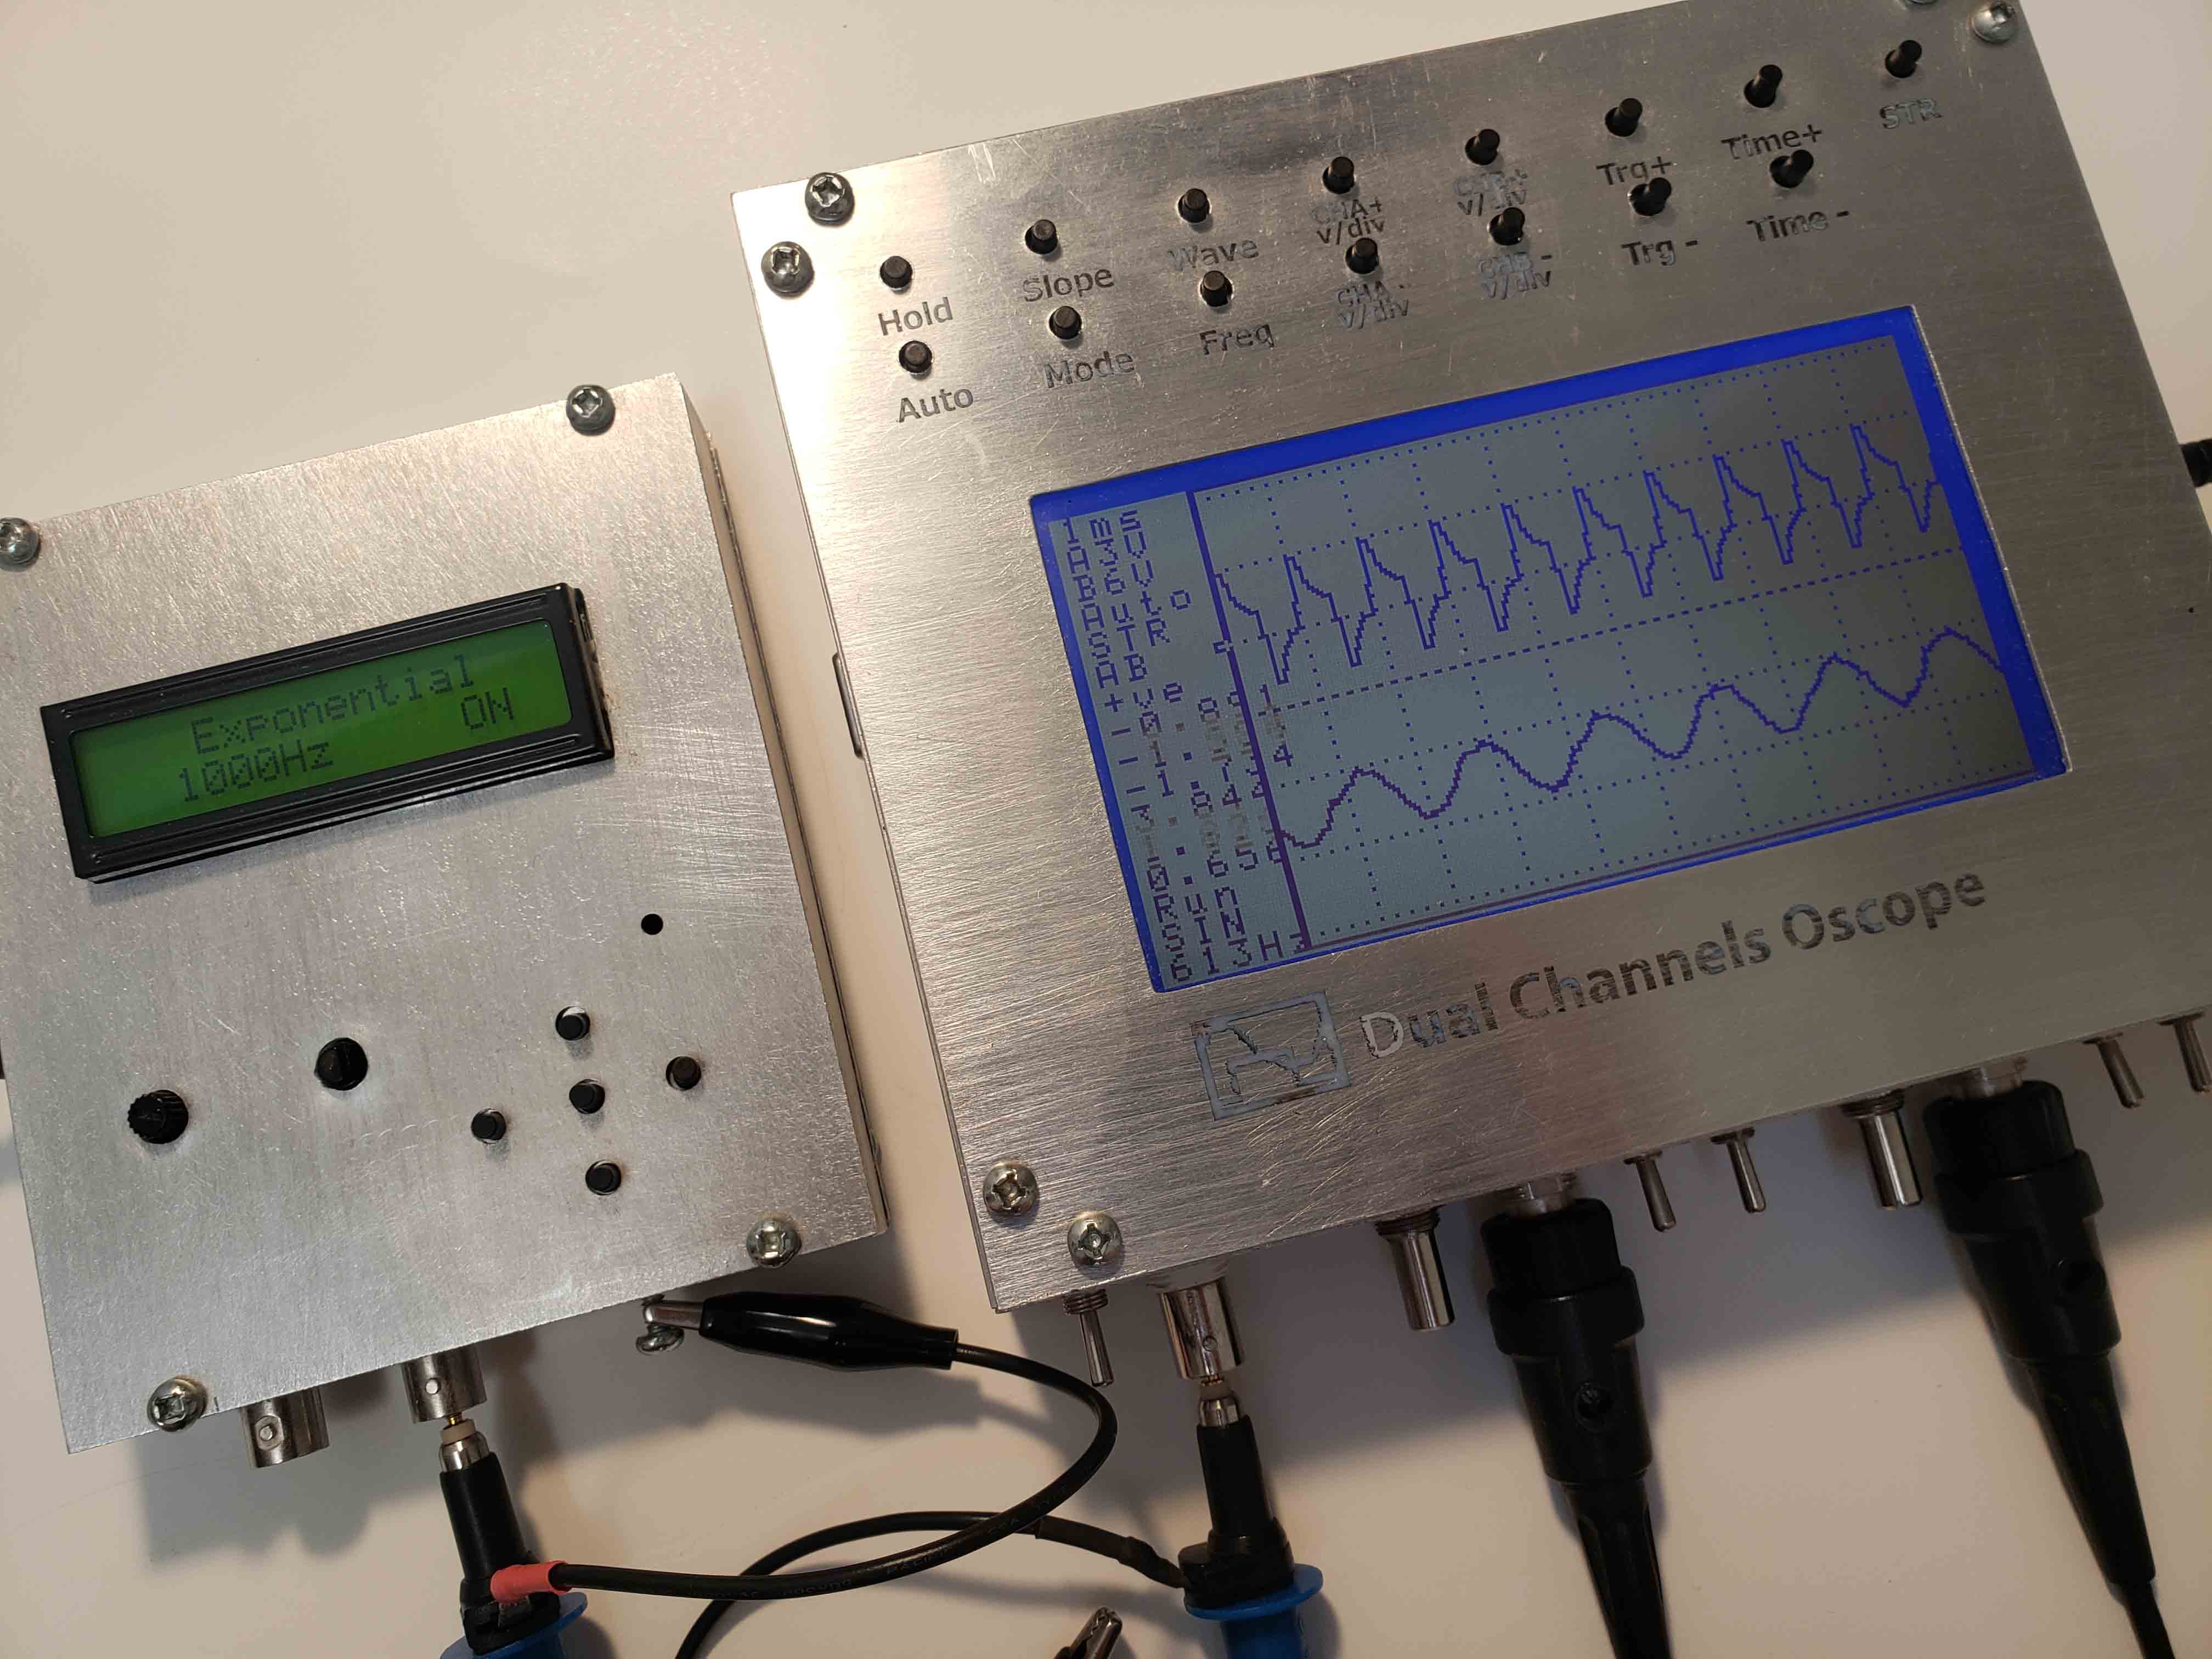
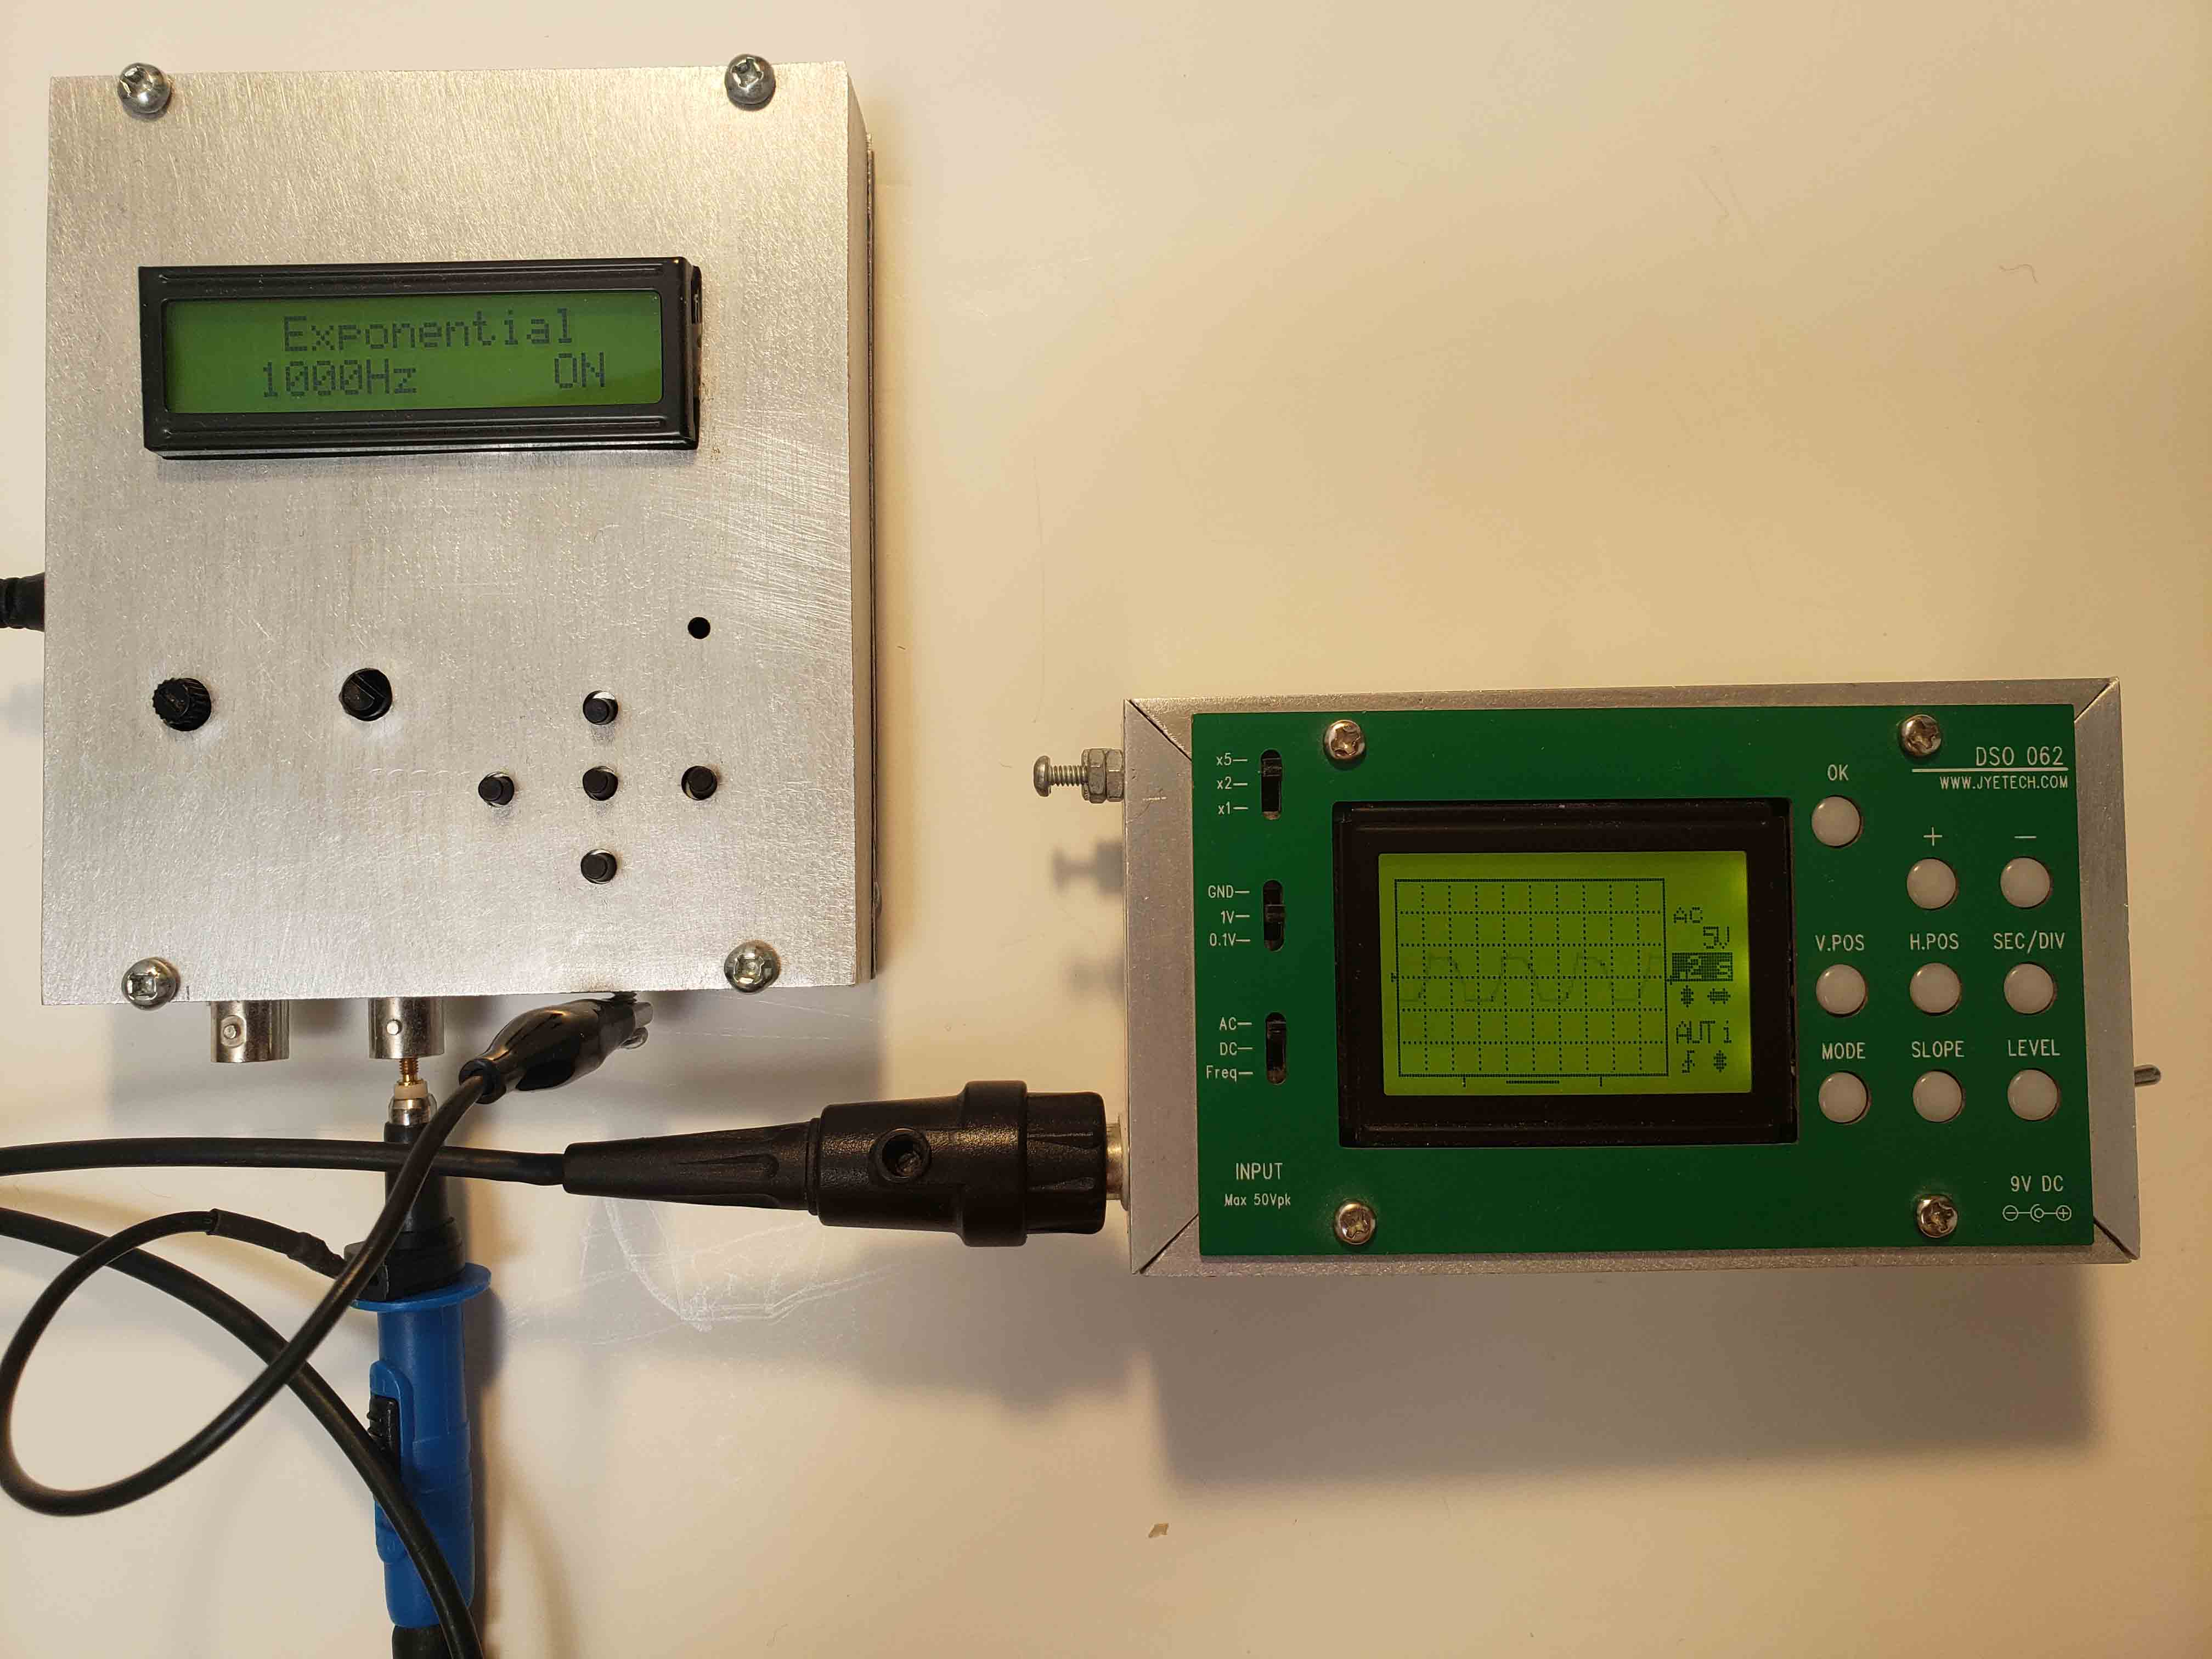
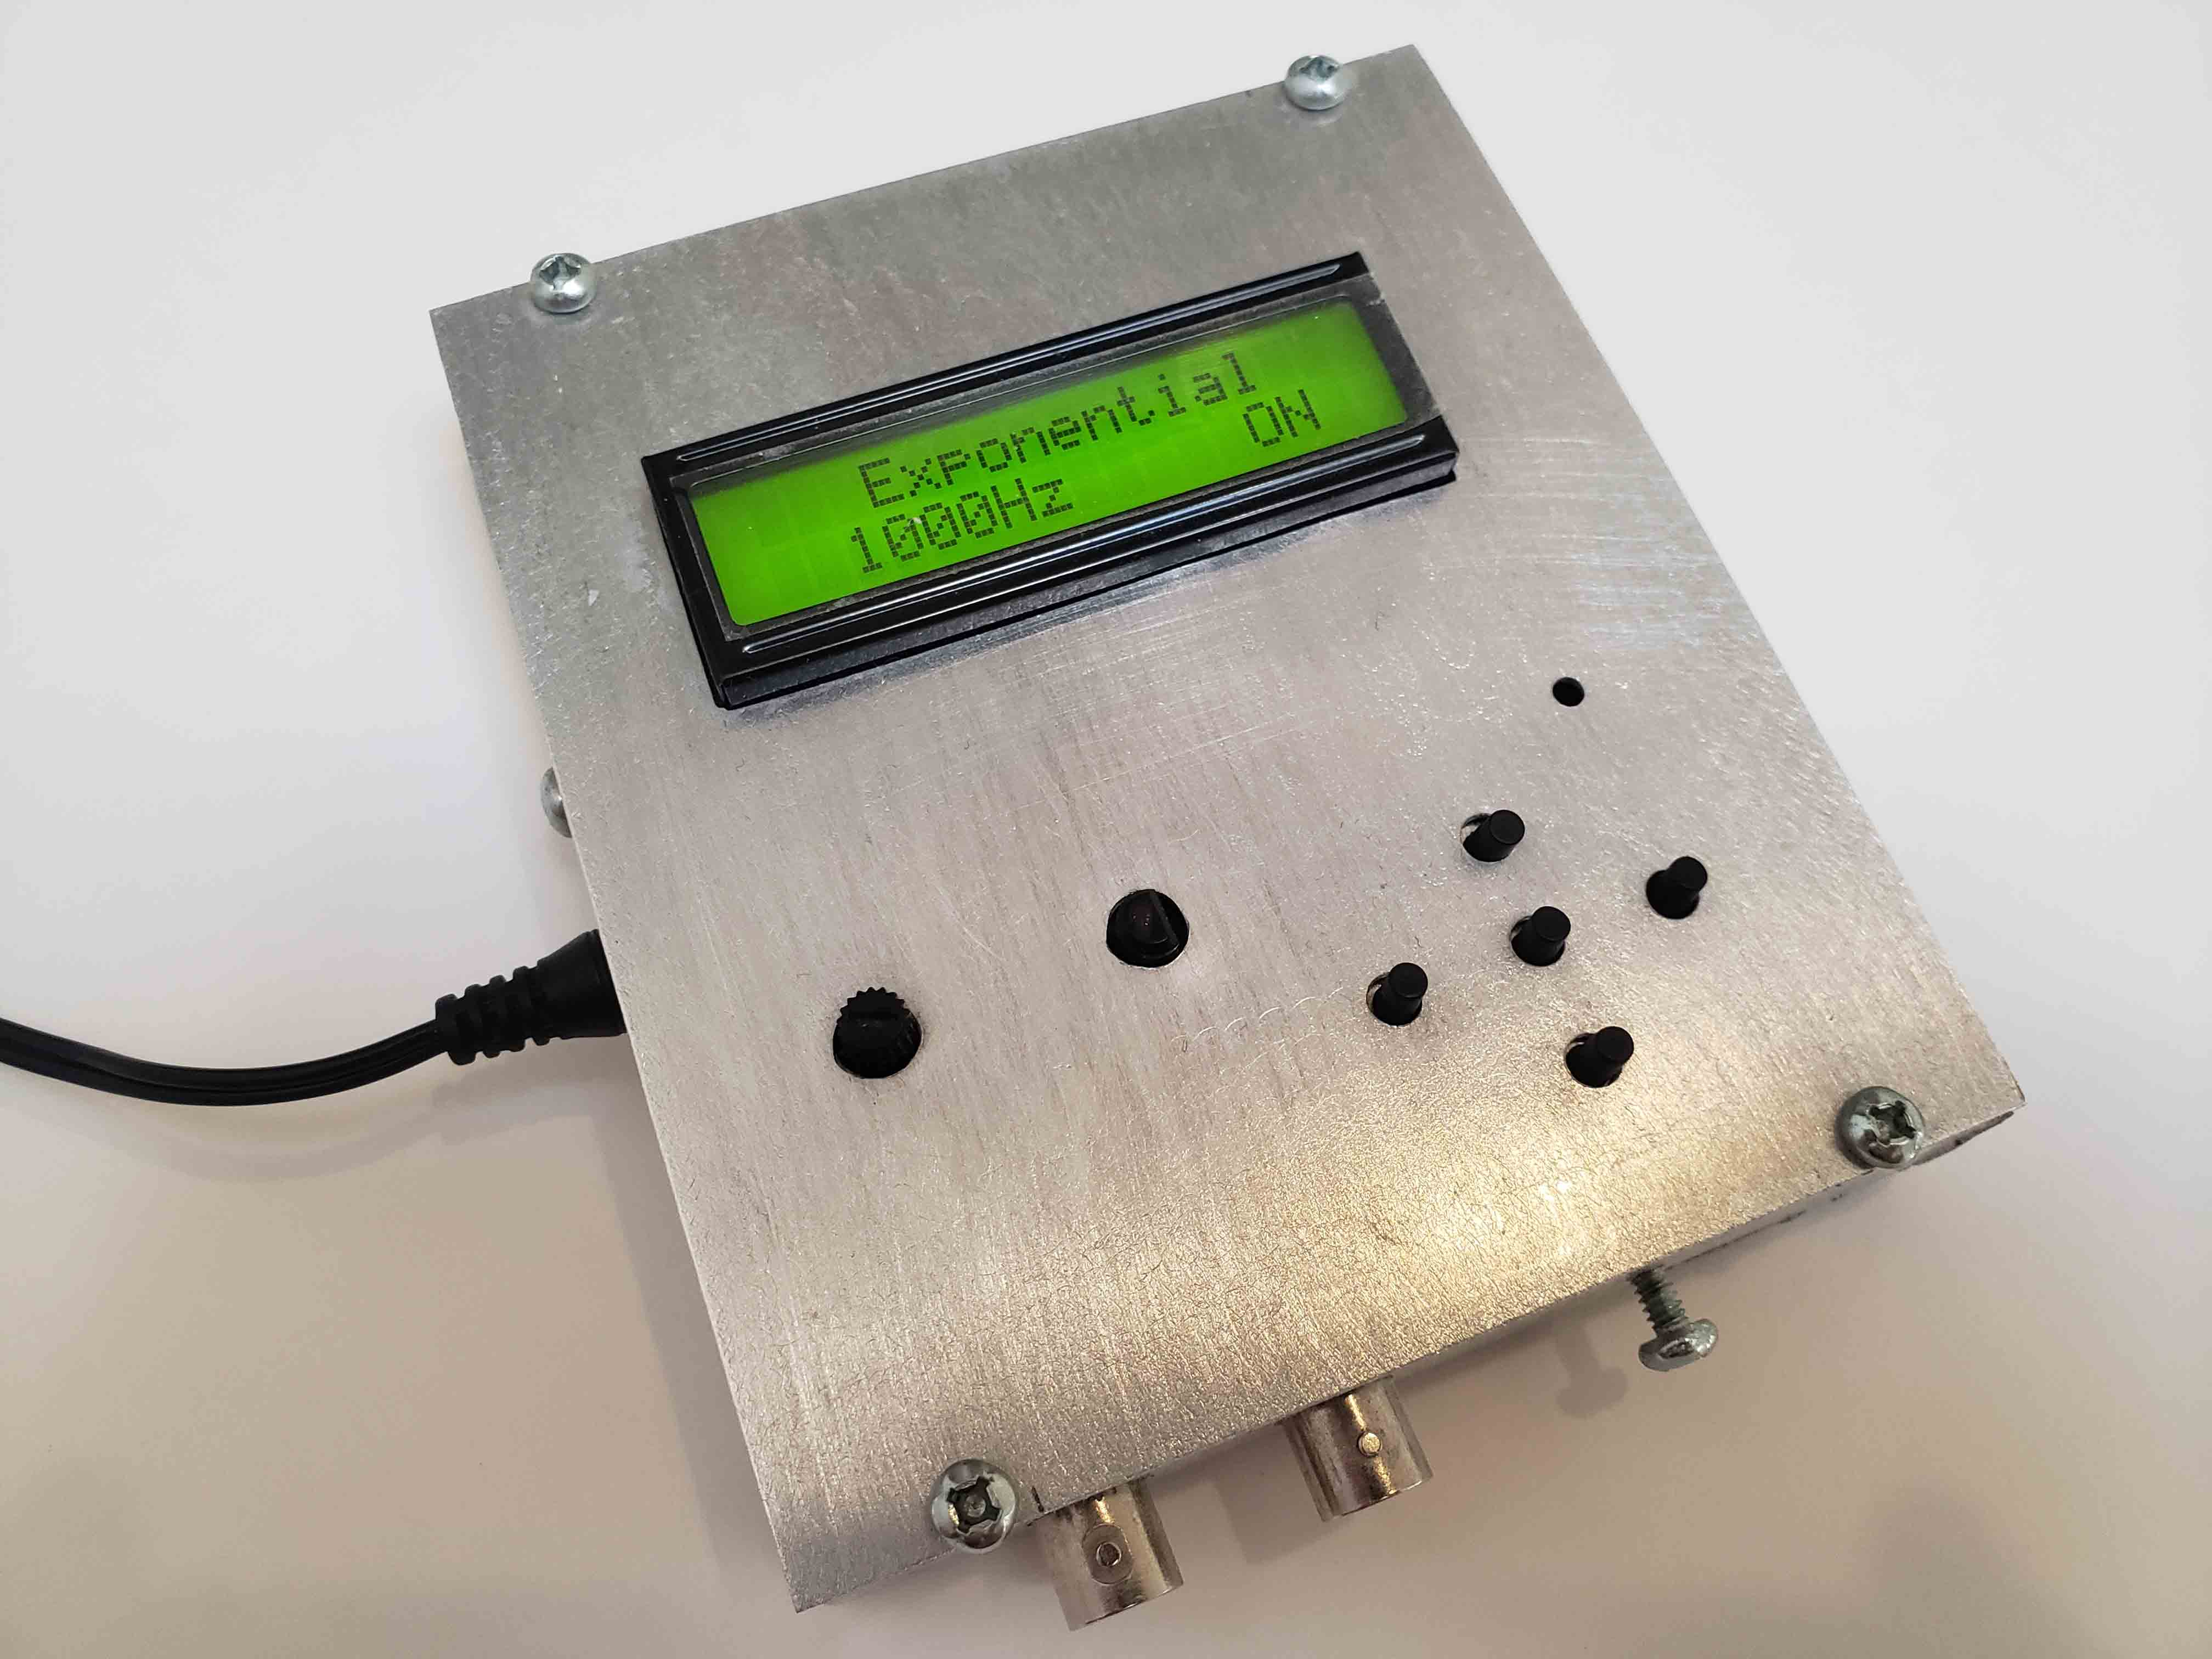
Waveform Generator with Dual Channel Oscilloscope
Function Generator running with Oscilloscope

Function generator generate wave form:
    SIN, EXP, SQR, SAW, RAW and ECG.
Function generator generate frequency:
    1, 10, 100, 1000, 10000, 100000, 1MHz
Difference frequency and wave form are
generated to oscilloscope to check the
distortion.
April 2014
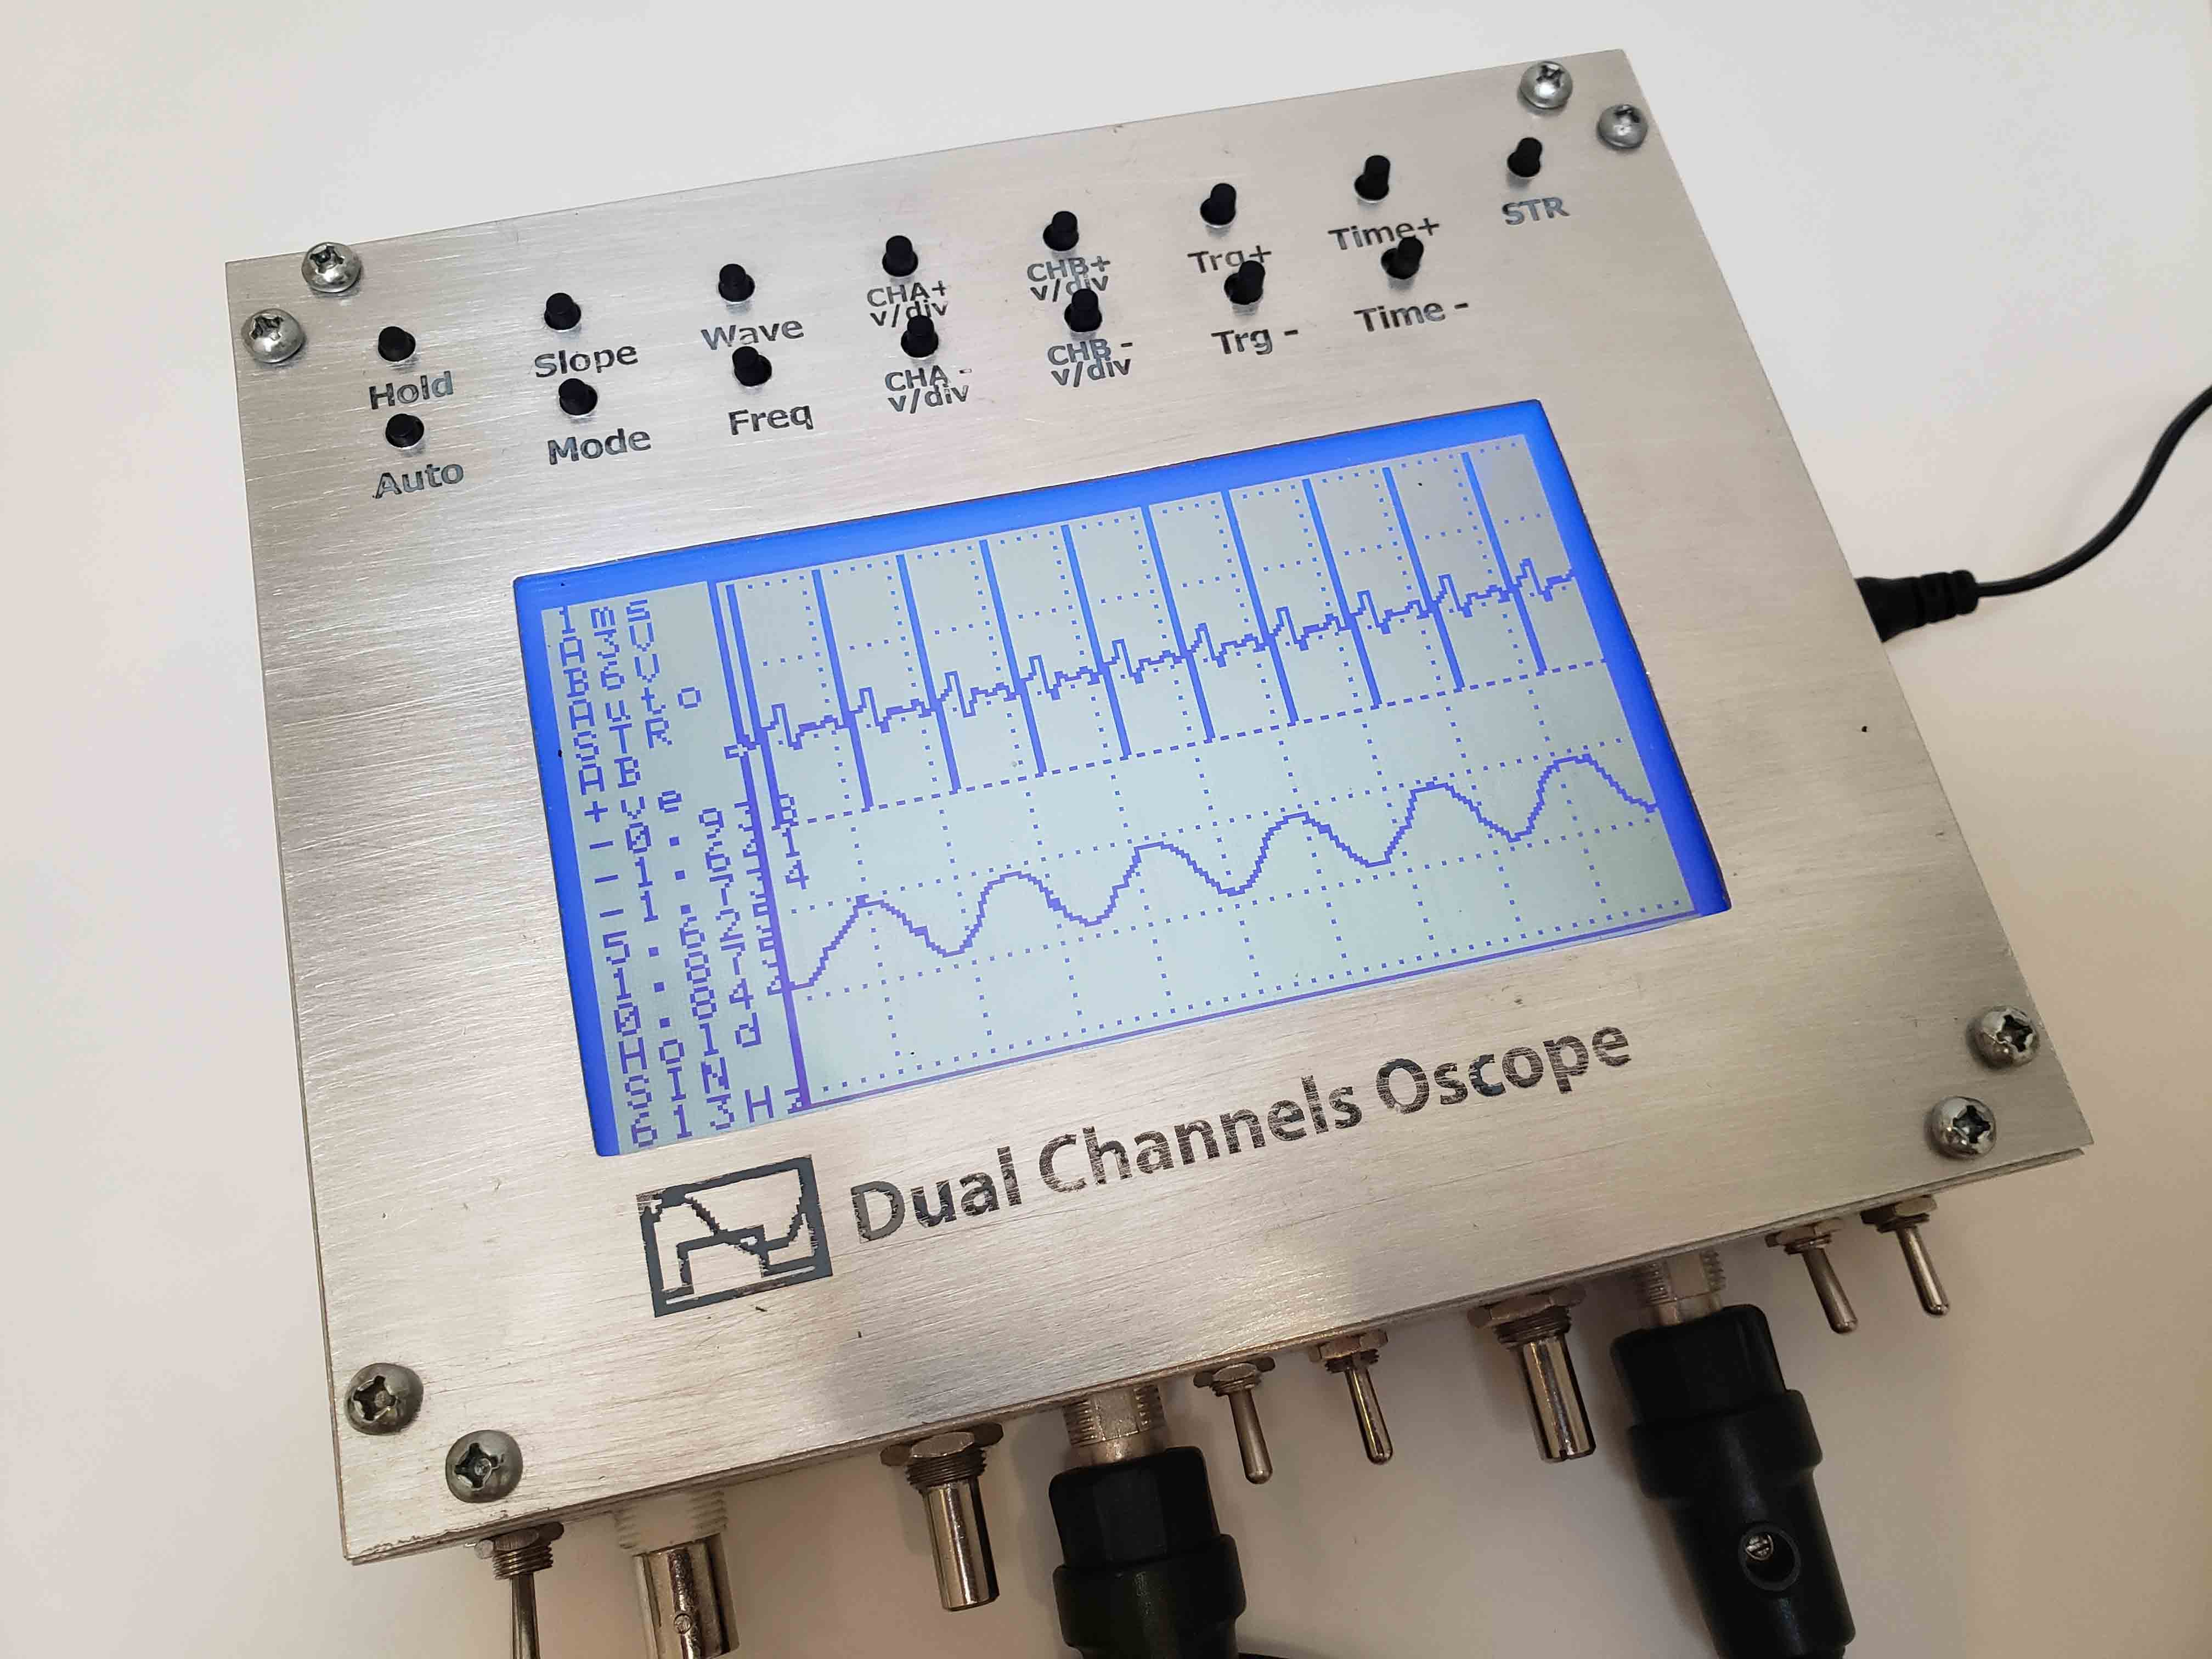
Dual Channels Oscilloscope
Build a Dual Channels Oscilloscope

Specification:
Dual Channels Oscilloscope
Maximum sample frequency: 40MSPS
Maximum input frequency: 5MHz
Maximum displayed frequency: 10MHz
Input circuit bandwidth: 20MHz
Display resolution: 240×128
Trace resolution: 200×125
Sensitivity: 0.1V/div, 0.3V/div, 0.6V/div,
             0.9V/div, 3V/div, 6V/div,
             9V/div, 20V/div,
Coupling: AC, DC
Input impedance: 10K
Power supply: single DC source 8V..10V, 1A
No incremental mode
Time base A & B: 1s/div, 500ms/div, 200ms/div,
                 100ms/div, 50ms/div/, 20ms/div,
                 10ms/div, 5ms/div, 2ms/div,
                 1ms/div, 500us/div, 200us/div,
                 100us/div, 50us/div, 20us/div,
                 10us/div, 5us/div, 2us/div,
                 1us/div, 500ns/div
Trigger: digitally adjustable
Trace offset: digitally adjustable
Mode: A, B, A+B, AB-A, AB-B
Frequency Generator: 2.5Hz, 20Hz, 153Hz, 304Hz,
                     613Hz, 766Hz, 920Hz, 1225Hz,
                     1750Hz, 2500Hz
Waveform: SIN, EXP, TRI, SAW, RSW, SQR, RND, ECG
July 2013
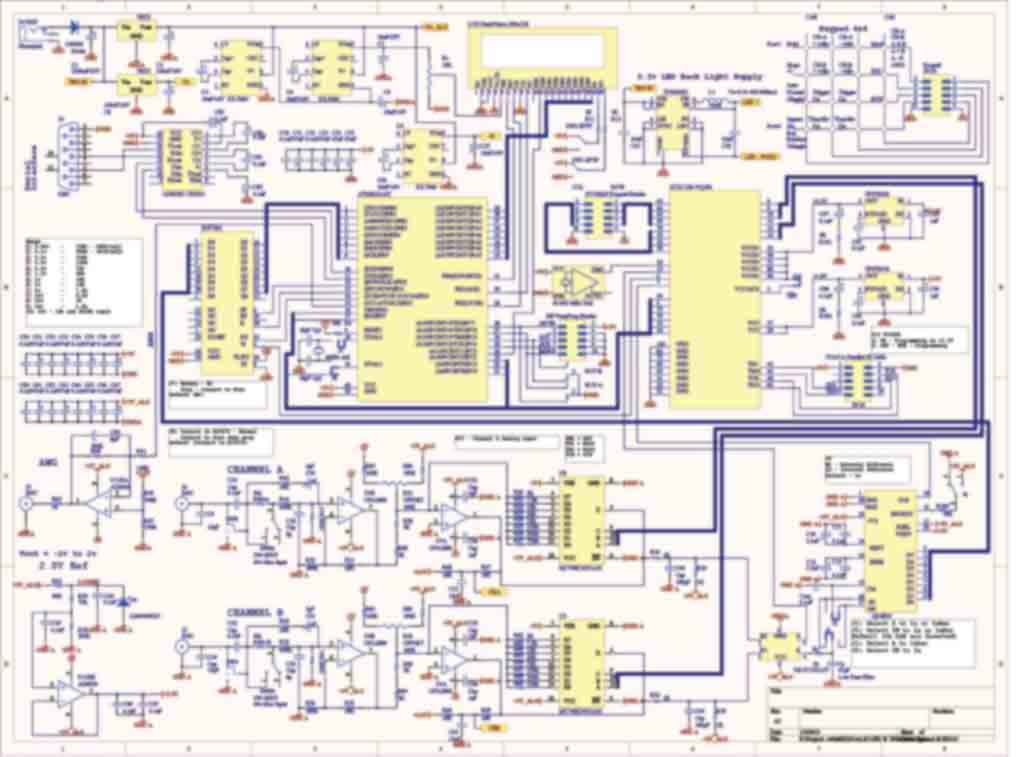
Dual Channels Oscilloscope Schematic
January 2013
Waveform Generator & Single Channel Oscilloscope
Testing single channel oscilloscope by waveform generator.
December 2012
Waveform Generator
Waveforms: Sine, Rectangle, Triangle, Saw Tooth
Output frequency: adjustable from 0.5 Hz to approx. 25 kHz in 0.5 Hz increments
July 2012
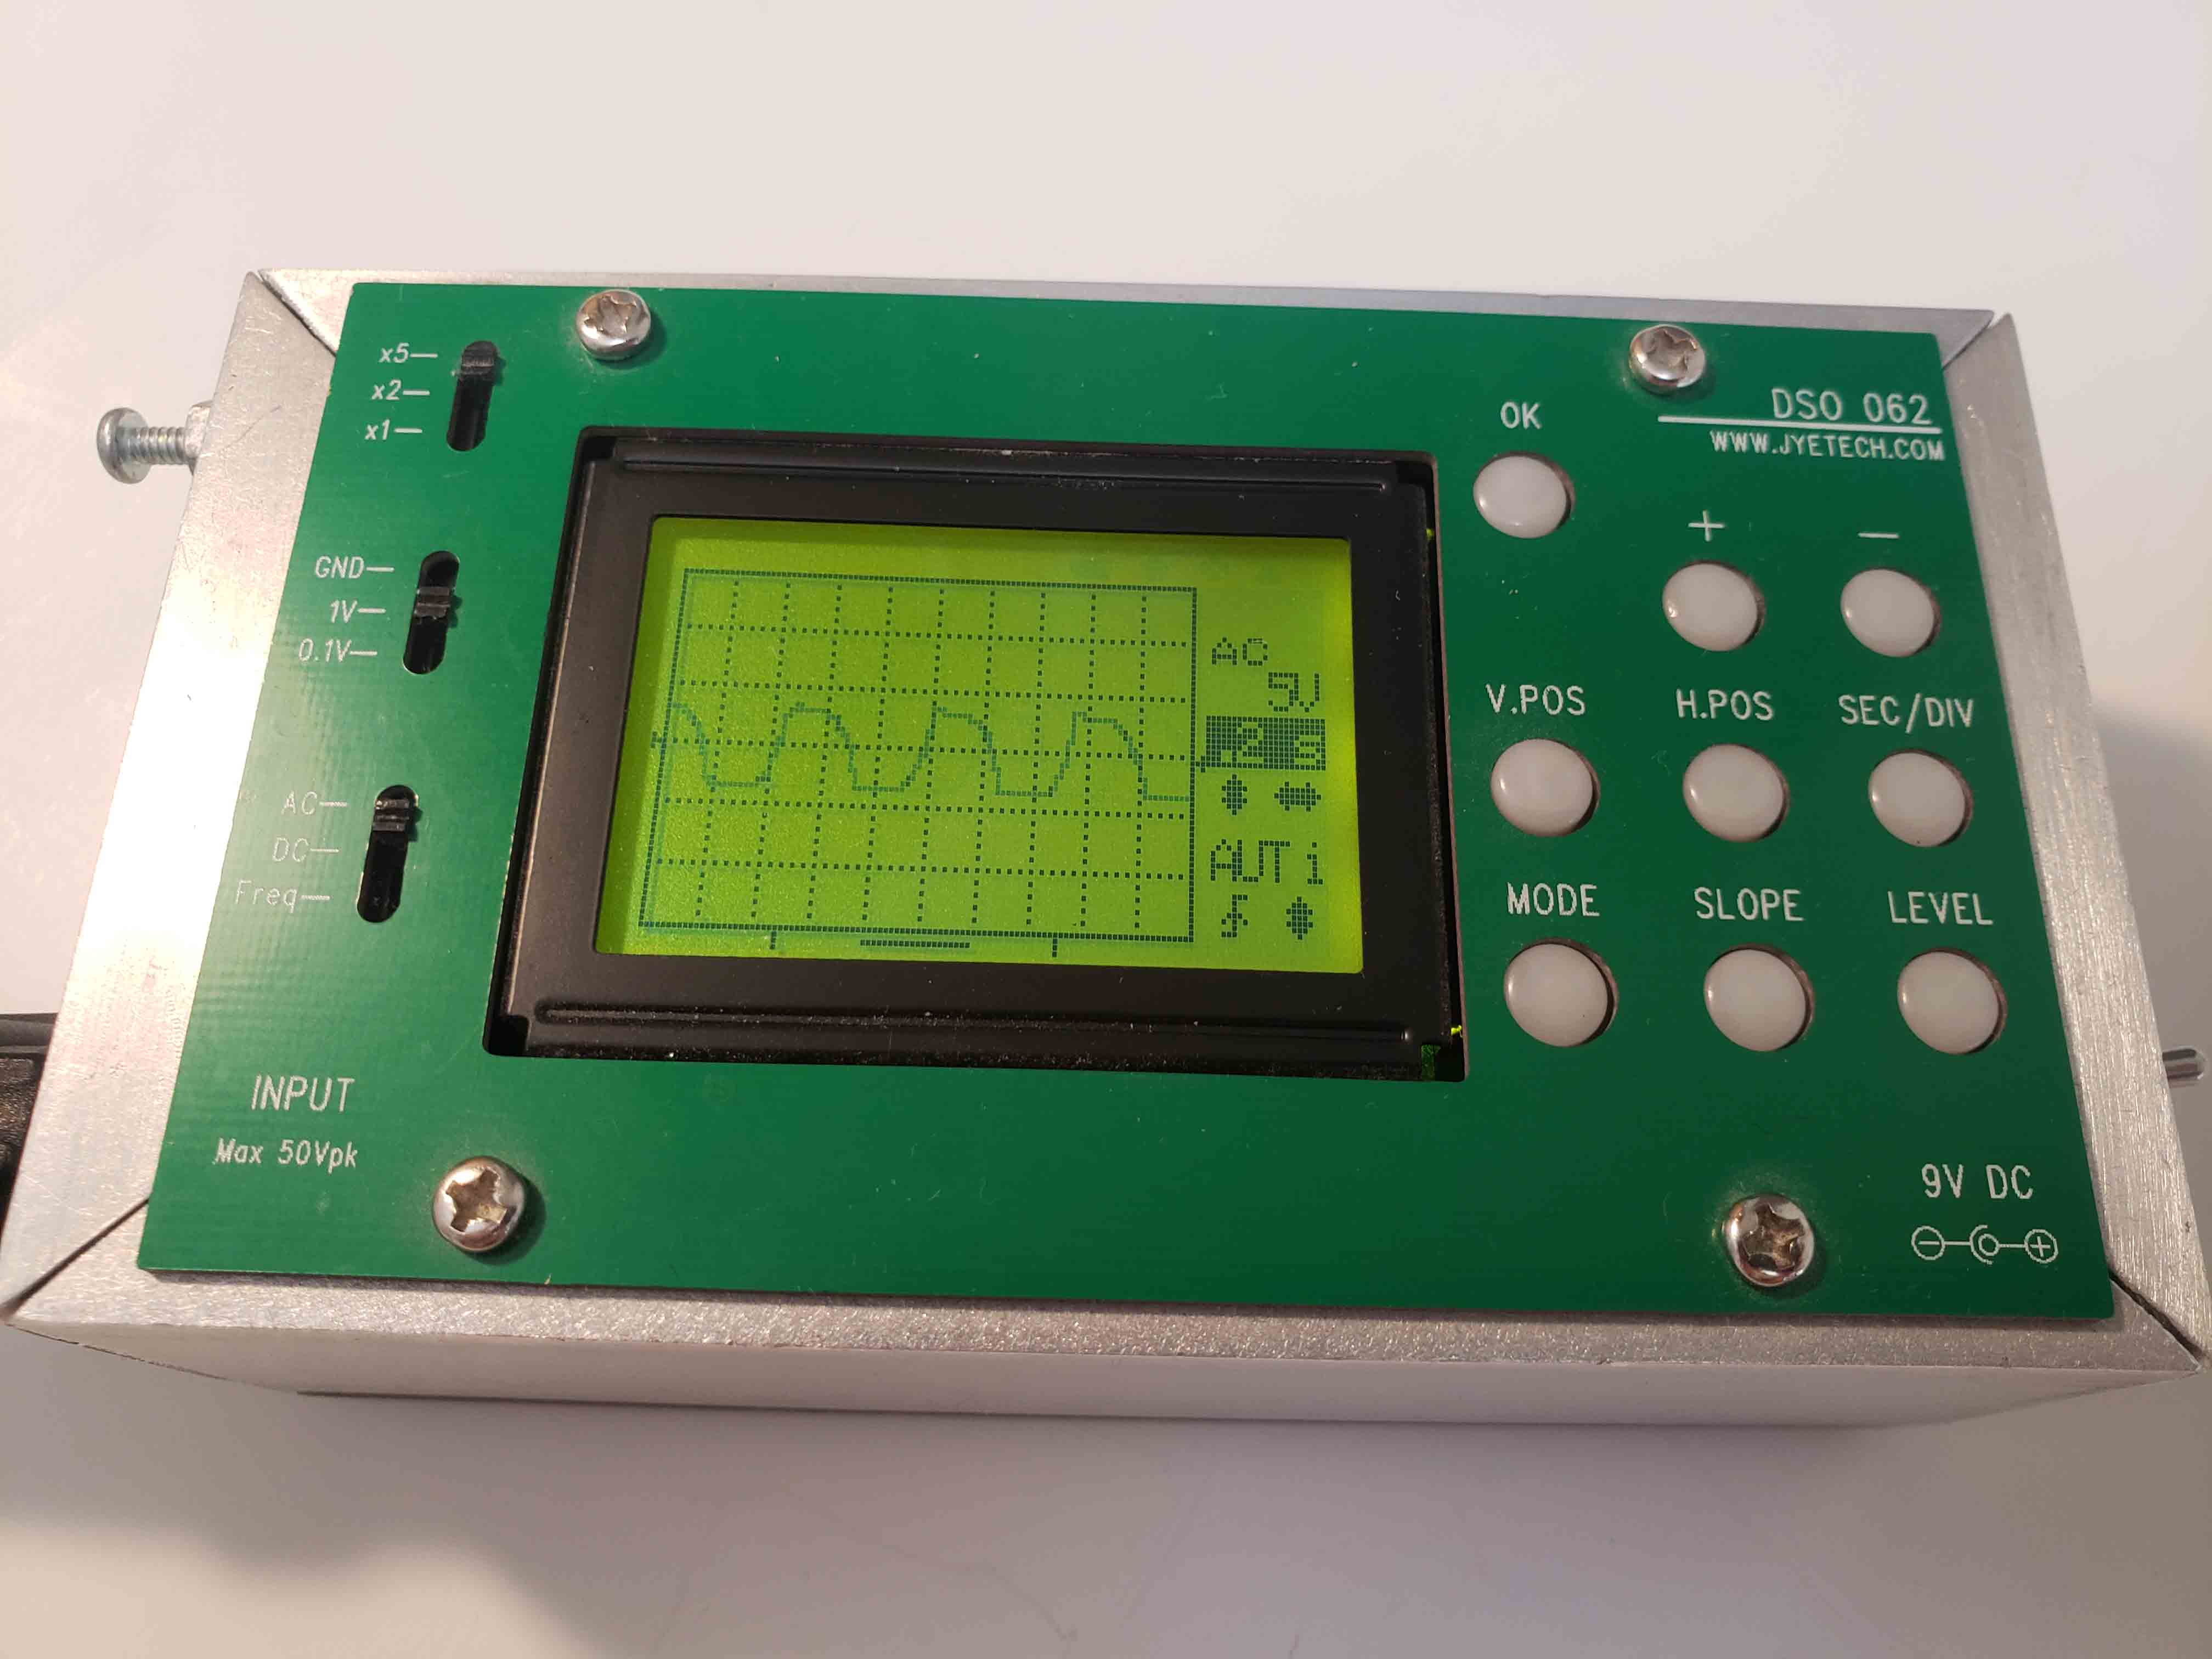
Single Channel Oscilloscope
Reference: www.jyetech.com
Model: DSO 062
February 2012
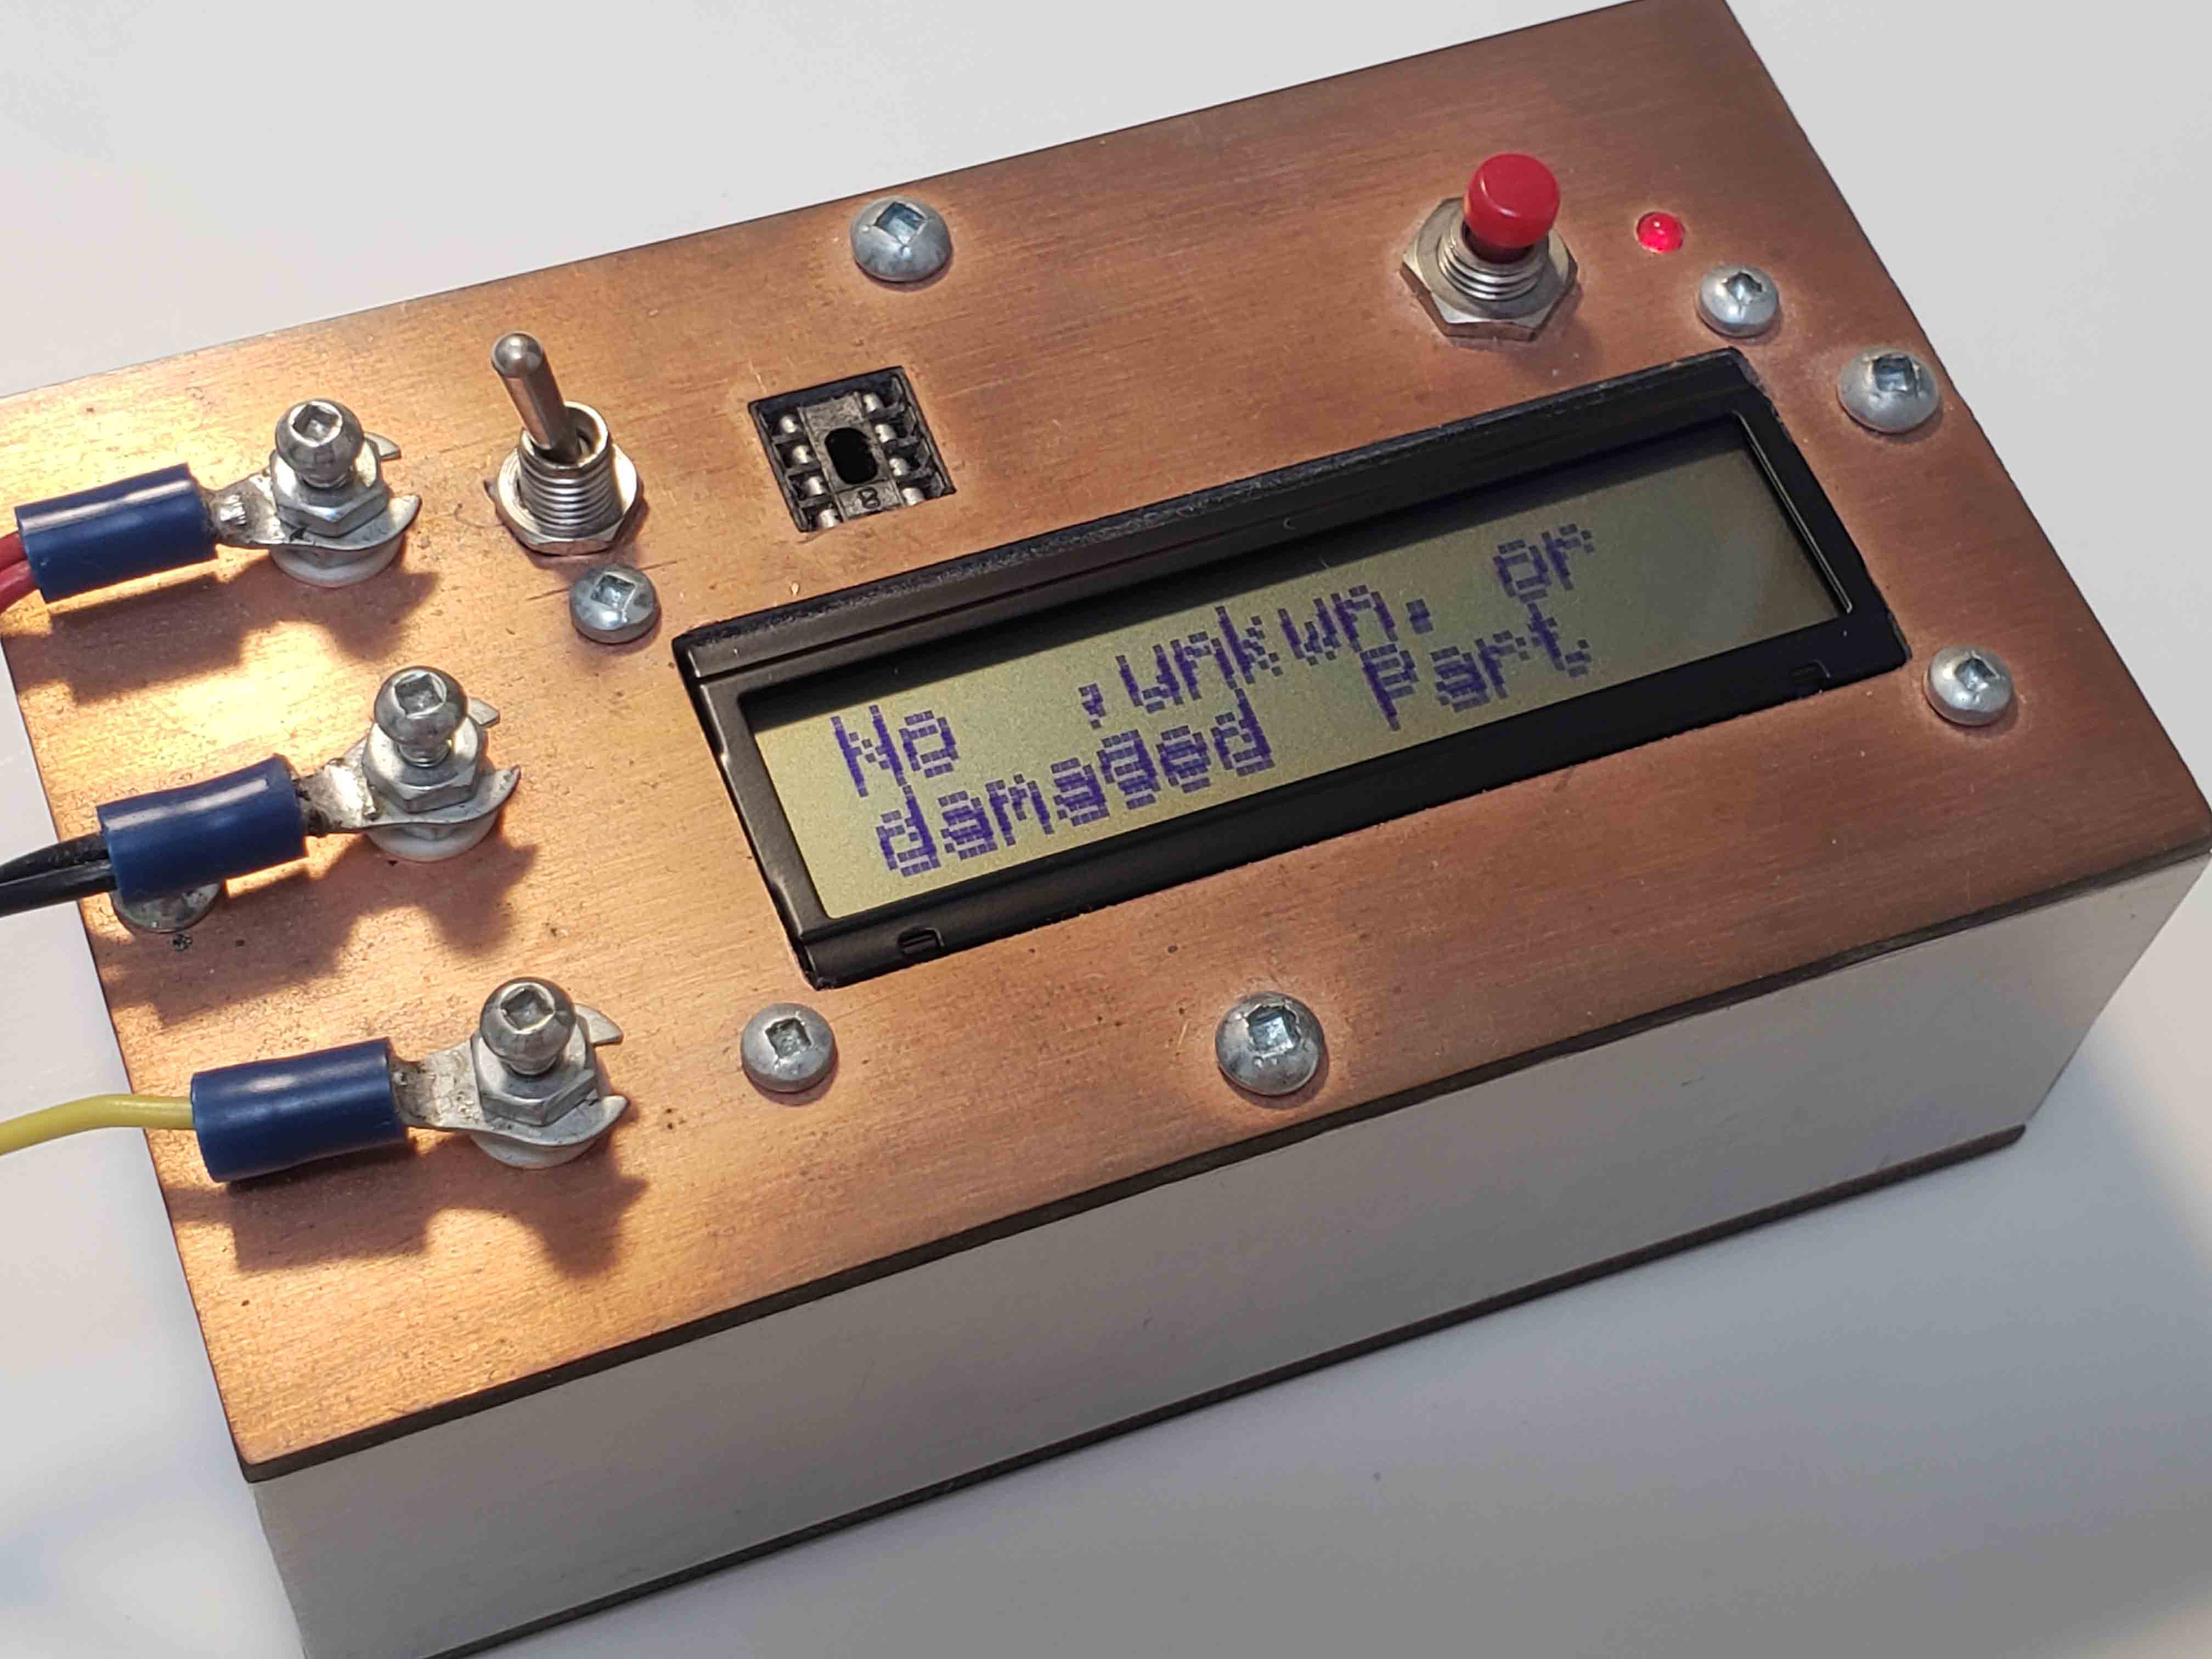
Electronic Component Tester
Transistors, MOSFETs, Diodes, Thyristors, Triacs, Resistors and Capacitors.
February 2011
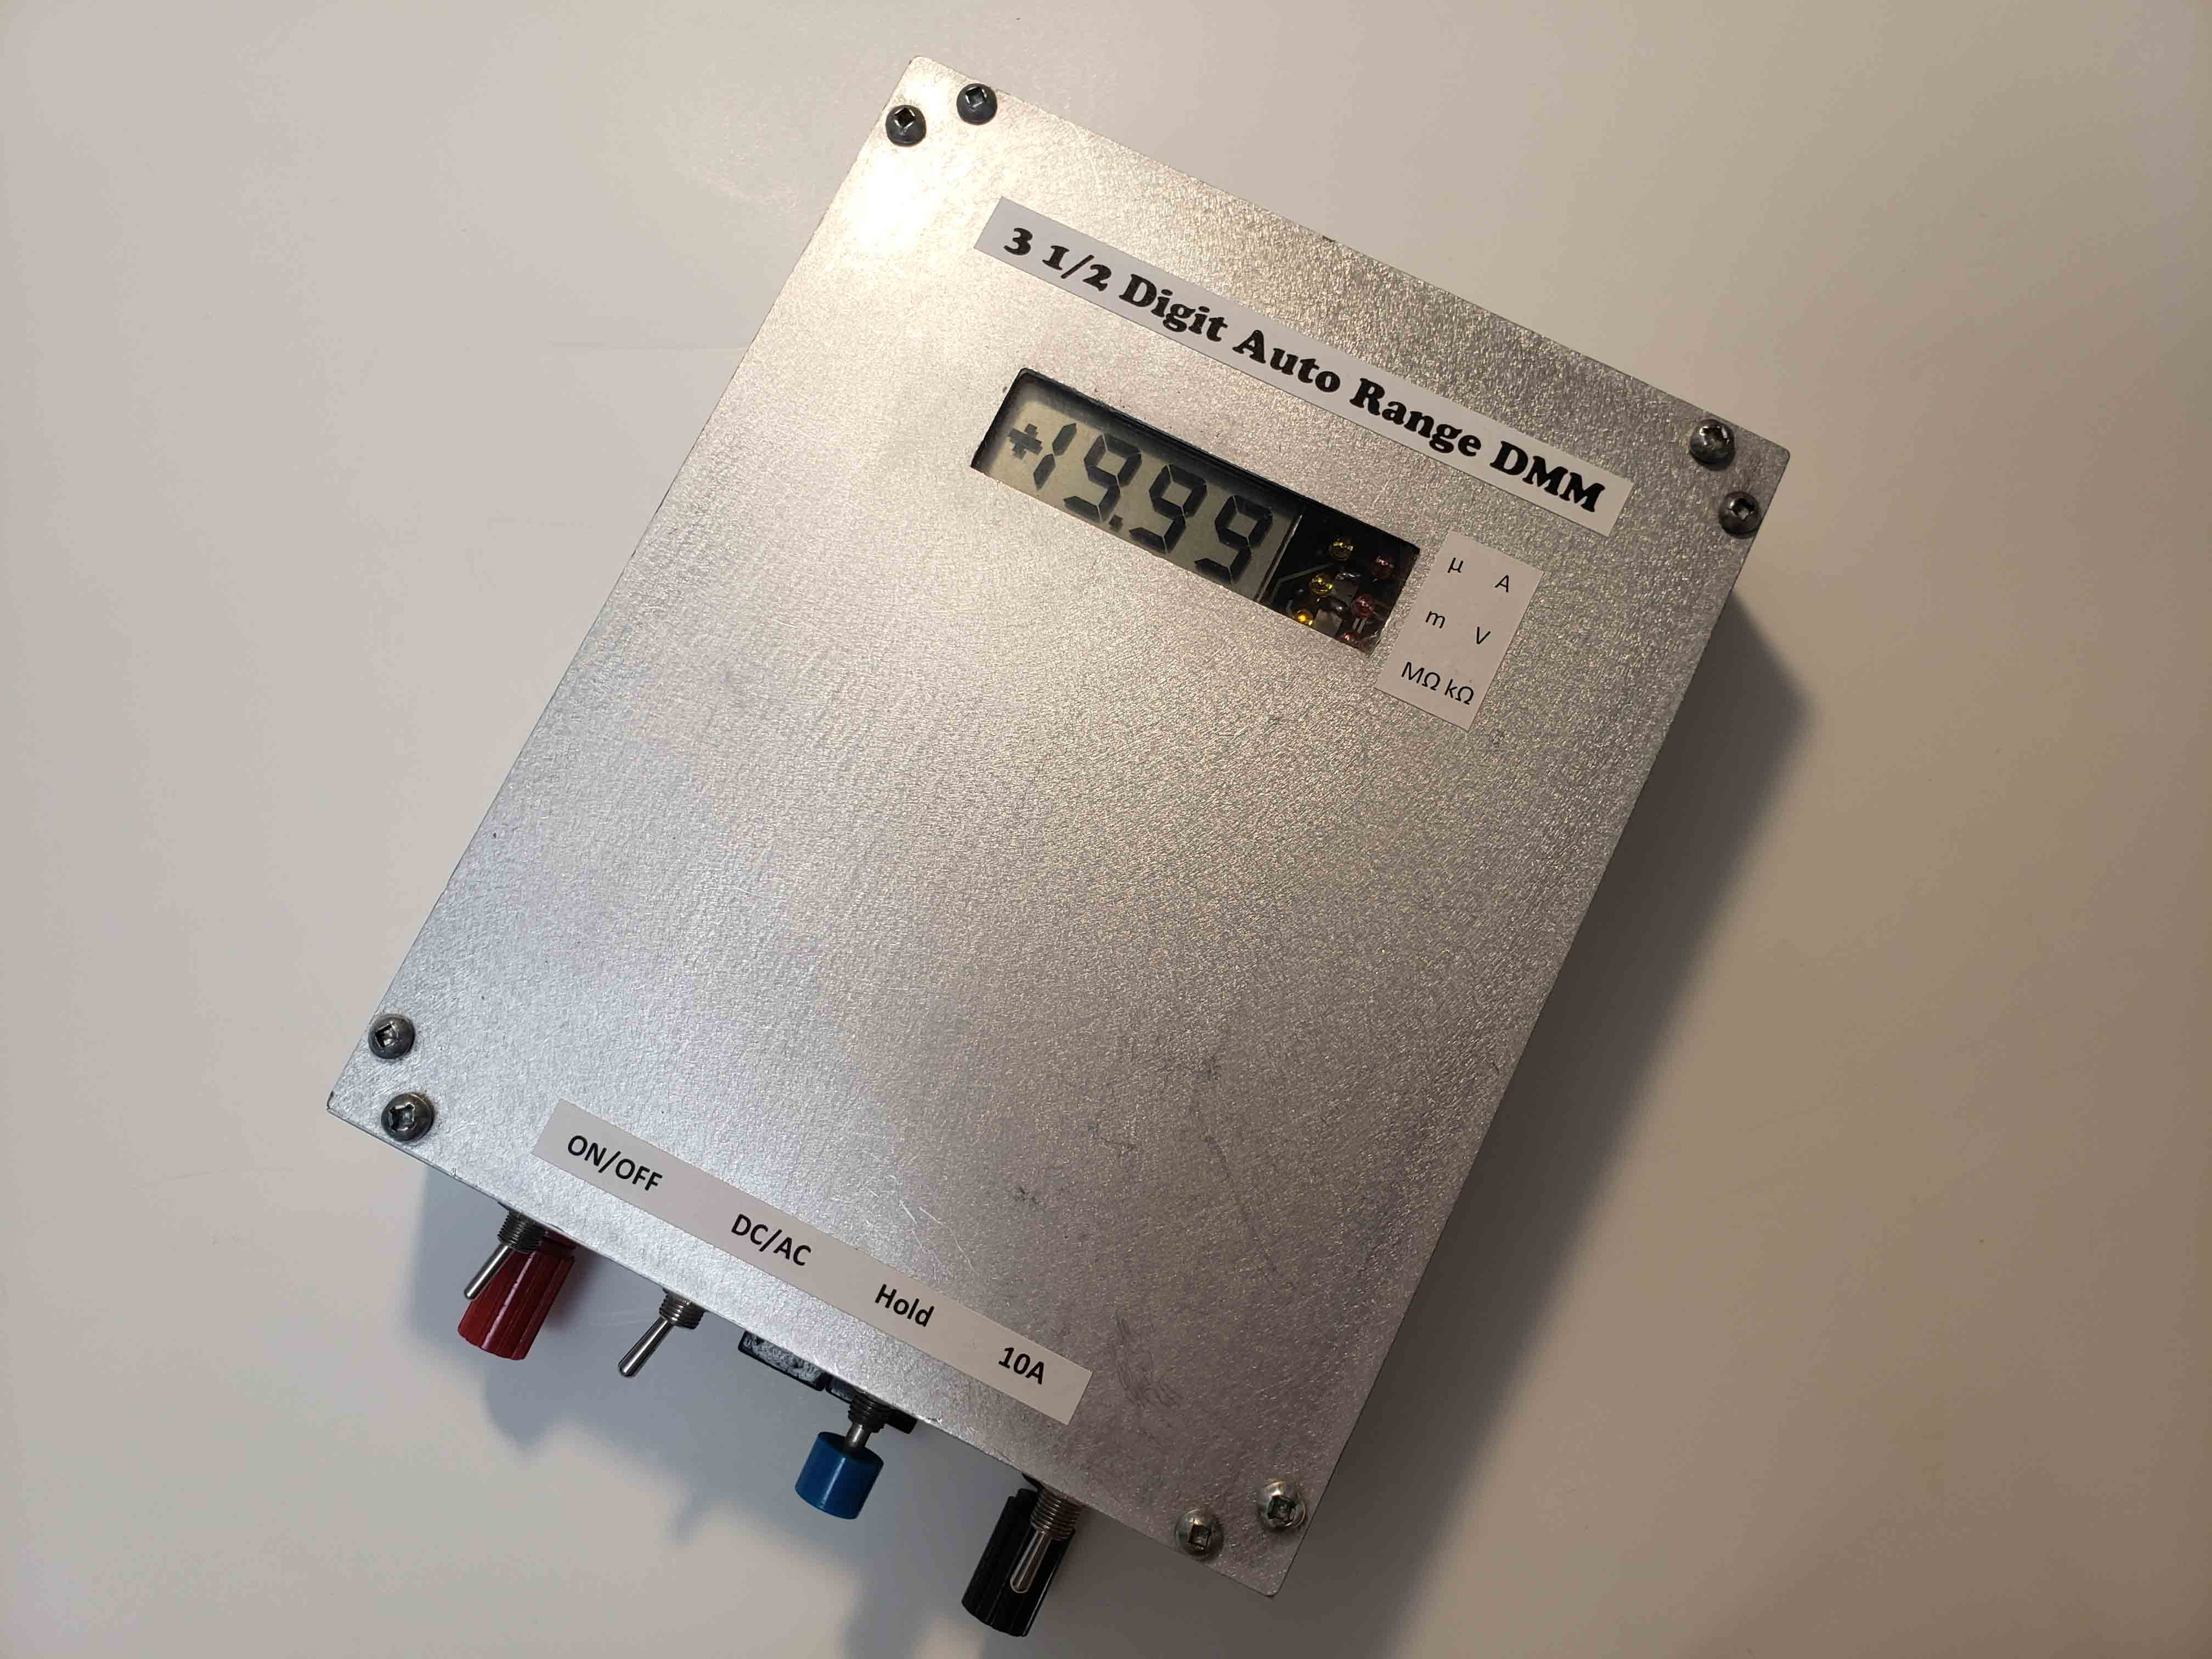
3 1/2 Digit Auto Range Multimeter
Build a 3 1/2 Digit Auto-Range Multimeter.

Specification:
Resistance: 0-19.99Mohm
Current: 1 uA - 10A
Voltage: 1 mV - 1000V
AC & DC: 50Hz
To Start a Journey
January 2011
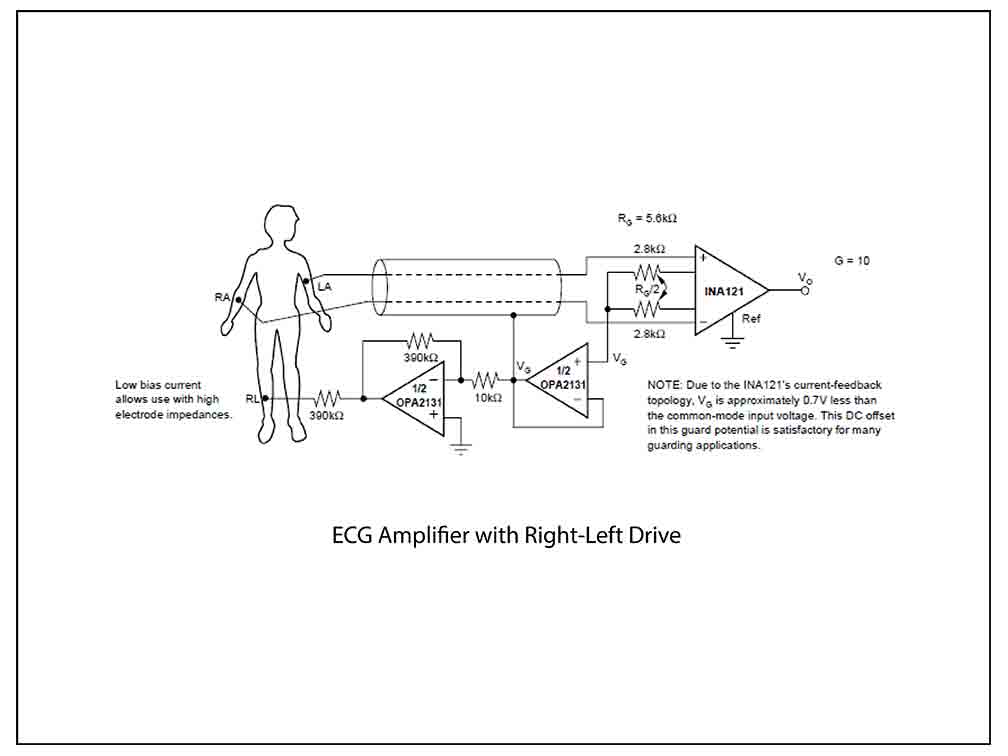
ECG Amplifier with Right-Leg Drive
Schematic from www.ti.com
ECG Amplifier with Right-Leg Drive
Reference: http://www.ti.com/lit/ds/symlink/ina121.pdf
Schematic to Build a First ECG Device
ECG Amplifier from www.ti.com is used to
build a first ECG prototype.


